15. Interface and Application programming.
May 4 2022
This week we’re going to experiment with a variety of programming languages and build an interface for one of our output or inputs from the preceding weeks.
P5.js
I started with processing’s online version, P5.js.
I was using Google’s Chrome, because it has support for serial communications through the browser. If you use another web browser, there is a high chance that the below code will not work. (and even given Google’s history, after a year or so, there’s a good chance that the below does not work either.)
The nice thing about p5 is that it’s really just a javascript library designed to run in the browser. But this means you can directly edit the code and run it using the P5 in-browser editor. You don’t need to download anything to make basic sketches.
I actually started with Processing on Wednesday, as I had never used it before. But P5 is essentially a javascript version of Processing. Processing has multiple versions of it’s library now. It has p5 for javascript, it has a python library, one for Android, and apparently one for the Raspberry Pi.
But I opened up the P5.js examples, and started going through them.
You may also find this “Getting Started” page helpful.
And a reference for different functions.
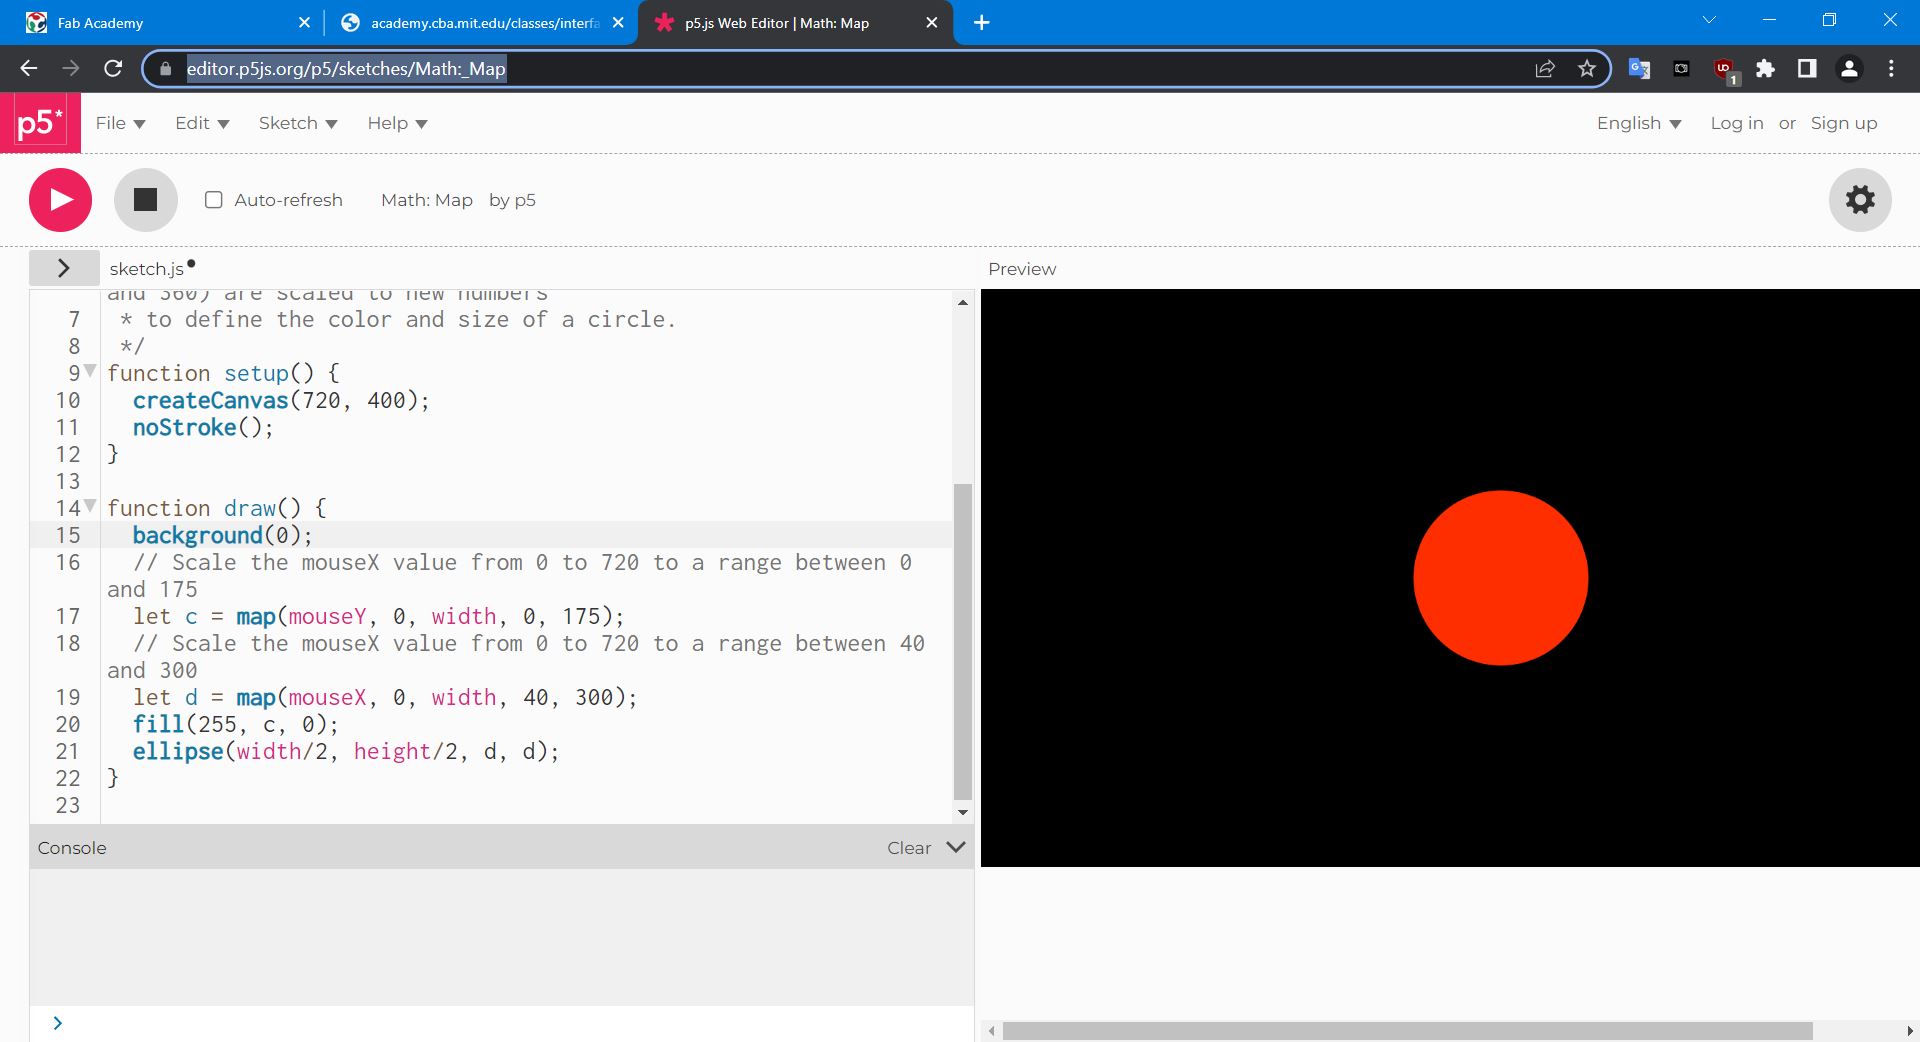
One of the first I came across was this: https://editor.p5js.org/p5/sketches/Math:_Map, which just takes mouse input, and changes the color and size of the ball based on the mouses’ location. This was a very quick and easy script to understand. I was able to change the line to “let c = map(mouseY, 0, width, 0, 175);” immediately so the ball would change size with X, but change color on Y movements. Simple, easy to understand, and quick. Cool.
And then I came across this: https://editor.p5js.org/p5/sketches/Interaction:_kaleidoscope
and this: https://editor.p5js.org/p5/sketches/Interaction:_ArduinoSensor
And this: https://editor.p5js.org/p5/sketches/Simulate:_Spirograph
And I could keep going. But they had a lot of cool examples.
And I already had about 10 ideas I wanted to try.
Don’t just copy and paste
Don’t just copy and paste. Actually type the entire program out yourself. I learned this trick from “Learn Python the Hard Way.”
It’s the best programming advice I’ve evern received. You’ll make a ton of errors by just re-typing the code, but having something to compare too, will help you find the errors relatively quickly, and it will help prepare you for the mistakes you’ll make when actually writing your own programs. Then finding this little syntax mistakes will make it so you can focus on the logic and structure errors, not just if you put the semi-colon in the correct place or not.
I also suggest you heavily comment/document the program to start. Expecially if it’s not yours, this too will help you better understand what the code does. Even if you’re not sure what it does, try to guess. You’ll thank yourself a month from now when you re-visit the code.
First P5 programs
This first one simply creates a ball that moves around the screen. It’s straight from the “Getting started” tutorial.
function setup() {
  createCanvas(400, 400);  // draws the screen where everything is shown.
}

function draw() {
  if (mouseIsPressed){   // if you click the mouse...
    fill(255,0,0);       // changes circle color to red (what circle? see below)
  }
  else{                  // otherwise
    fill(0, 0, 0);       // the color will always be white.
  }
  background(220);               // background color is greyish.
  ellipse(mouseX,mouseY,80,80);  // creates a circle, that's located where mouse location is
                                 // with a diameter of 80 pixels by 80 pixels.
}
and a second one, a combination of a sine wave generator and the above code. As you move the mouse to the right, the sine wave speeds up. As you click the mouse, the sine wave changes color. The mouse click also changes color based on position of mouse.
/*
 * @name Sine Wave
 * @description Render a simple sine wave.
 * Original by Daniel Shiffman.
 */

let xspacing = 16; //distance between horizontal location
let w; //width of entire wave
let theta = 0.0; //start angle at 0
let amplitude = 40.0 //height of wave
let period = 400.0 //how many pixels before the wave repeats
let dx; //value for incrementing x
let yvaluesl; // using an array to store height values for the wave


function setup() {
  createCanvas(710, 400);
  w = width + 16;
  dx = (TWO_PI / period) * xspacing;
  yvalues = new Array(floor(w / xspacing));
}

function draw() {

  background(210);
  //ellipse(mouseX,mouseY,50,50);
  calcWave();
  renderWave();
}

function calcWave(){
  //increment theta (speed of wave), include mouse y position to speed it up
  theta += 0.04 + (mouseX * 0.0002);

  //for every x value, calculate a y value with sine function sine function
  let x = theta;
  for (let i = 0; i < yvalues.length; i++) {
    yvalues[i] = sin(x) * amplitude + (mouseY - 200);
    x += dx;
  }
}

function renderWave(){
  noStroke();
  if (mouseIsPressed){
     fill(25,mouseX % 255, mouseY % 255);
  }
  else{
    fill(0, 0, 0);
  }
  //a simple way to draw wave with ellipse at each location
  for (let x = 0; x < yvalues.length; x++) {
    ellipse(x * xspacing, height / 2 + yvalues[x], 16, 16);
  }
}
Getting Input in to Processing, and output to your board.
The trick is to get data from your sensor, to your board, to the computer, into P5. And this may be trickier due to the fact that p5 is running in your browser, not on the computer like typical Processing/Arduino software.
A quick search came up with these: which I’m currently working my way through:
https://p5js.org/examples/interaction-arduino-sensor-data-via-webjack.html
https://www.youtube.com/watch?v=feL_-clJQMs
p5-serialcontrol setup
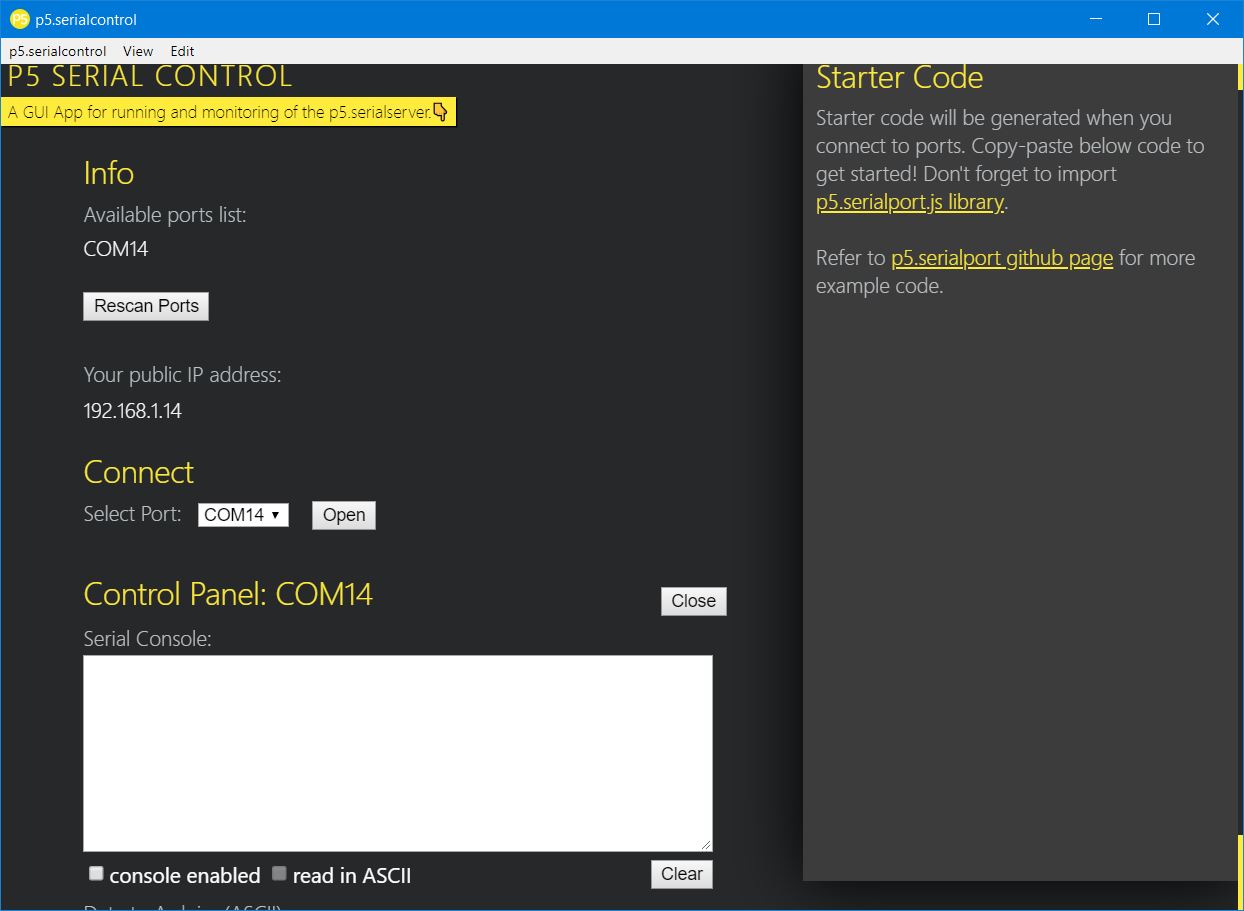
I started P5-serial control based on information from this website: https://itp.nyu.edu/physcomp/labs/labs-serial-communication/two-way-duplex-serial-communication-using-p5js/
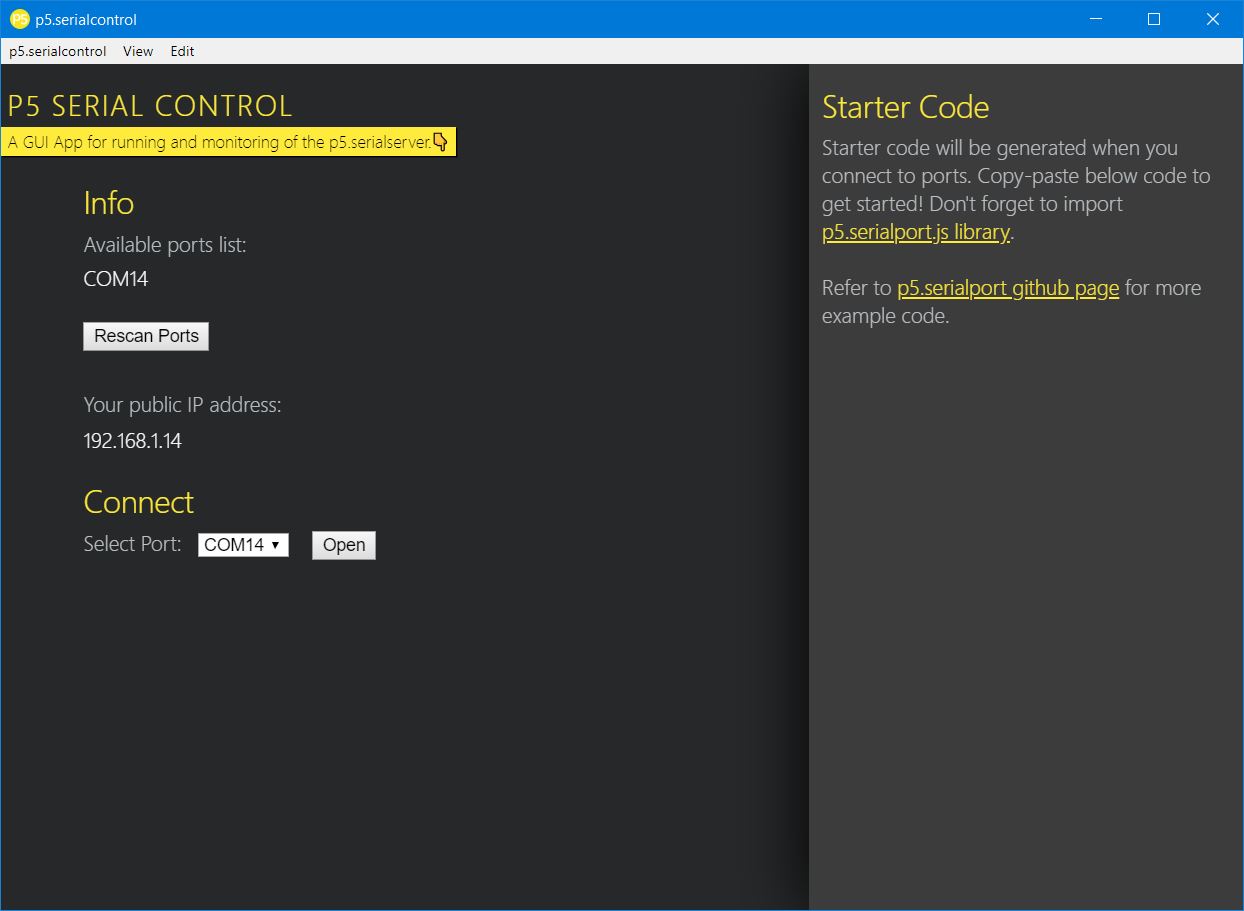
You can download P5-serial control from: https://github.com/p5-serial/p5.serialcontrol I downloaded the Windows zip file. It’s been 3 years since this program was updated, so I’m not sure how well it’s going to work.
I unzipped the p5-serialcontrol to it’s own folder and opened up “p5.serialcontrol.exe.” I had to provide access, so I clicked “Allow Access” in Windows.
I had a board plugged in, and re-scanned it, and it showed that the board was connected to COM14. I left this application running. (Note, you can’t program the Arduino, or use the Serial Monitor if this program is running. You’ll need to close it down first to program the Arduino or use the Arduino Serial Monitor.)
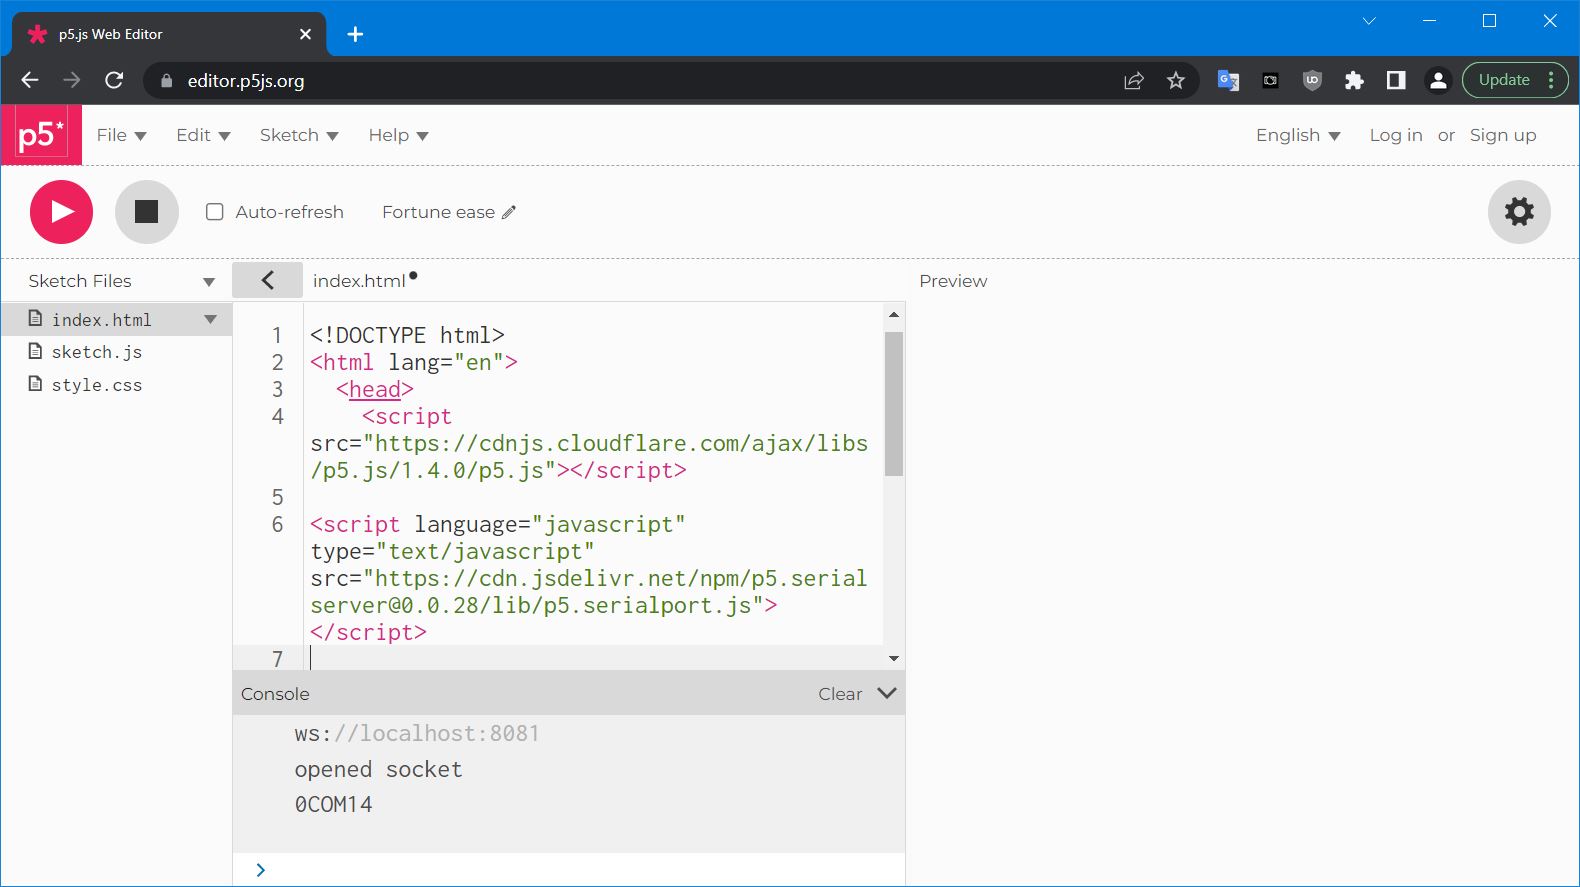
I then opened up the p5 editor and added this line to index.html
<script language="javascript" type="text/javascript" src="https://cdn.jsdelivr.net/npm/p5.serialserver@0.0.28/lib/p5.serialport.js"></script>
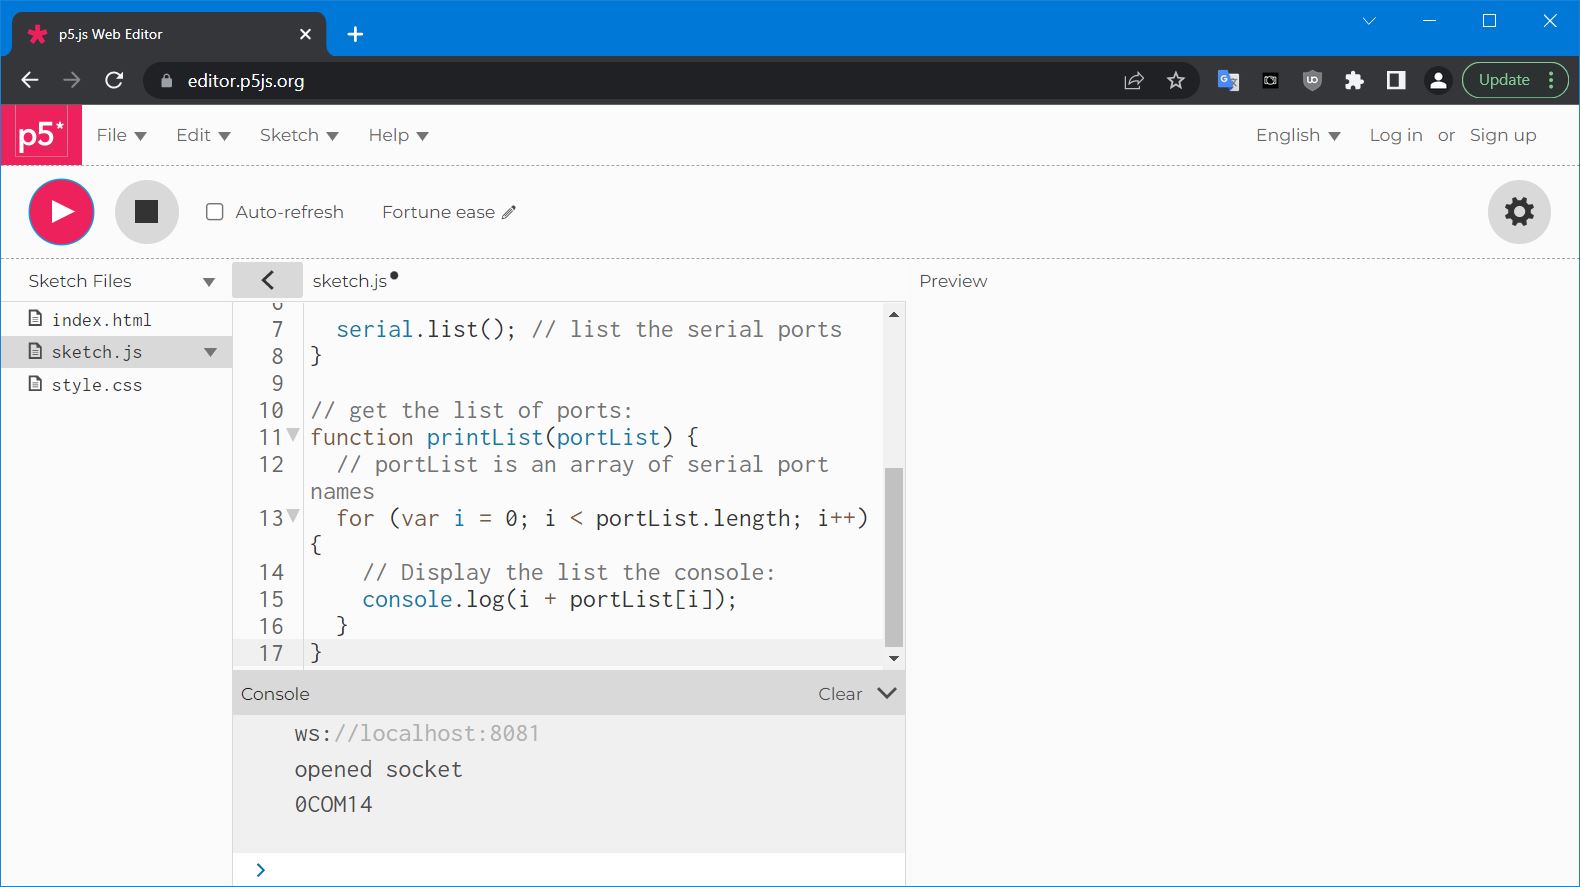
Next, I created new program that would find the connected com ports.
let serial; // variable to hold an instance of the serialport library

function setup() {
  serial = new p5.SerialPort(); // make a new instance of the serialport library
  serial.on('list', printList); // set a callback function for the serialport list event

  serial.list(); // list the serial ports
}

// get the list of ports:
function printList(portList) {
  // portList is an array of serial port names
  for (var i = 0; i < portList.length; i++) {
    // Display the list the console:
    console.log(i + portList[i]);
  }
}
And I clicked the “Play” button at the top to run it.
And it saw the port, COM14 was connected.
If any of this is confusing, please refer to the original link I got this information from: https://itp.nyu.edu/physcomp/labs/labs-serial-communication/lab-serial-input-to-the-p5-js-ide/
Now I know I can at least read that COM ports exist, so I was confident I could get data to p5.js.
Putting data from my board into the p5 editor
Next I needed to get data out from my samd11 board with whate sensor onto the p5 editor so I could visualize the data.
Prepare the sensor and board
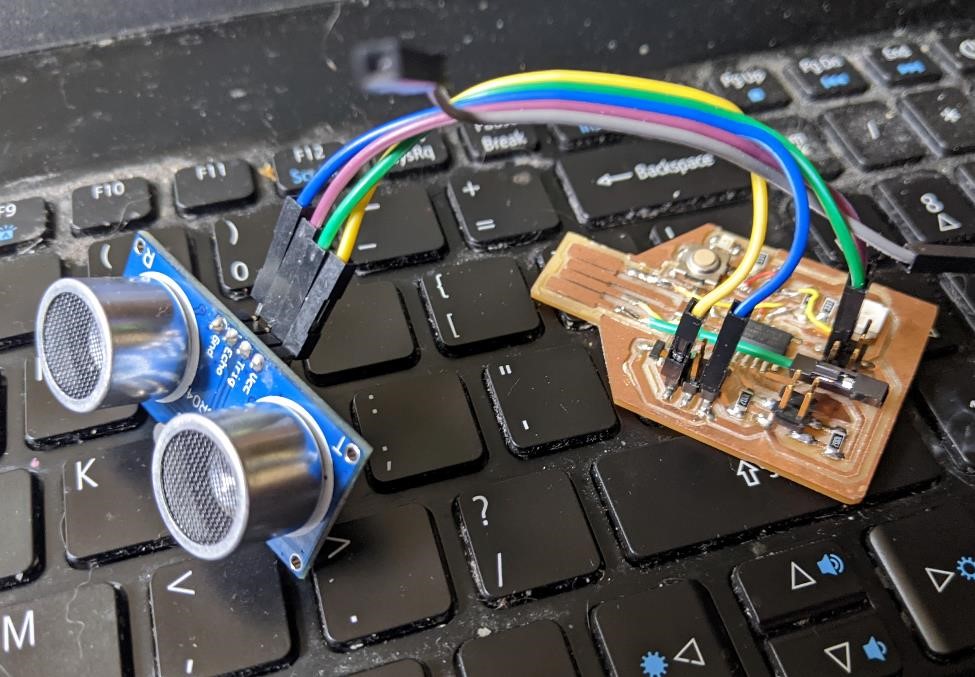
Very quickly plugged up an HC-SR04 ultrasonic sensor to a SAMD11 board and got it working by copying and pasting code with usual minor modifications (switch pin numbers, switch Serial out for SerialUSB.) And it worked well. It’s nice when things actually take no time to do and they work the first time.
Pinout was PA30 (phys pin 7) for trigger, and PA31 (phys pin 8) for Echo. 3.3v and GND of course.
View Week 15 worklog for the modified code, which was based off of code from this website: https://randomnerdtutorials.com/complete-guide-for-ultrasonic-sensor-hc-sr04/
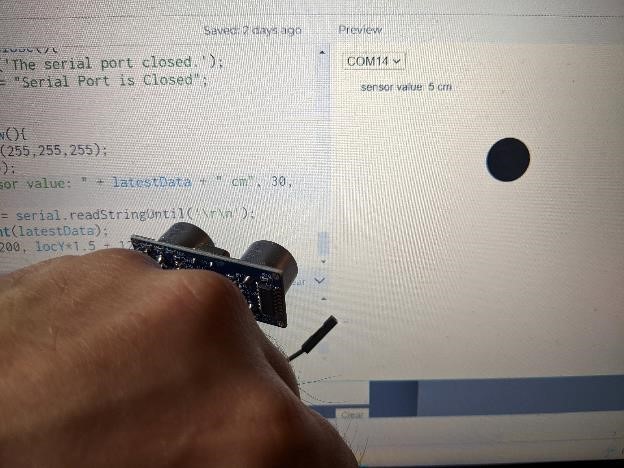
And I followed the tutorial above, and used the example p5 serial data example (https://editor.p5js.org/YitingLiu97/sketches/itPArHl0B) and modified it a bit for my HCSR04 ultrasonic sensor.
I received good data from the Serial Monitor about the distance from the sensor to my hand and nearby walls.
code to get data from sensor to p5.js
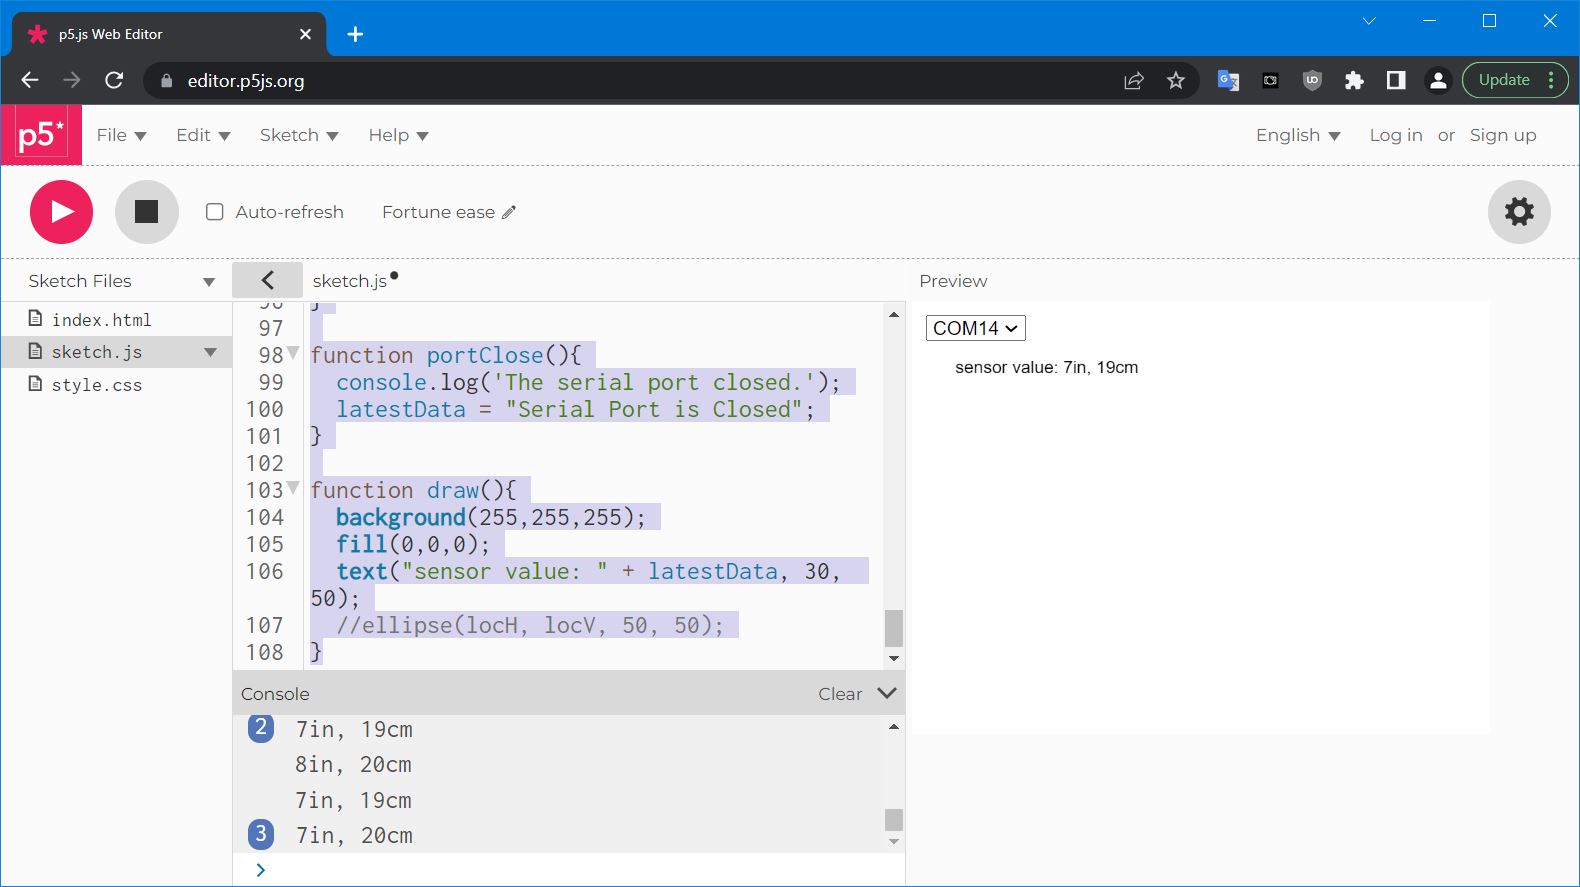
I had a couple of issues getting this to work, and I’m not quite sure what caused these problems. I believe a large part of it is that the software is not properly closing the serial port. The way I would solve this, was to use the p5-serialcontrol software and “open” and “close” the serial port. This seemed to have fixed the problem.
But this p5 code is merely accepting the data and displaying it on the website. It’s not programming the board and sensor combination. It only displays the information you give it, and that is where the code for reading and sending sensor data from the samd11 board comes in.
I had programmed my board to gather ultrasonic sensor data, and display it on the serial monitor.
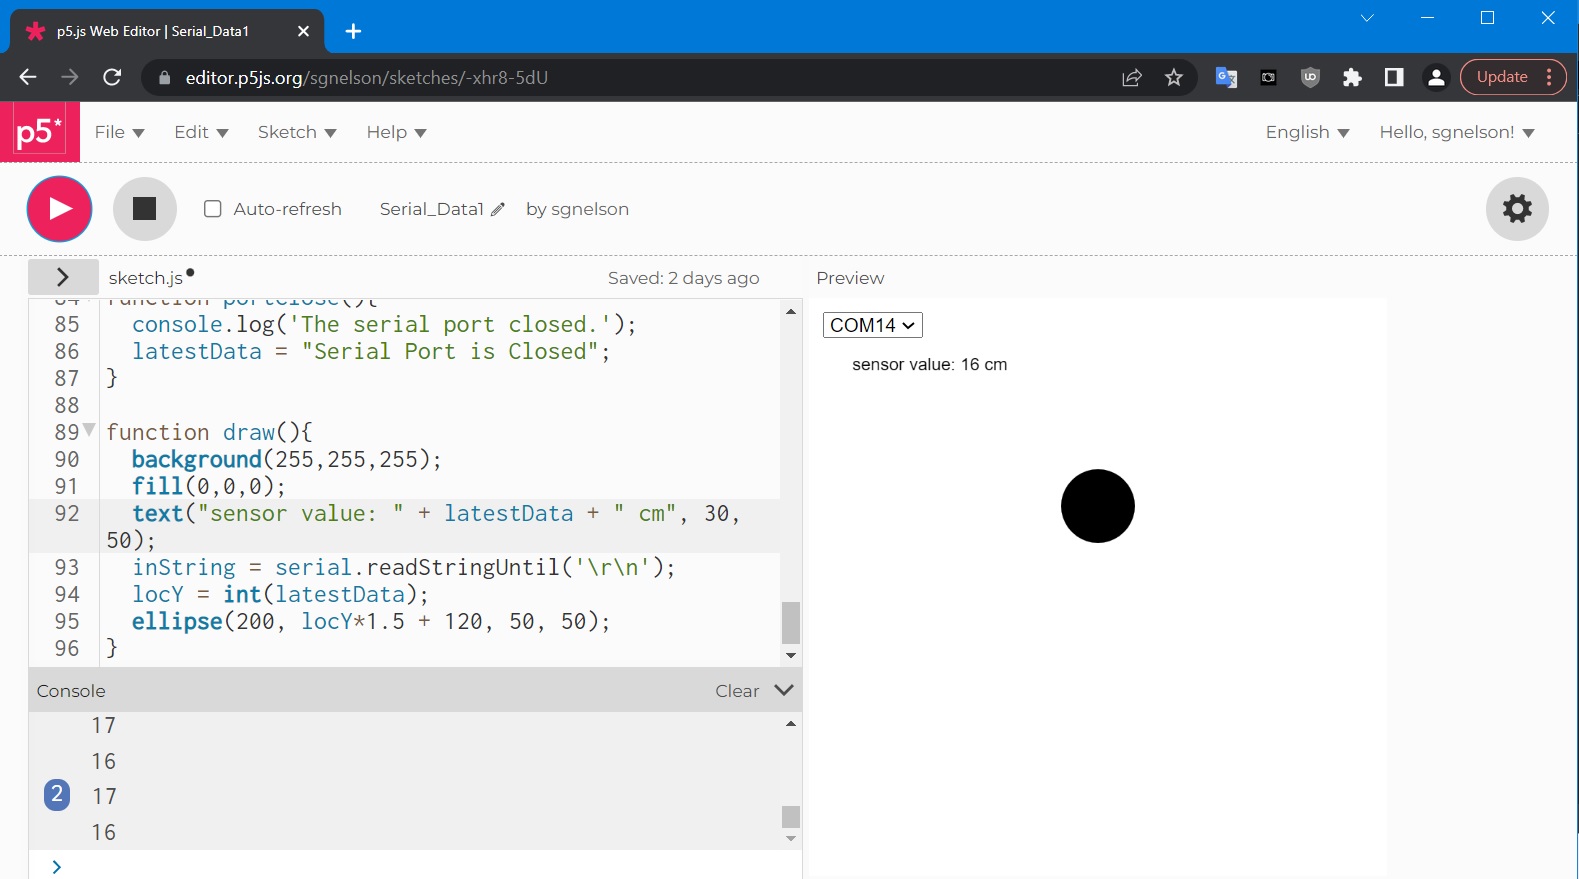
The below code prepares p5.js to accept serial data. It’s opening the serial port (and actually allows you to select which serial port to use.), handles many of the common tasks with serial ports (open, close, errors, reading data, etc.) and then displays the read data valus onto the canvas. It also makes a ball move up and down based on the distance sensed (in cm.)
In short, it’s a lot of work just to get a web browser to see data from an arduino software board and sensor.
But after some tinkering, it worked.
Note: You’ll have to change the COM port (/dev/tty* for linux, whatever for MacOSX) to what port you’re using.
let serial; // variable to hold an instance of the serialport library
let portName = 'COM14';
let inData;
let latestData = "waiting for data";  // you'll use this to write incoming data to the canvas

var portSelector; // select menu for port list
var locX = 0;
var locY = 0;


function setup() {
  createCanvas(400, 400);

  serial = new p5.SerialPort(); // make a new instance of the serialport library
  serial.on('list', printList); // set a callback function for the serialport list event
  serial.on('connected', serverConnected);
  serial.on('open', portOpen);
  //serial.on('data', serialEvent);
  serial.on('data', gotData);
  serial.on('error', serialError);
  serial.on('close', portClose);

  serial.list();
  serial.open(portName);

  serial.list(); // list the serial ports

}

// get the list of ports:
function printList(portList) {
  //make select menu
  portSelector = createSelect();
  portSelector.position(10,10);

  // portList is an array of serial port names
  for (var i = 0; i < portList.length; i++) {
    portSelector.option(portList[i]);
    // Display the list the console:
    //console.log(i + portList[i]);
  }
  portSelector.changed(mySelectEvent);
}

function mySelectEvent(){
  let item = portSelector.value();
  // if there's a port open, close it.
  if (serial.serialport != null){
    serial.close();
  }
  //open new port
  serial.open(item);
}

function serverConnected(){
  console.log('connected to server.');
}

function portOpen(){
  console.log('the serial port is open');
}

function gotData(){
  let currentString = serial.readLine();
  trim(currentString);
  if (!currentString) return;
  console.log(currentString);
  latestData = currentString;
}

//we got raw data from serial port
function gotRawData(thedata){
  print("gotRawData" + thedata);
}


function serialError(err){
  console.log('Something went wrong with the serial connection ' + err);
}

function portClose(){
  console.log('The serial port closed.');
  latestData = "Serial Port is Closed";
}

function draw(){
  background(255,255,255);
  fill(0,0,0);
  text("sensor value: " + latestData  + " cm", 30, 50);
  inString = serial.readStringUntil('\r\n');
  locY = int(latestData);
  ellipse(200, locY + 50, 50, 50);
}
Group Project
Please click here for the week 15 group project site.
I worked on the Circuit Python and P5.js aspects of this week’s group project. I made a number of code snippets and explored what each language was capable of in the given time frame.
I also helped with looking into the various versions of Processing.
I was able to get Circuit Python working on a SAMD21e18 board. See here: https://fabacademy.org/2022/labs/cpcc/students/garrett-nelson/about/worklog_wk16/#circuit-python-and-samd21-board
I learned quite a bit about how to get Circuit Python compiled and working on a microcontroller board.
References and resources
As always, they’re listed above and throughout this page
Files
As always, the code snippets used in this project are listed above and throughout this page.