Group Assignment Requirements
- Use test equipment in the lab to observe the operation of a microcontroller circuit board.
- Demonstrate the use of a logic analyzer.
- Analyze electrical signals generated by the microcontroller.
- Document the results on the group work page.
- Reflect individually on the observed behavior and measurements.
Learning Outcomes
- Understand how to measure electrical signals using lab equipment.
- Interpret voltage, current, and resistance in real circuits.
- Analyze PWM signals and duty cycle variations.
- Understand communication protocols such as I2C.
- Use a logic analyzer to decode digital signals.
Progress Status
Summary of completed tasks for Week 06 – Electronics Design (Group Assignment).
Measured voltage variation and analyzed electrical behavior (V, I, R).
Observed duty cycle variation in RGB LED using logic analyzer.
Captured and decoded communication between ESP32 and OLED display.
Introduction & Experimental Setup
This group assignment focuses on the use of laboratory test equipment to analyze the behavior of a microcontroller-based system. The objective is to observe, measure, and interpret electrical and digital signals using tools such as a multimeter and a logic analyzer.
For this experiment, a Seeed Studio XIAO ESP32-C3 was used as the main microcontroller. The system includes an RGB LED controlled באמצעות PWM signals, a potentiometer to vary the signal, and an OLED display (SSD1306) to visualize the output values in real time.
Logic Analyzer (LA104)
The LA104 logic analyzer was used to capture and visualize digital signals generated by the microcontroller. This tool allows detailed inspection of timing, pulse width modulation (PWM), and communication protocols such as I2C, making it essential for debugging and signal analysis in embedded systems.
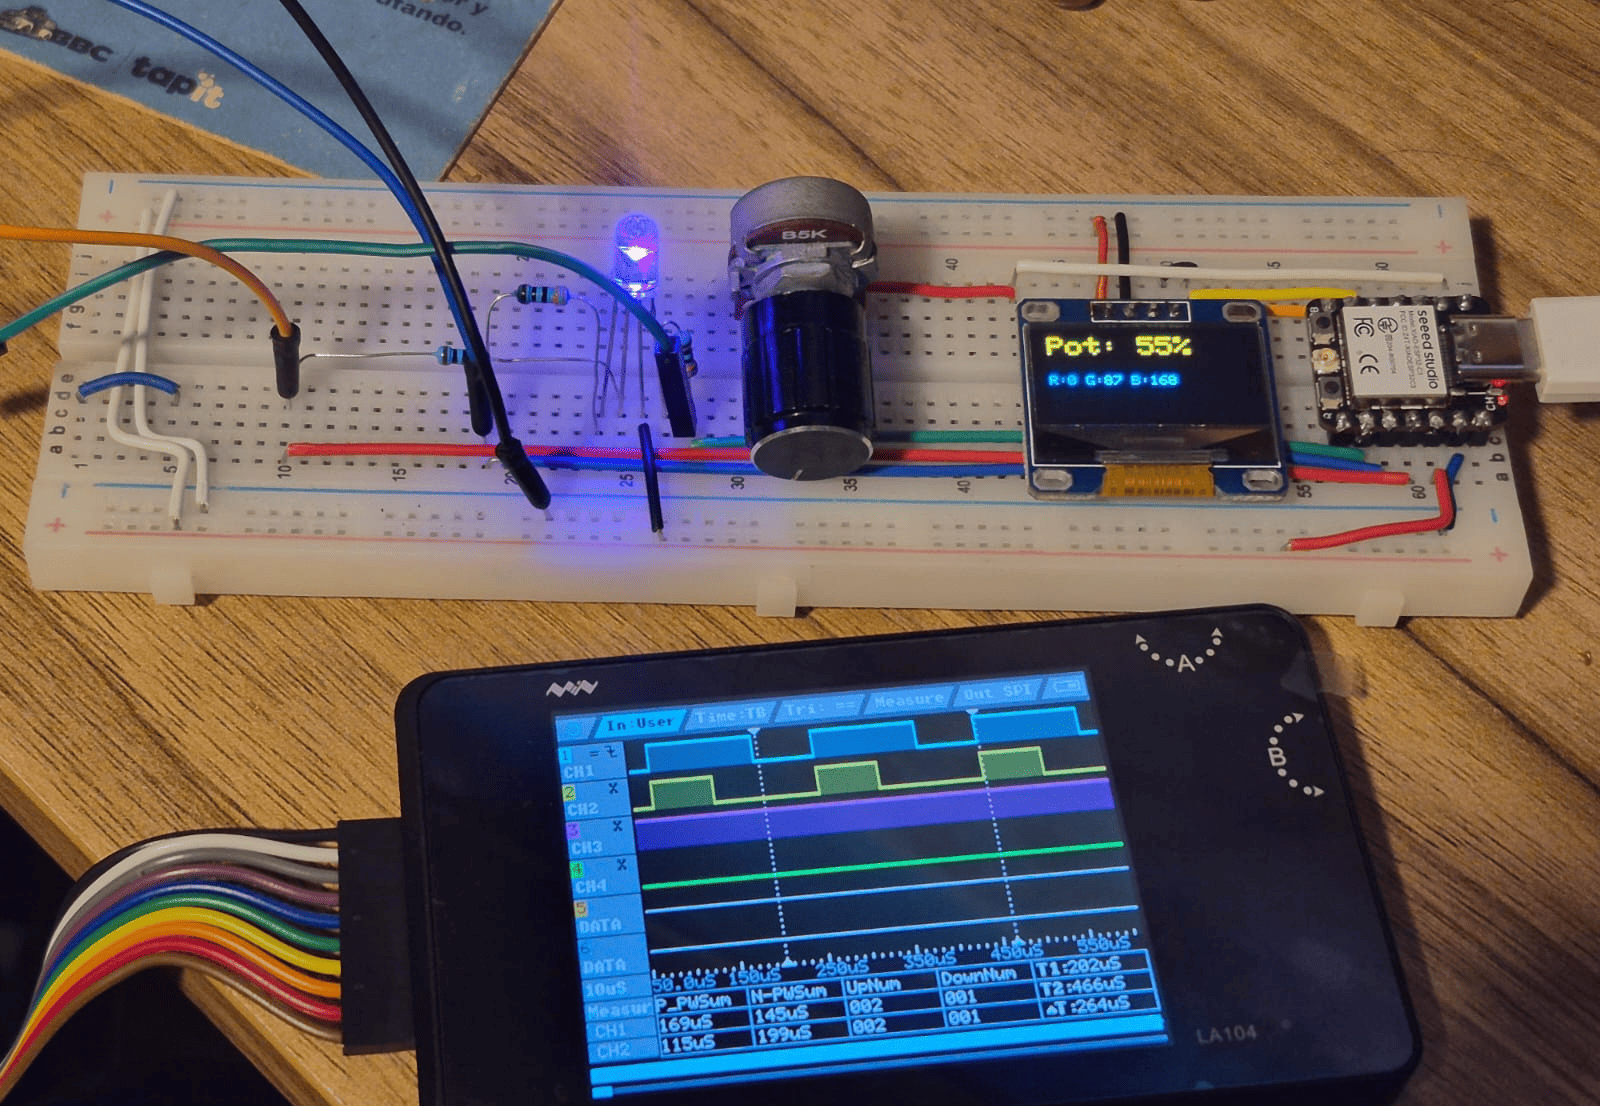
Circuit Setup
The experimental setup consists of a XIAO ESP32-C3 connected to an RGB LED, a potentiometer, and an OLED display. The potentiometer controls the PWM signal applied to the LED, allowing variation in color intensity.
The RGB LED used in this setup is a common anode configuration, which requires inverted logic for PWM control. The OLED display communicates with the microcontroller through the I2C protocol, enabling real-time visualization of signal values.
This configuration allows the simultaneous observation of analog input behavior, digital signal modulation, and communication protocols within a single system.
Multimeter Analysis (Voltage Measurement)
The first test focused on analyzing the electrical behavior of the circuit using a multimeter. This allowed direct observation of voltage variation as the potentiometer changes the input signal to the microcontroller.
A multimeter is a fundamental tool in electronics used to measure three main electrical variables:
- Voltage (V): Electrical potential difference between two points
- Current (I): Flow of electric charge through a conductor
- Resistance (R): Opposition to current flow in a material
AC vs DC Measurement
The measurements performed in this experiment correspond to DC (Direct Current), since the system is powered by a stable voltage source. In contrast, AC (Alternating Current) varies periodically over time and is typically found in power grid applications.
Even though PWM signals are digital, the multimeter reads an average voltage value, which changes depending on the duty cycle applied to the signal.
Measurement Demonstration
As shown in the video, the measured voltage varies as the potentiometer is adjusted, demonstrating how analog input influences the PWM output and the resulting electrical behavior.
PWM Signal Analysis (Logic Analyzer)
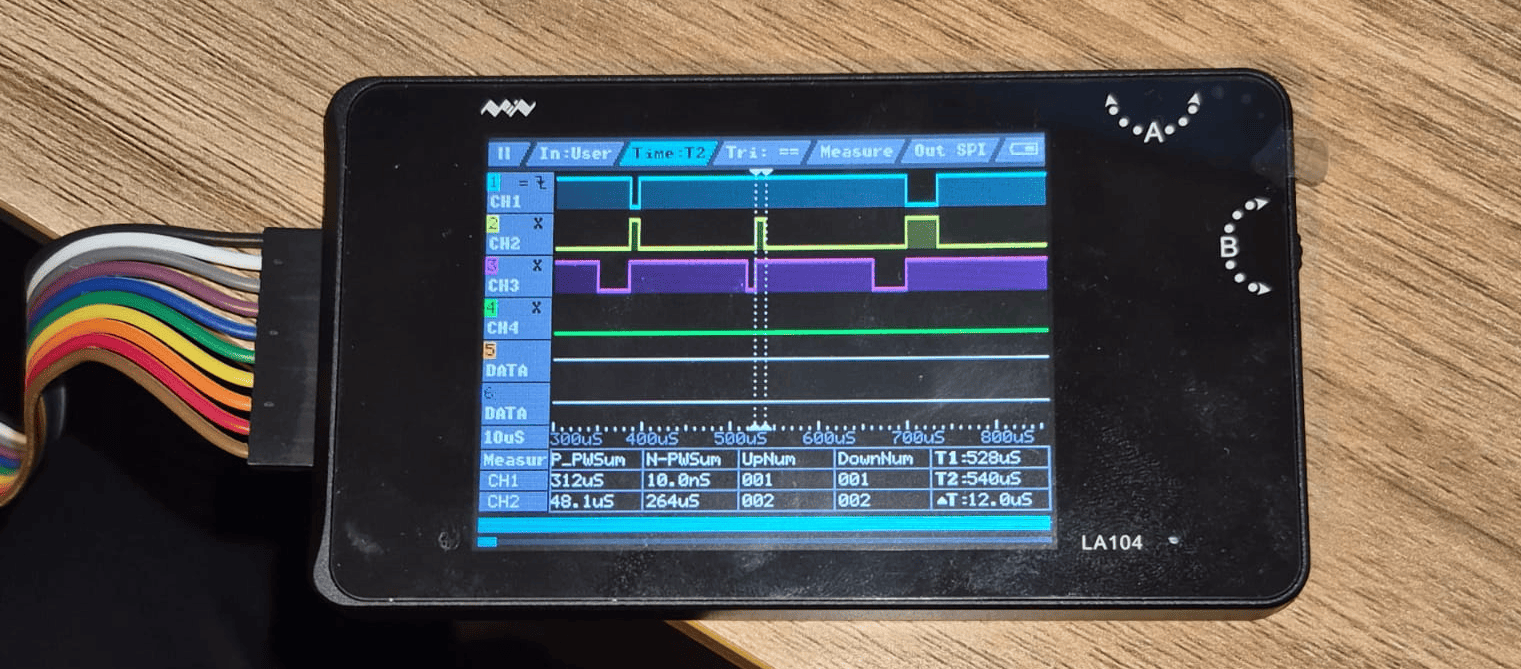
The second test focused on analyzing the PWM (Pulse Width Modulation) signals generated by the XIAO ESP32-C3 to control the RGB LED. Using the logic analyzer, it was possible to visualize how the duty cycle changes in real time as the potentiometer is adjusted.
PWM is a technique used to simulate analog output using digital signals. It works by switching a signal between HIGH and LOW states at a fixed frequency, while varying the proportion of time the signal stays HIGH (duty cycle).
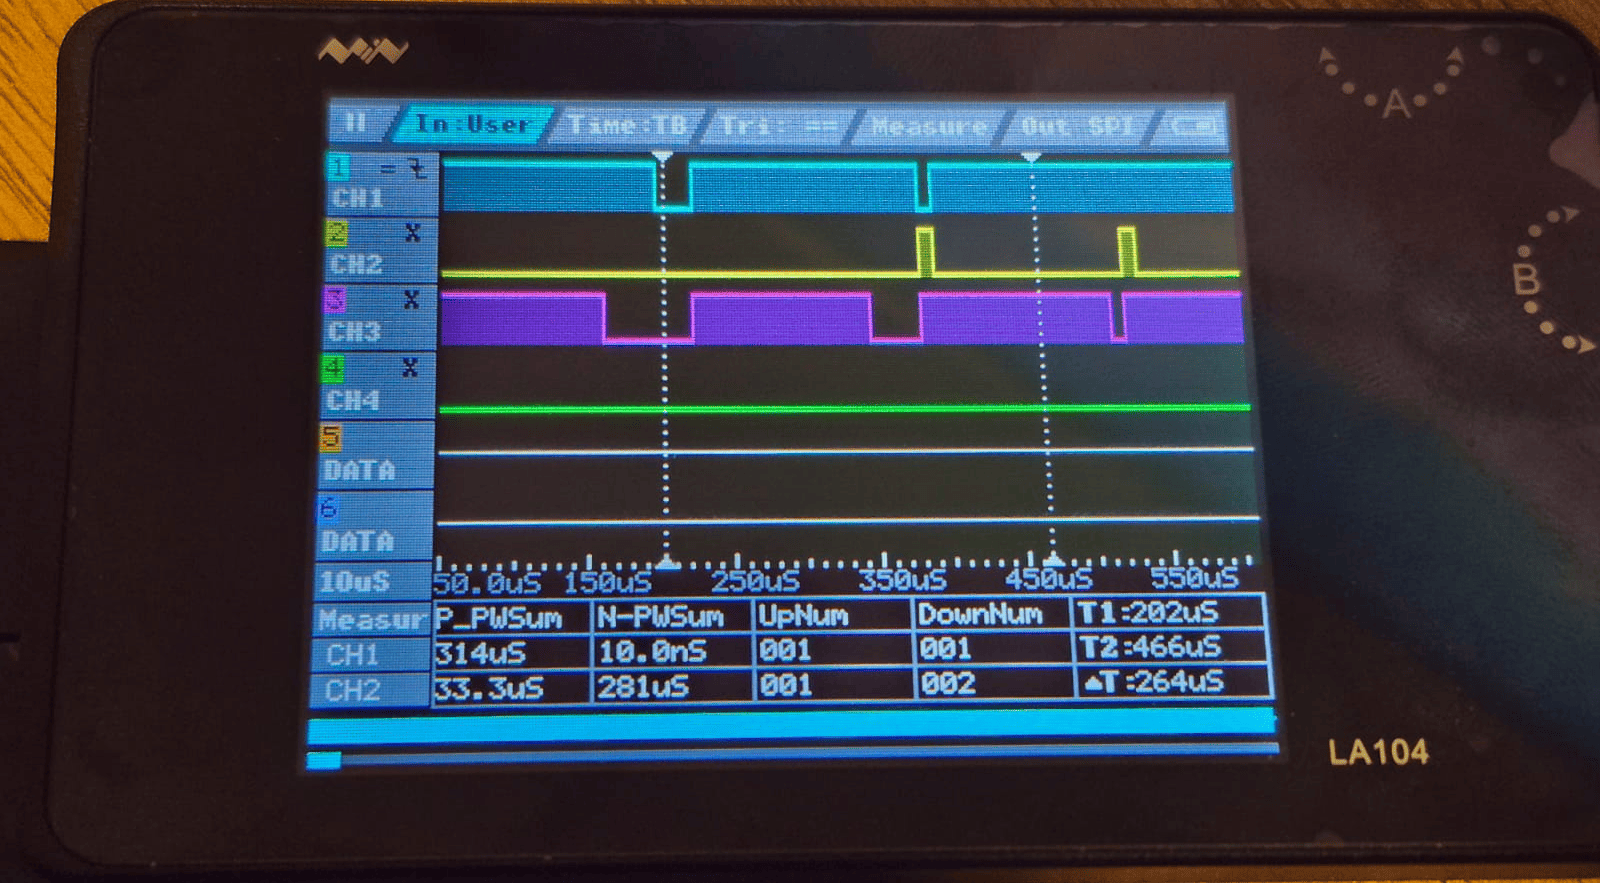
Signal Measurement Using Cursors
The logic analyzer allows precise measurement of signal parameters using cursors. These were used to determine both the signal period and the pulse width, which are essential to calculate the duty cycle.
Period Measurement
Using the cursors, the time between two consecutive rising edges was measured, corresponding to the signal period. This defines the operating frequency of the PWM signal.
The period remains constant while the duty cycle changes, confirming that the PWM frequency is stable.
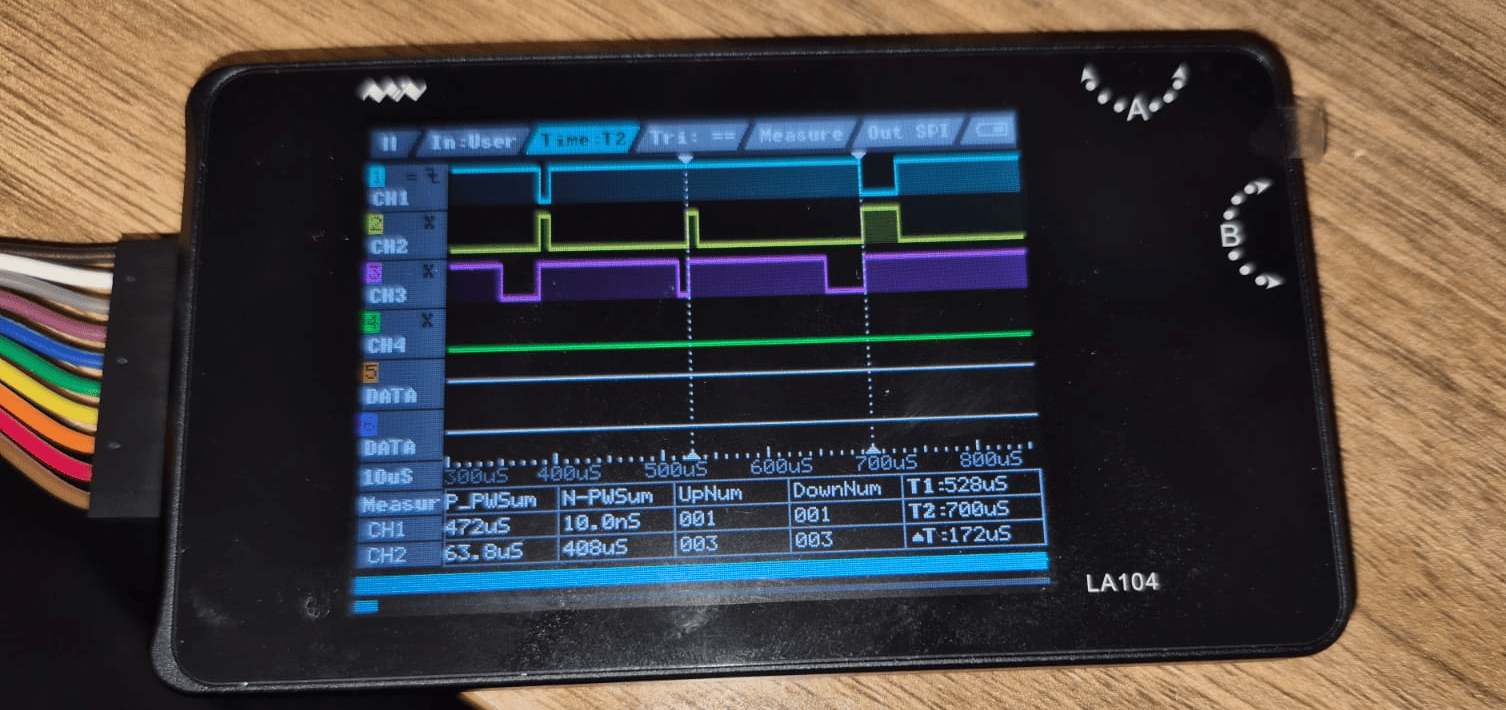
Pulse Width Measurement
The pulse width (HIGH time) was measured using the cursors to determine how long the signal remains active during each cycle.
By comparing the pulse width to the total period, the duty cycle can be calculated, which directly controls the brightness of the LED.
Common Anode Behavior
The RGB LED used in this experiment is a common anode configuration, which means that the control logic is inverted. A LOW signal turns the LED ON, while a HIGH signal turns it OFF.
This inversion can be observed in the PWM signal, where the relationship between duty cycle and brightness is reversed compared to a common cathode configuration.
I2C Communication Analysis
The third test focused on analyzing the communication between the XIAO ESP32-C3 and the OLED display (SSD1306) using the I2C protocol. With the help of the logic analyzer, it was possible to capture and decode the data transmitted between both devices.
I2C Protocol Overview
I2C (Inter-Integrated Circuit) is a communication protocol that uses two main lines:
- SCL (Serial Clock): Synchronizes data transmission
- SDA (Serial Data): Transfers data between devices
The microcontroller acts as the master device, while the OLED display operates as a slave. Communication occurs through a sequence of start conditions, address transmission, data exchange, and stop conditions.
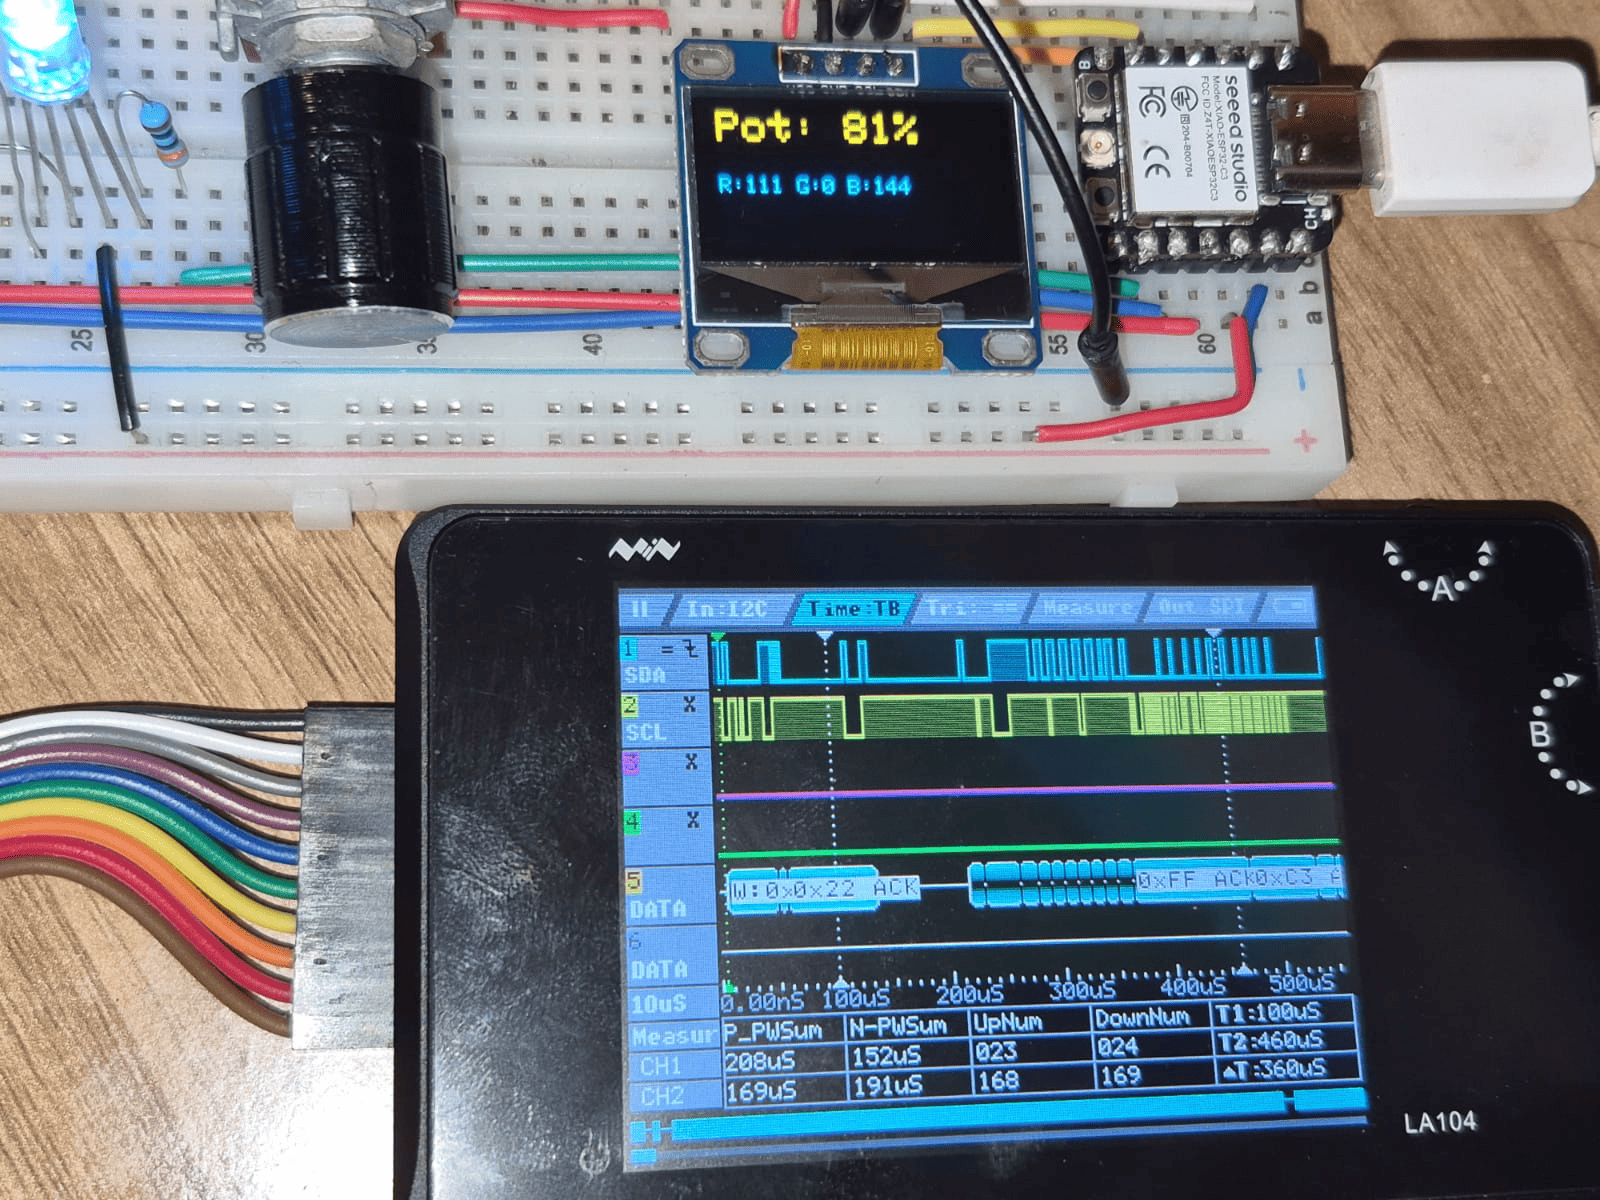
Signal Capture and Decoding
The logic analyzer was connected to both SCL and SDA lines to capture the communication signals. The analyzer software was then used to decode the data into readable messages.
This allowed identification of the transmitted bytes, confirming correct communication between the ESP32 and the OLED display.
Observed Behavior
The captured signals show the synchronization between clock and data lines, as well as the structure of the communication frames. Each transmission includes:
- Start condition
- Device address
- Data bytes
- Acknowledgment bits (ACK)
- Stop condition
This test demonstrates how digital communication protocols operate at the signal level and highlights the importance of tools like logic analyzers for debugging and validating embedded systems.
5) Group Reflection
This group assignment allowed us to explore the use of laboratory equipment to analyze the behavior of embedded systems from both electrical and digital perspectives. Working collaboratively enabled us to compare observations and validate results across different tests.
The use of the logic analyzer was particularly valuable, as it provided insight into signal timing, PWM behavior, and communication protocols such as I2C. Additionally, combining tools like the multimeter and logic analyzer helped us understand the relationship between analog measurements and digital signals.
As a team, we were able to identify how different components interact within the system, from user input (potentiometer) to signal processing (PWM) and device communication (OLED display).
Overall, this assignment reinforced the importance of measurement tools in embedded systems development and demonstrated how collaborative work improves understanding and problem-solving.