Group Assignment
- Probe an input device's analog levels and digital signals.
- Demonstrate the use of a multimeter and an oscilloscope.
- Document the work on the group assignment page.
- Reflect on the learning experience on the individual page.
Learning Outcomes
- Understand the operation of common laboratory measurement instruments.
- Measure and interpret analog and digital electrical signals.
- Demonstrate workflows used in sensing and signal analysis with electronic devices.
Laboratory Measurement Equipment
Understanding electronic signals begins with becoming familiar with the laboratory instruments used to generate, measure, and analyze them. During this group assignment, four essential pieces of equipment were used to study both DC and AC electrical signals before connecting them to embedded systems.
Each instrument serves a different purpose within the measurement workflow. The DC power supply provides a stable voltage source, the digital multimeter measures electrical quantities such as voltage, current, and resistance, the function generator creates controlled test signals, and the oscilloscope allows those signals to be visualized and analyzed in real time.
Together, these instruments form the foundation of electronic debugging and validation, enabling engineers to verify circuit behavior before integrating sensors and microcontrollers into a project.
| Equipment | Main Function |
|---|---|
| DC Power Supply | Provides adjustable DC voltage. |
| Digital Multimeter | Measures voltage, current, resistance and continuity. |
| Function Generator | Generates electrical waveforms for testing. |
| Oscilloscope | Visualizes electrical signals over time. |
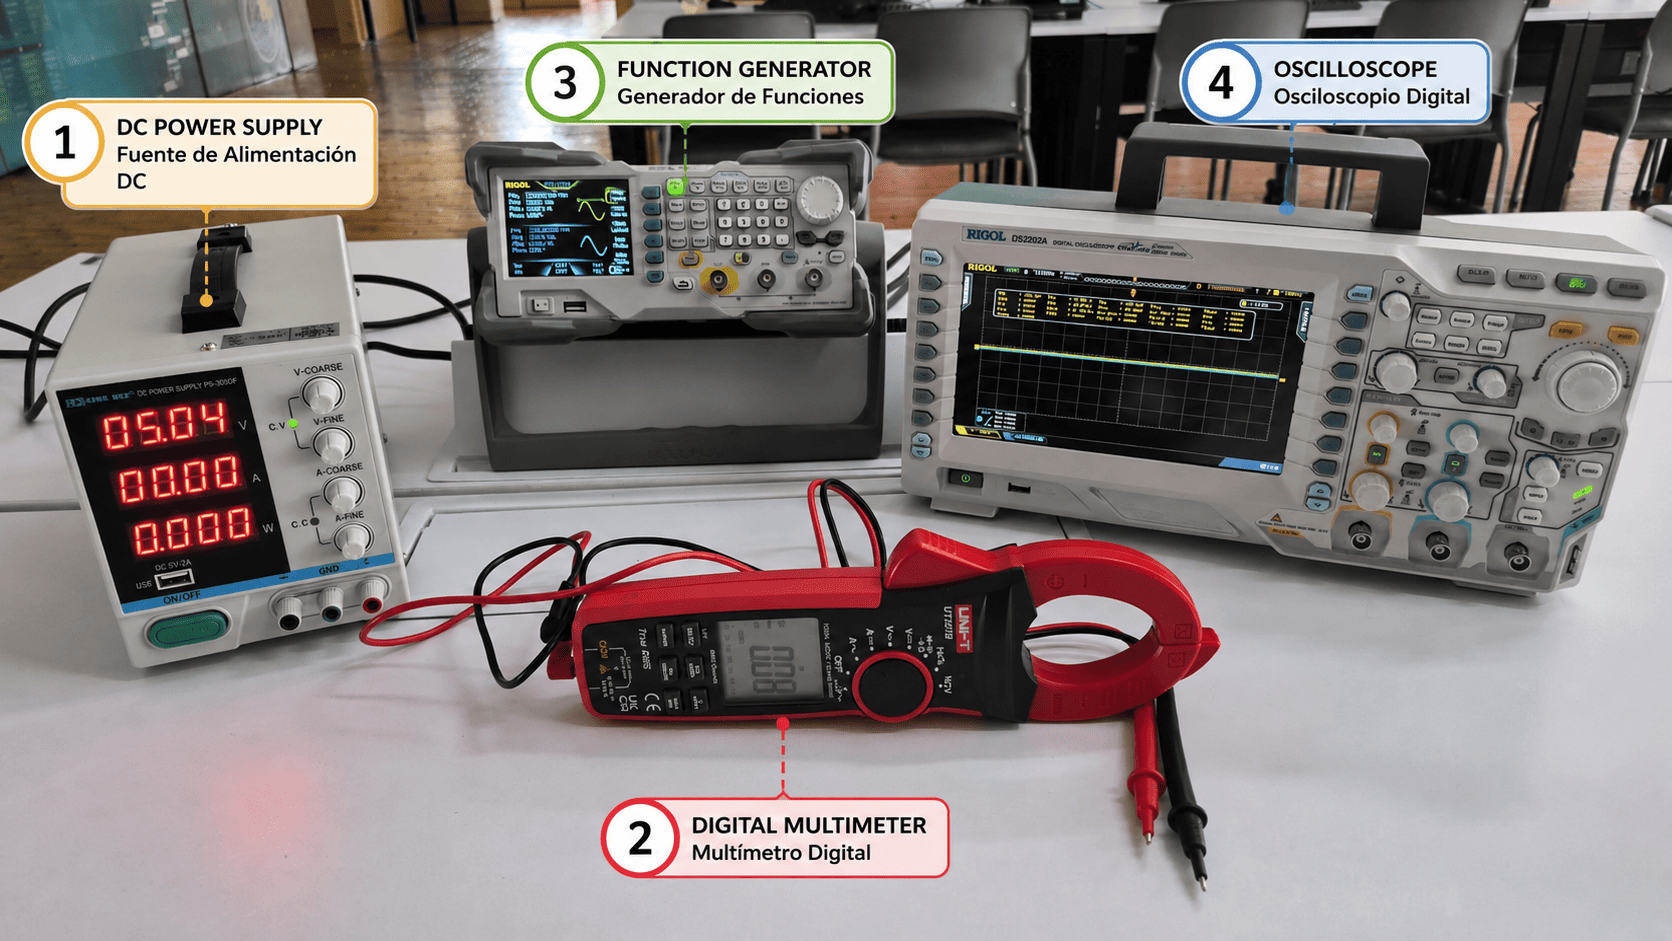
Laboratory setup including the DC power supply, digital multimeter, function generator, and oscilloscope used throughout this assignment.
DC and AC Voltage Measurements
The first practical measurement exercise focused on understanding how to measure voltage using a digital multimeter. We tested both DC voltage from a regulated power supply and AC voltage from the electrical grid, paying attention to the correct multimeter mode and connection method for each case.
DC Voltage Measurement
For the DC test, the regulated power supply was connected to the digital multimeter in parallel. This configuration allows the multimeter to measure the voltage difference between the positive and negative terminals without interrupting the circuit.
The power supply voltage was gradually adjusted while comparing the value displayed by the source with the value measured by the multimeter. This helped verify that both instruments were consistent and that the multimeter was correctly configured in DC voltage mode.
Key idea: measuring voltage in parallel
Voltage is measured across two points, so the multimeter must be connected in parallel. This is different from current measurement, where the meter must be placed in series.
DC voltage measurement using a regulated power supply and a digital multimeter connected in parallel.
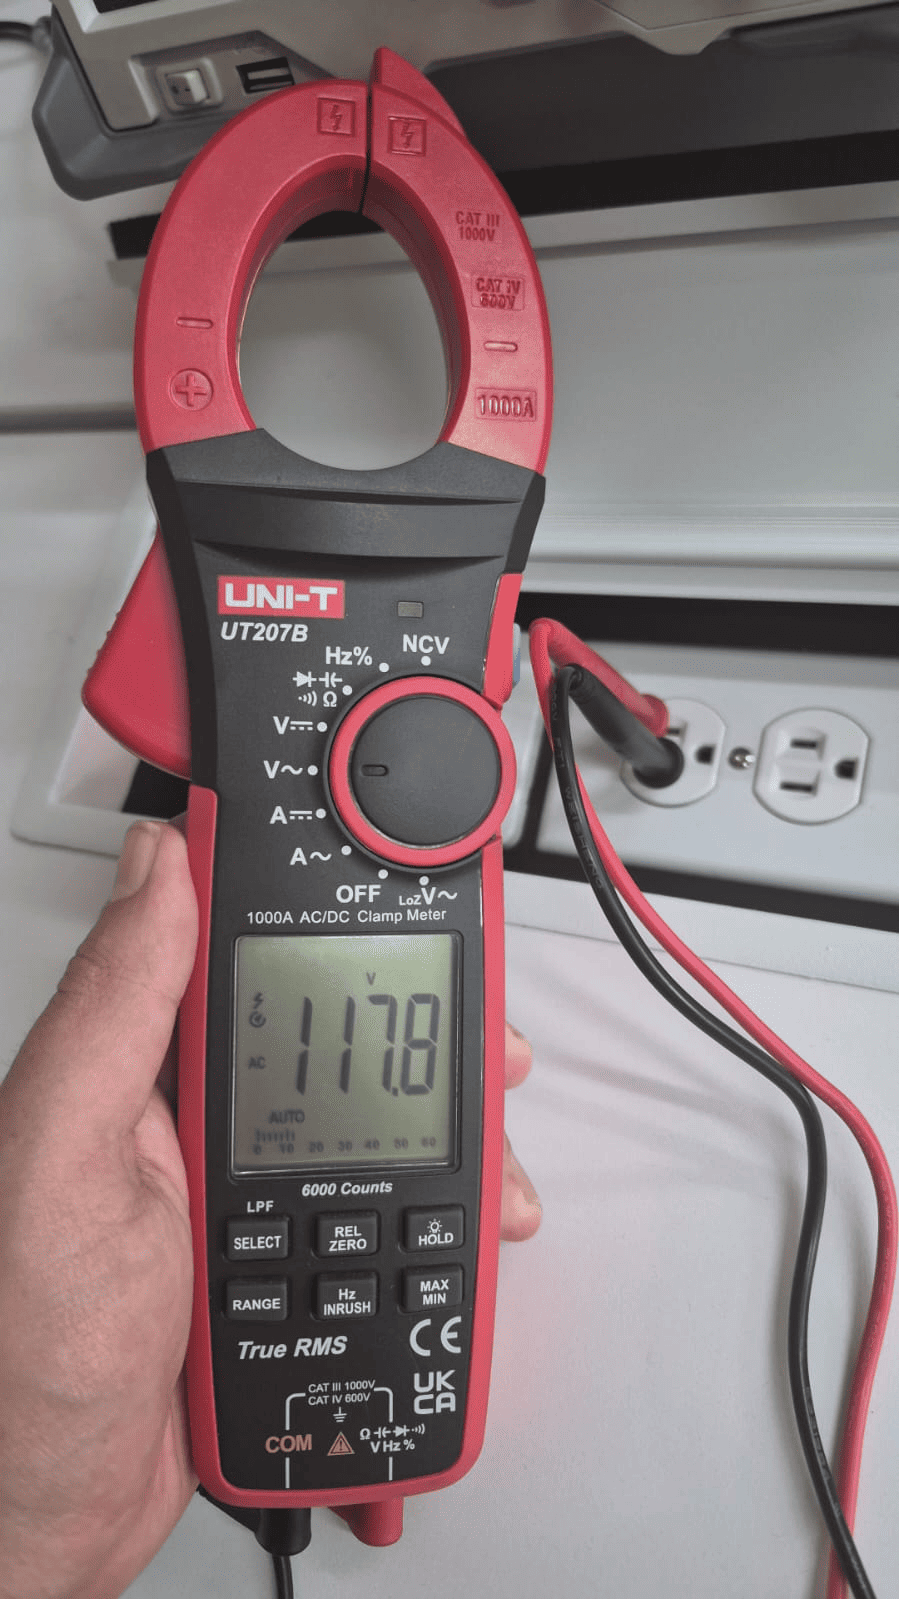
AC voltage measurement from the electrical grid using the multimeter in AC voltage mode.
AC Voltage Measurement
After measuring DC voltage, the multimeter was changed to AC voltage mode to measure the electrical grid. This step is important because AC signals change polarity periodically, while DC signals remain constant over time.
When measuring AC voltage with a multimeter, the displayed value usually corresponds to the RMS voltage, which represents the effective value of the alternating signal. This is different from the peak voltage that can be observed with an oscilloscope.
DC vs AC measurement
- DC: constant polarity and stable voltage level.
- AC: voltage changes polarity periodically over time.
- RMS: effective value commonly shown by multimeters in AC mode.
In theory, the nominal residential supply voltage is approximately 120 VRMS. However, the measured value during the experiment was approximately 117.8 VRMS.
This difference is completely normal, as the voltage delivered by the electrical grid is not perfectly constant. Small variations may occur due to voltage regulation, distribution losses, the distance from the distribution transformer, and the instantaneous electrical demand of the network. For this reason, the measured value is typically close to, but not exactly equal to, the nominal voltage.
Observation
Nominal voltage: 120 VRMS
Measured voltage: 117.8 VRMS
Difference: −2.2 V (approximately 1.8%), which is well within
the normal operating range of a residential AC power distribution system.
Signal Analysis using the Oscilloscope
Unlike a digital multimeter, which provides a numerical measurement, an oscilloscope allows electrical signals to be visualized as they change over time. Combined with a function generator, it becomes an essential tool for studying analog and digital signals, verifying circuit behavior, and debugging electronic systems.
Oscilloscope vs Function Generator
Although these instruments are commonly used together, they perform completely different functions within an electronic laboratory.
| Oscilloscope | Function Generator |
|---|---|
| Measures electrical signals | Generates electrical signals |
| Input device | Output device |
| Displays voltage over time | Produces test waveforms |
| Used for debugging | Used for testing circuits |
| Receives signals | Sends signals |
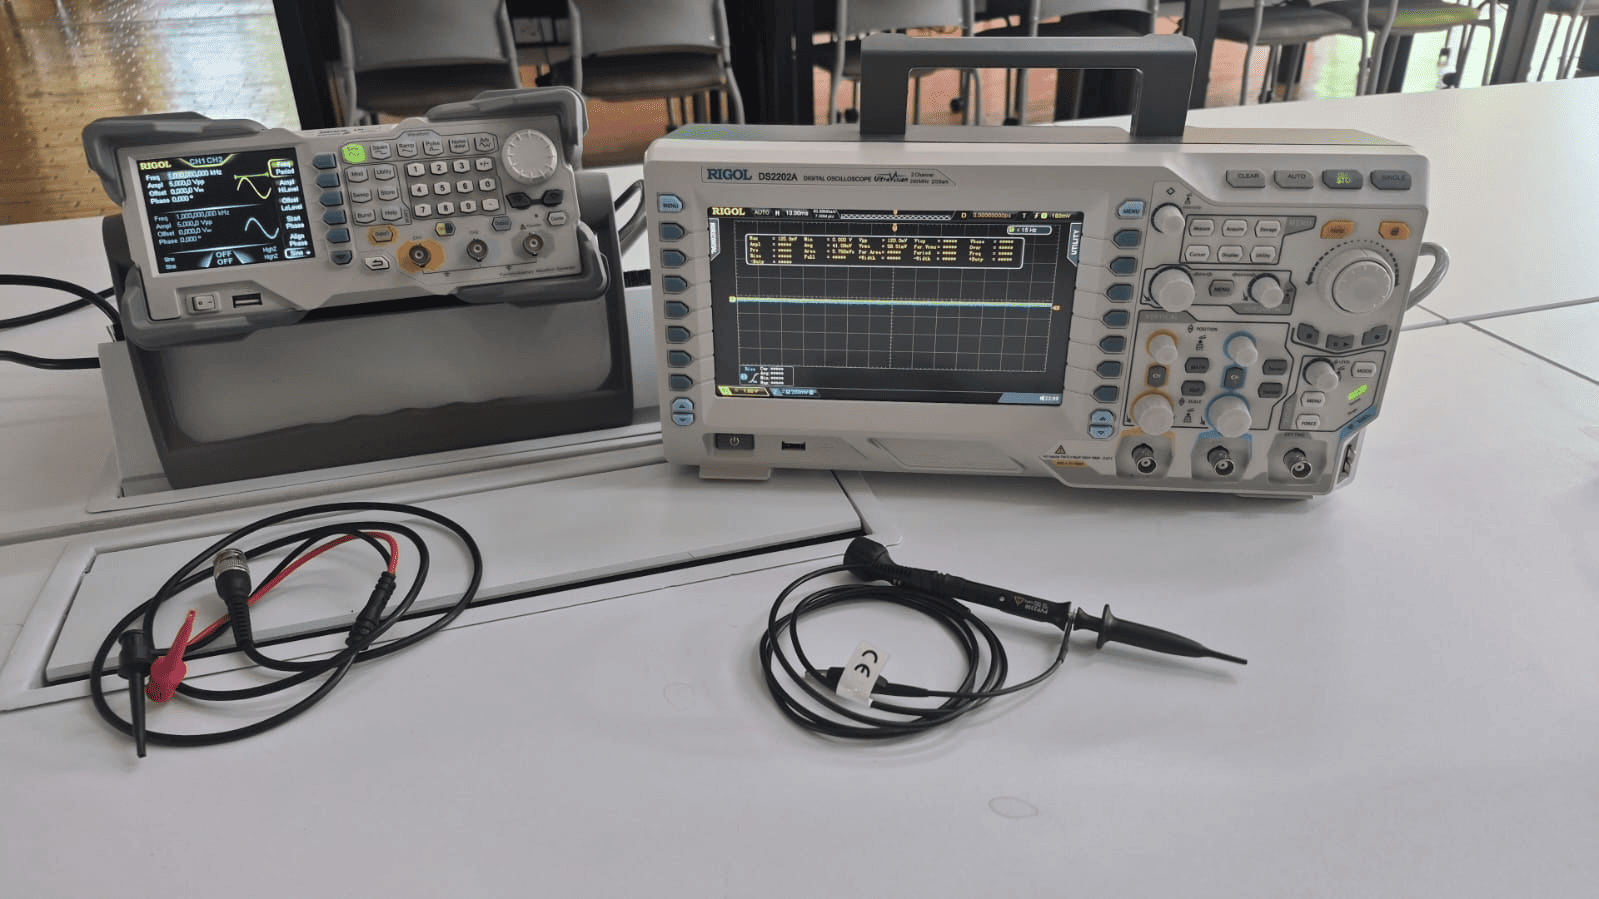
The function generator produces the electrical waveform while the oscilloscope captures and displays it in real time.
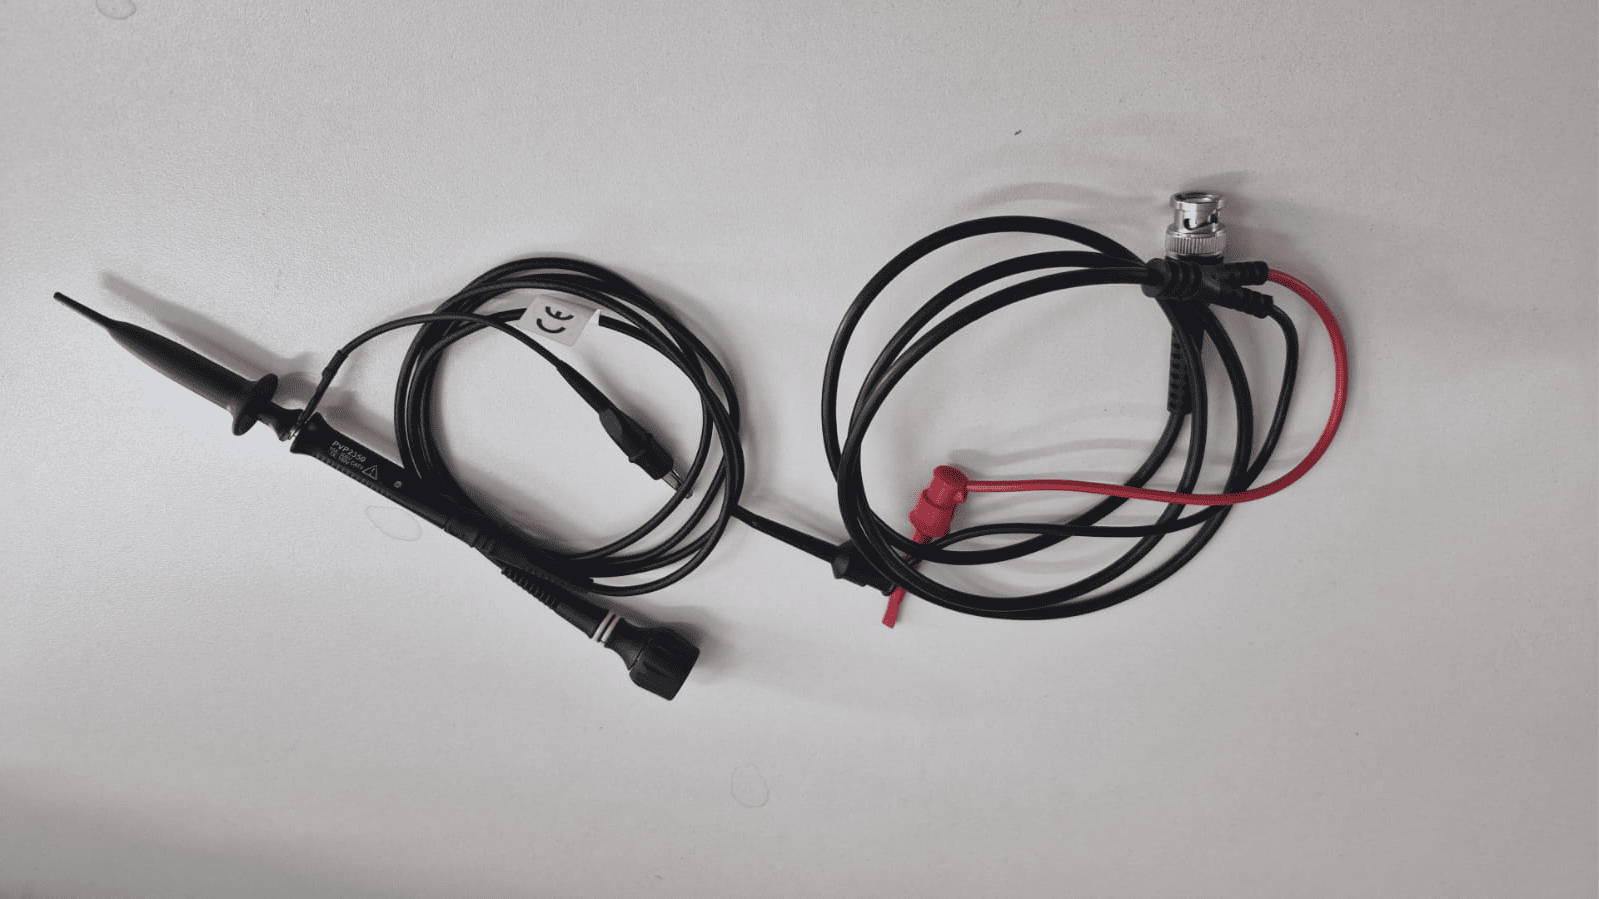
Oscilloscope probe and BNC cable used during the measurements.
Connecting the Instruments
Although both cables carry electrical signals, they are designed for different purposes. The oscilloscope probe is optimized for signal measurement and includes an attenuation network that minimizes the effect of the instrument on the circuit being tested. In contrast, the BNC cable from the function generator simply delivers the generated waveform to the circuit.
| Oscilloscope Probe | Generator Cable |
|---|---|
| Measures signals | Transmits signals |
| High impedance input | 50 Ω output |
| Includes ground clip | BNC connector |
| Usually selectable (1X / 10X) | Fixed connection |
Oscilloscope Initial Configuration
Before measuring external signals, the oscilloscope was calibrated using its built-in square-wave reference output. Connecting the probe to the calibration terminal allows the user to verify that the probe compensation is correct and that the instrument is configured properly.
After connecting the probe, the AUTO button was pressed. The oscilloscope automatically adjusted the vertical scale, time base, and trigger settings, displaying a stable waveform without requiring manual configuration.
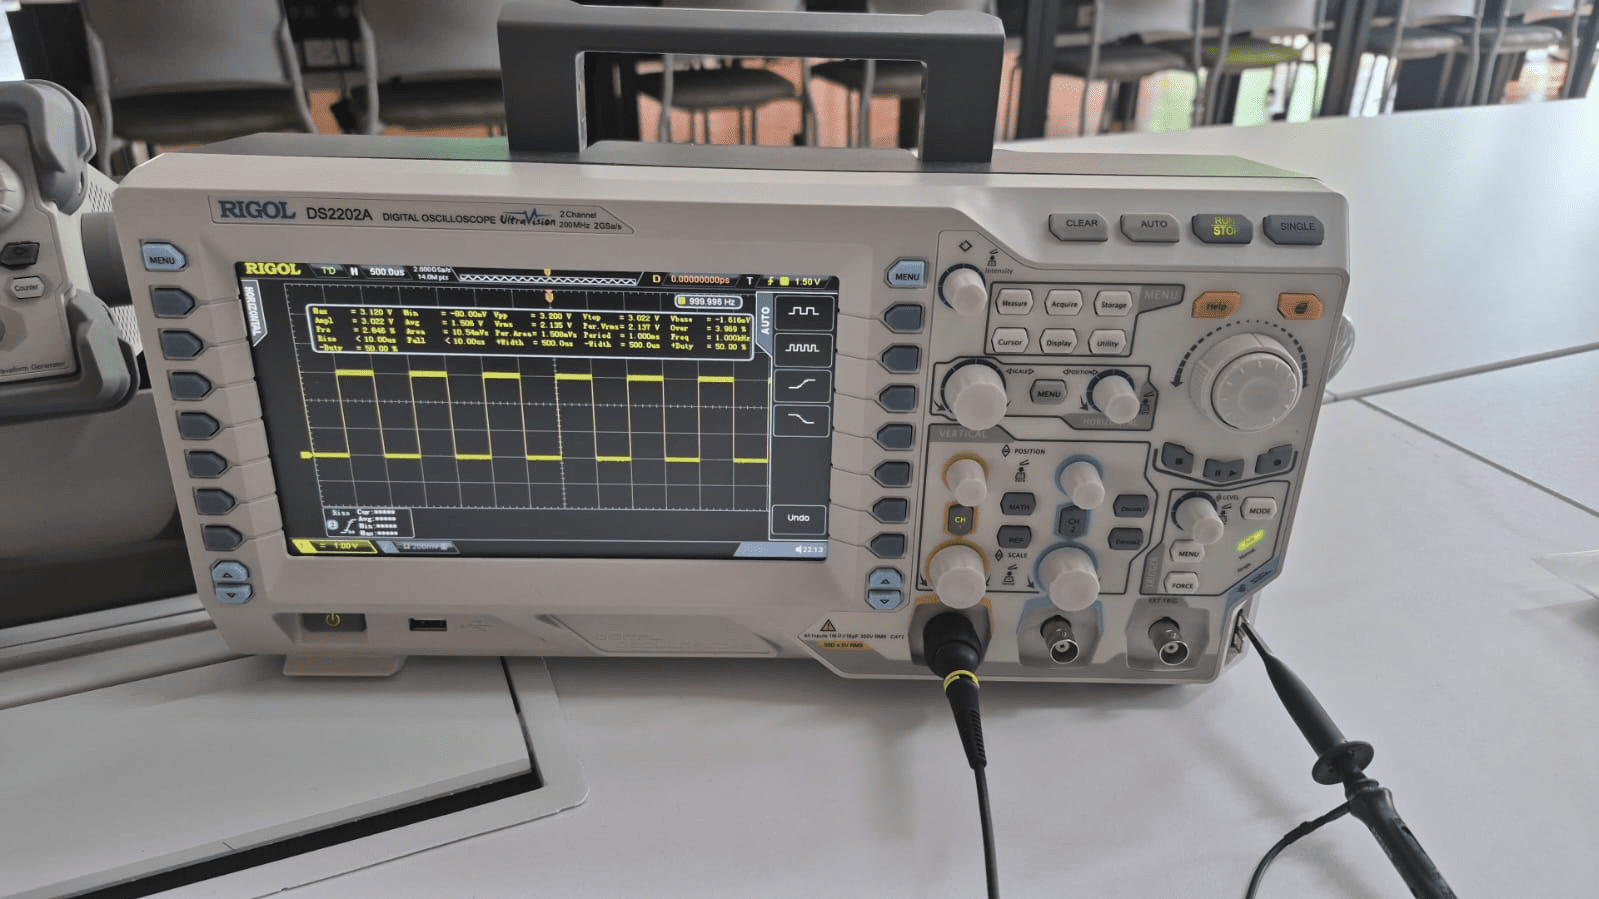
Initial oscilloscope calibration using the built-in square-wave reference signal.
Signal generation and real-time visualization using the function generator and oscilloscope.
Generating and Observing Signals
Once both instruments were connected in parallel, the output channel of the function generator was enabled. The generated waveform was immediately displayed on the oscilloscope, allowing different signal parameters to be modified and observed in real time.
During the experiment, the following parameters were explored:
- Frequency (Hz): changes the signal period.
- Peak Voltage (Vp): changes the signal amplitude.
- Waveform: sine, square, triangle and ramp signals.
- Offset (Bias): shifts the waveform vertically.
Group Conclusion
This group assignment introduced the fundamental laboratory instruments used to generate, measure, and analyze electrical signals. Through practical experiments with a regulated power supply, digital multimeter, function generator, and oscilloscope, we established a structured workflow for validating both DC and AC signals before integrating them into embedded electronic systems.
The experiments demonstrated the importance of selecting the appropriate measurement instrument for each task. While the multimeter provides accurate numerical measurements of electrical quantities such as voltage and current, the oscilloscope enables real-time visualization of signal behavior, making it possible to analyze waveform characteristics such as amplitude, frequency, and signal shape.
By documenting the complete measurement process, our group established a repeatable methodology for signal verification that can be applied throughout future Fab Academy assignments. This workflow provides a solid foundation for debugging electronic circuits and understanding how sensors and embedded systems interact with real electrical signals.