Oscilliscope Exploration
In addition to the group project this week, Mr. Durrett walked me and some other students through using the oscilliscope with the WaveForms software.
I downloaded WaveForms here.
I connected the 1- pin to GND and 1+ to the pin blinking the led. I then selected "scope" and pressed Run. I also went to Settings > Device Manager and made sure the USB device was selected. Run began measuring volage, and I went to Measurements > Add > Defined Measurement, then was able select what I wanted to measure by selecting it then clicking Add. Then I needed to let it run for a while as values began to populate.
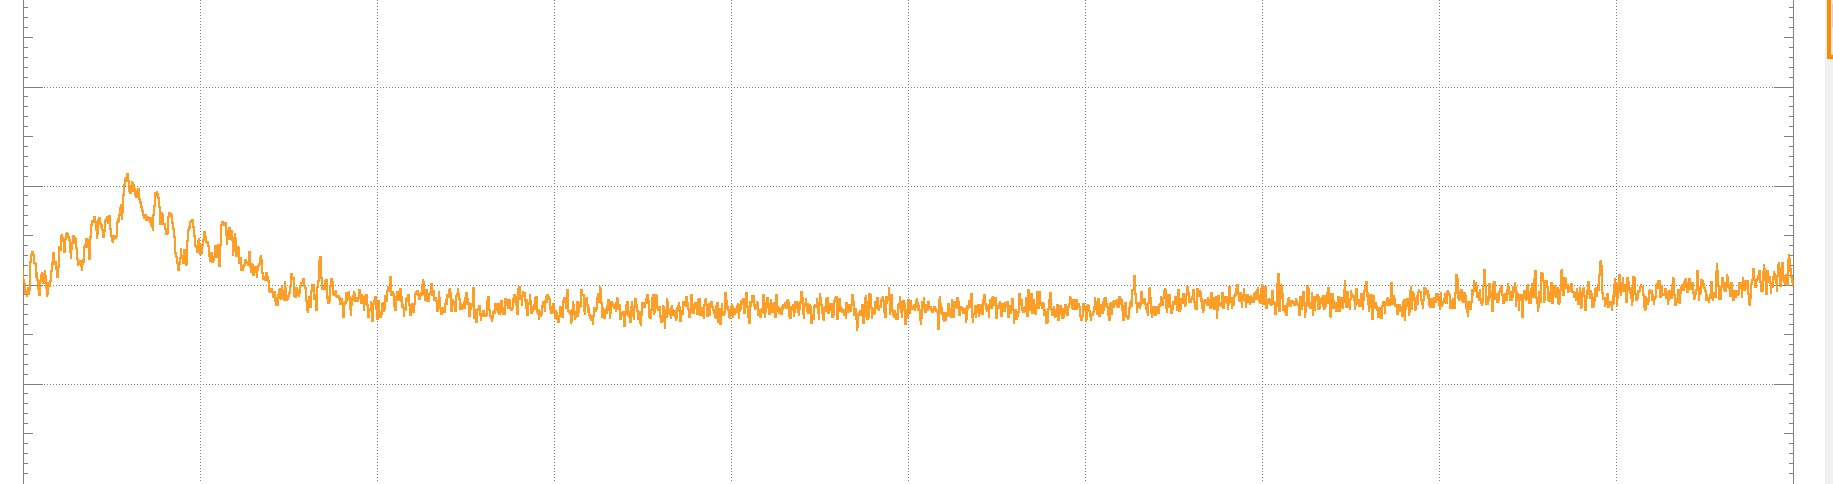
To read the fluctuations in the current I navigated to the Spectrum tool. I then deleted Trace 2 and set the Type of Trace 1 to Peak Hold. This showed slight variations in the electrical current that can arise from a multitude of uncontrollable, outside variables. The x-axis represents all of the frequencies that add up to make the signal, and the y-axis represents the power of each of those frequencies.