Expert Network Map
All future documentation will take place in the Expert Network Map repo.
Iteration 5
Here's a link to the program running!
Find all of the code in this GitLab repo!
No updates to Python code, so refer to the previous iteration for the code used.
The project was added to the project index repo in the README.md file. Read more about the repo's purpose here. It is also linked on the Fab Academy website.
I created the .gitlab-ci.yml config file using GitLab Pages to serve HTML files from the public directory.
Updates
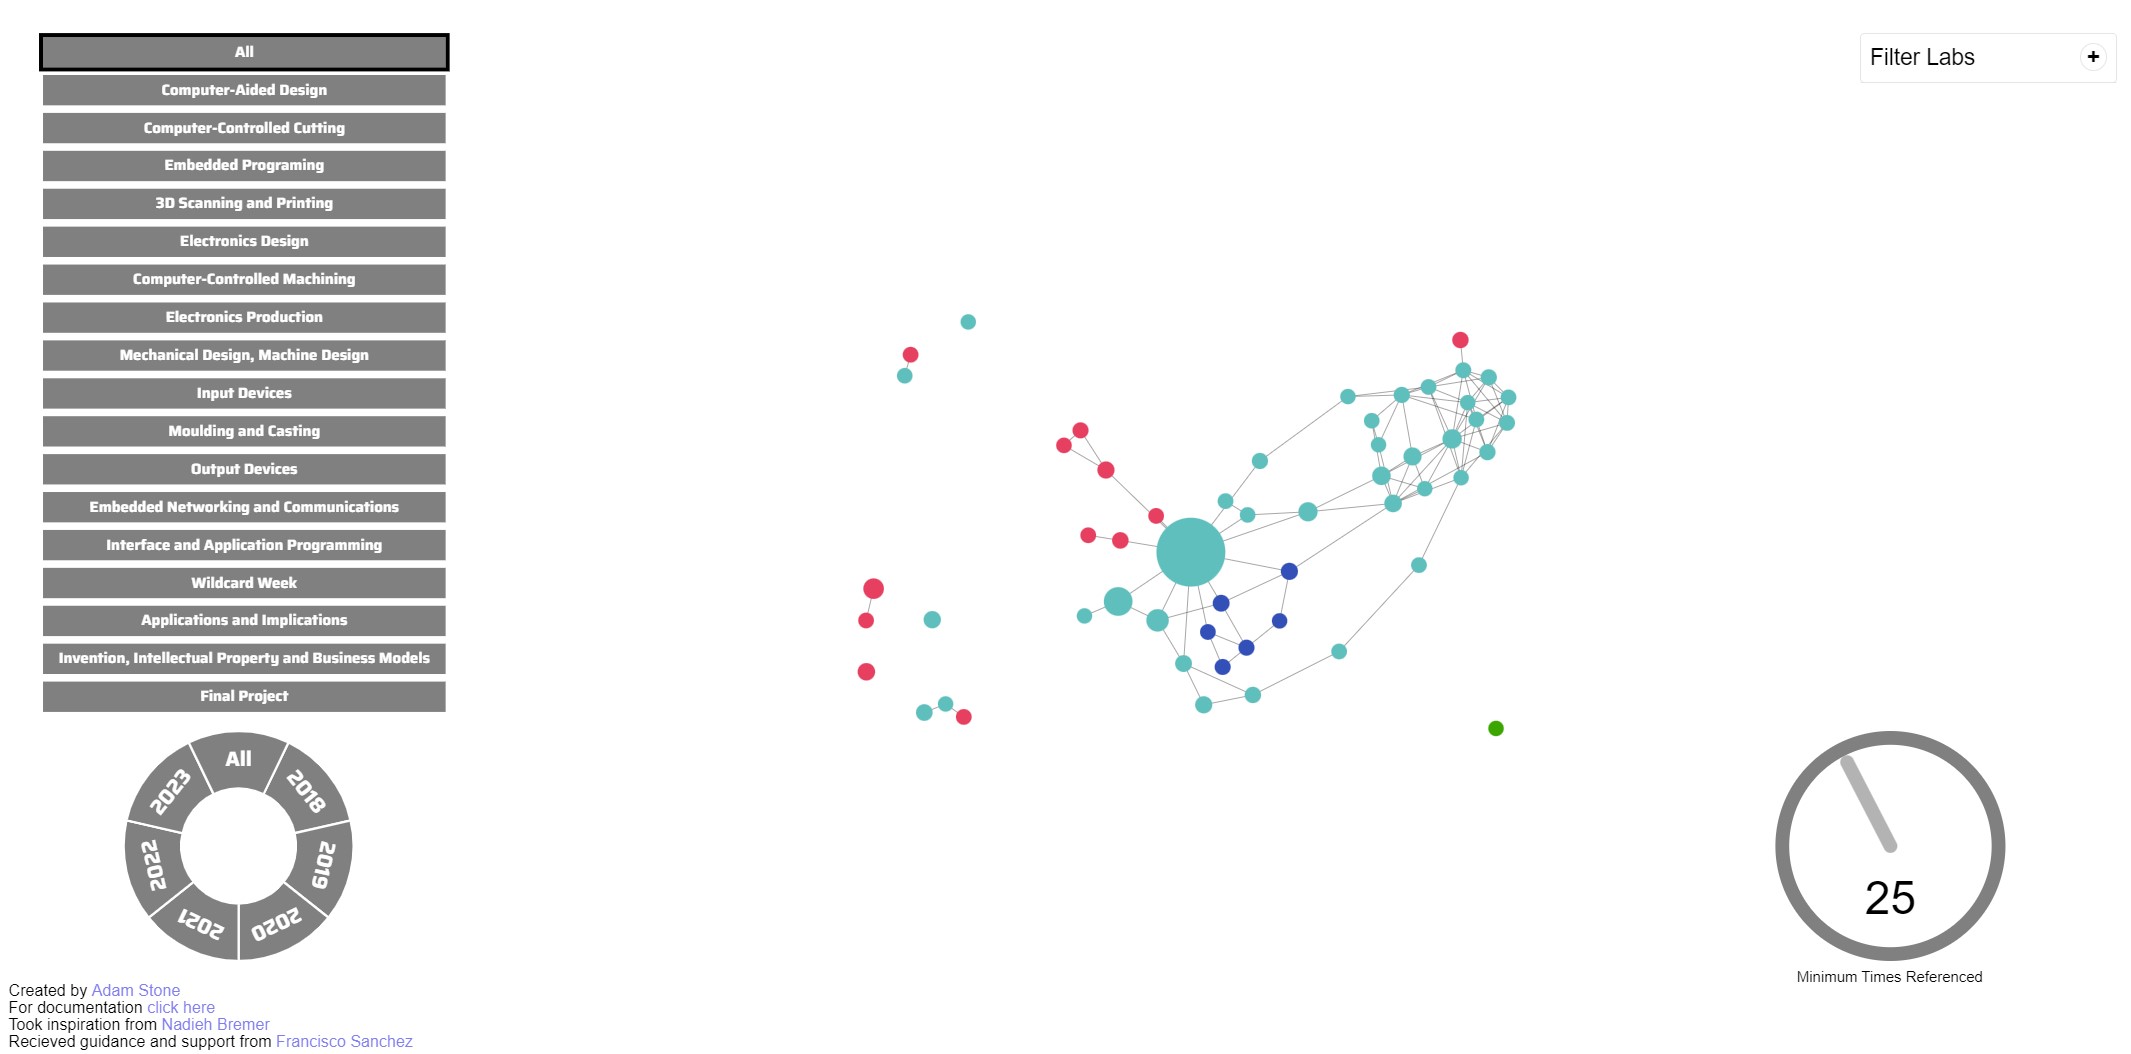
- Live site moved from my personal Fab Academy site to the new
Expert Network Maprepo Minimum Times Referenceddial minimum set to1to improve performanceMinimum Times Referenceddial maximum dynamically changed when a different topic is selected based on maxmimum number of connects for students relating to that topicMinimum Times Referenceddial interactions changed to be more intuitive with circular as opposed to horizontal dragging- Minimum
deselectedopacity for nodes changed to0.15to reduce confusion (users can see the circles and understand that they are simply not highlighted and that they haven't disappeared or become too small) - Introduction and instruction text added
- Links to the documentation and others relevant sites or people added in the bottom left corner
Iteration 4
Click here to download the JavaScript/HTML/CSS code for this project!
Click here to download the updated Python code + cached data for this project!
Here is a link to the final_data CSV file!
Instructions
Download the first ZIP file linked above and extract it.
Open the command line and navigate to the extracted folder.
Serve the webpage. I used Python to do this by running...
python -m http.server
Then open 127.0.0.1:8000 in your web browser of choice. Chrome is recommended as I used it for development.
Updates
- Bugs with data collection resolved (links between years included, students/labs previously cut off from pagination included)
- Interactive visualization using D3JS (connections between students + connection strength, "topic experts" demonstrated through node size, topic/lab/year filters)
repo_namesfolder added in Python setup for increased caching- Note: I did not re-run the machine-learning model with a data size larger than 13,000, so I did not update the code for main_collection.py
- Naming issues fixed (all names now reflect people.html on the FabAcademy.org website)
- resolve_name_conflicts.py created to address naming concerns above - this is run after the creation of the final_data.json file, so the instructions for running the program are the same as a previous iteration except for this should be run afterwards
- loading_animations.py removed
- matrix2d3js.py created to transform CSV data to a json format for the JavaScript to easily read
I took inspiration from Nadieh Bremer's Royal Constellations project.
How To Run Python Data Collection
Note: this step is unnecessary for running the visualization as the program's output is included in the ZIP download for the JavaScript/HTML/CSS code.
Note: to re-collect the data instead of simply converting to a CSV remove the content of the four subdirectories of the downloaded ZIP file
python -m venv venv
venv\Scripts\activate
pip install -r requirements.txt
python main.py
python matrix2d3js.py
python resolve_name_conflicts.py
JavaScript Code
Note: When serving the file through MkDocs linking JQuery externally created issues so I simply downloaded the JavaScript code and linked it like other files I wrote in the HTML. I did the same for two D3JS libraries so that the program can be run locally without WiFi. These files can be found in the ZIP.
Iteration 3
Click here to download the code for this project!
Here is a link to the final CSV file and the training data for the text-classification model. The pickled model is stored in the ZIP.
Here is a link to the final CSV file in Google Sheets (the website is quite slow with such a large file).
Updates
- all data is stored in a matrix/csv file for easy migration into
d3.js - data collection now works for all years 2018-2023
- connection topic area (ie Molding & Casting, etc) is stored for each connection using 1000 characters before and after the link; I’ve compiled a list of words that automatically qualify a connection as a certain topic (like I2C for Embedded Networking and Communications), and I trained a text-classification neural network for all connections that aren’t automatically classified. I trained the model on 13,000 datapoints from auto-classified connections using the word list described above. The model accuracy = 86.3%, and using a gridsearch algorithm, I tuned the hyperparameters and found that learning rate=0.01 and dropout rate=0.1 yielded the best results
Setup
What I Did
Create a directory with four subdirectories: NLP_data, people_saves, reference_dict_saves, and student_repo_id_saves. Put all of the below Python files and requirements.txt in the main directory. Run the following in the terminal (I'm using Python 3.9 on Windows).
python -m venv venv
venv\Scripts\activate
pip install -r requirements.txt
Run the following in order: main_collection.py, jsonl2csv.py, train_nn.py, main.py.
main_collection.py scrapes all of the links that have a match because a indicator keyword was found (i.e. I2C for Embedded Networking and Communications). Then delete everything in the reference_dict_saves directorys. Next jsonl2csv.py converts NLP_data/train.jsonl which was created by main_collection.py and transforms the data into NLP_data/train.csv. Then train_nn.py trains a neural network off of the data in NLP_data/train.csv and saves it in the directory in several files. Then main.py runs the final data scraping and conversion. main.py will take a long time the first time it's run, but after that, it won't take long since it caches the data in the subdirectories. Note that main_collection.py is a modified version of main.py and therefore contains some unnecessary code.
How to Run It
The files in NLP_data and final_data.csv were too large to upload to this repo so you can download them from here instead (final_data.csv should go in the main directory), but these are only necessary for training the model, not for running it.
To run the program, download this ZIP file and extact it. This already has the HTTP request data cached, so executing the program shouldn't take long. After downloading and extracting the files, run the following in the terminal:
python -m venv venv
venv\Scripts\activate
pip install -r requirements.txt
python main.py
Code
I used ChatGPT for writing some of the code comments. main_collection.py is fairly untidy, but is simply main.py with a couple of changes for writing to the JSONL file and ignoring not auto-classified references.
Iteration 2
Click here to download the code for this project!
This iteration built off of the previous one to expand the data collection across different labs.
I wanted to visualize students' links to each other in their documentation. I implemented this in Python using NetworkX, requests, matplotlib, and the python-gitlab API. I wrote the below Python scripts to scrape the data across labs and create a graph out of the results. I first ran gitlab_test.py which took ~30min to run, and I copied the output list into the top of all_labs_analysis.py. Then I ran all_labs_analysis.py which didn't take very long.
My biggest learnings from the project were:
- how to use the GitLab REST API
- what
Project IDsvsGroup IDsare inGitLab - web crawling is far more troubling (compared to a backend API) for sites without a unified structure
- how to create loading animations in Python
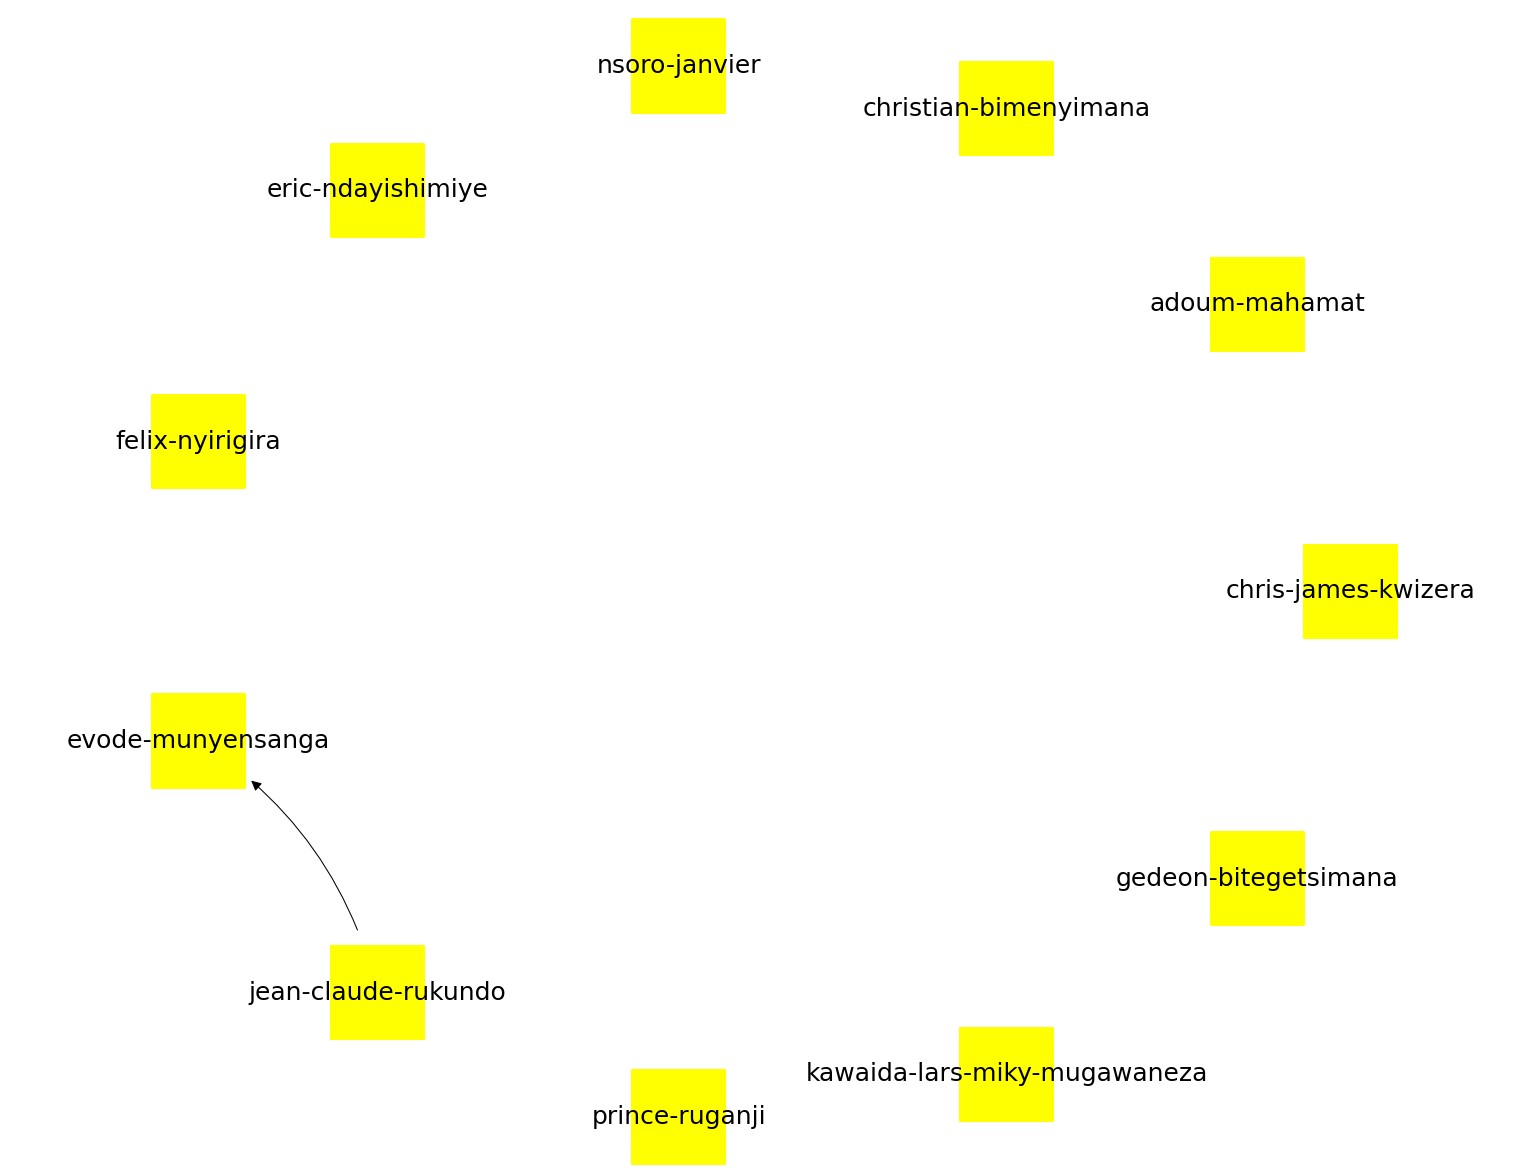
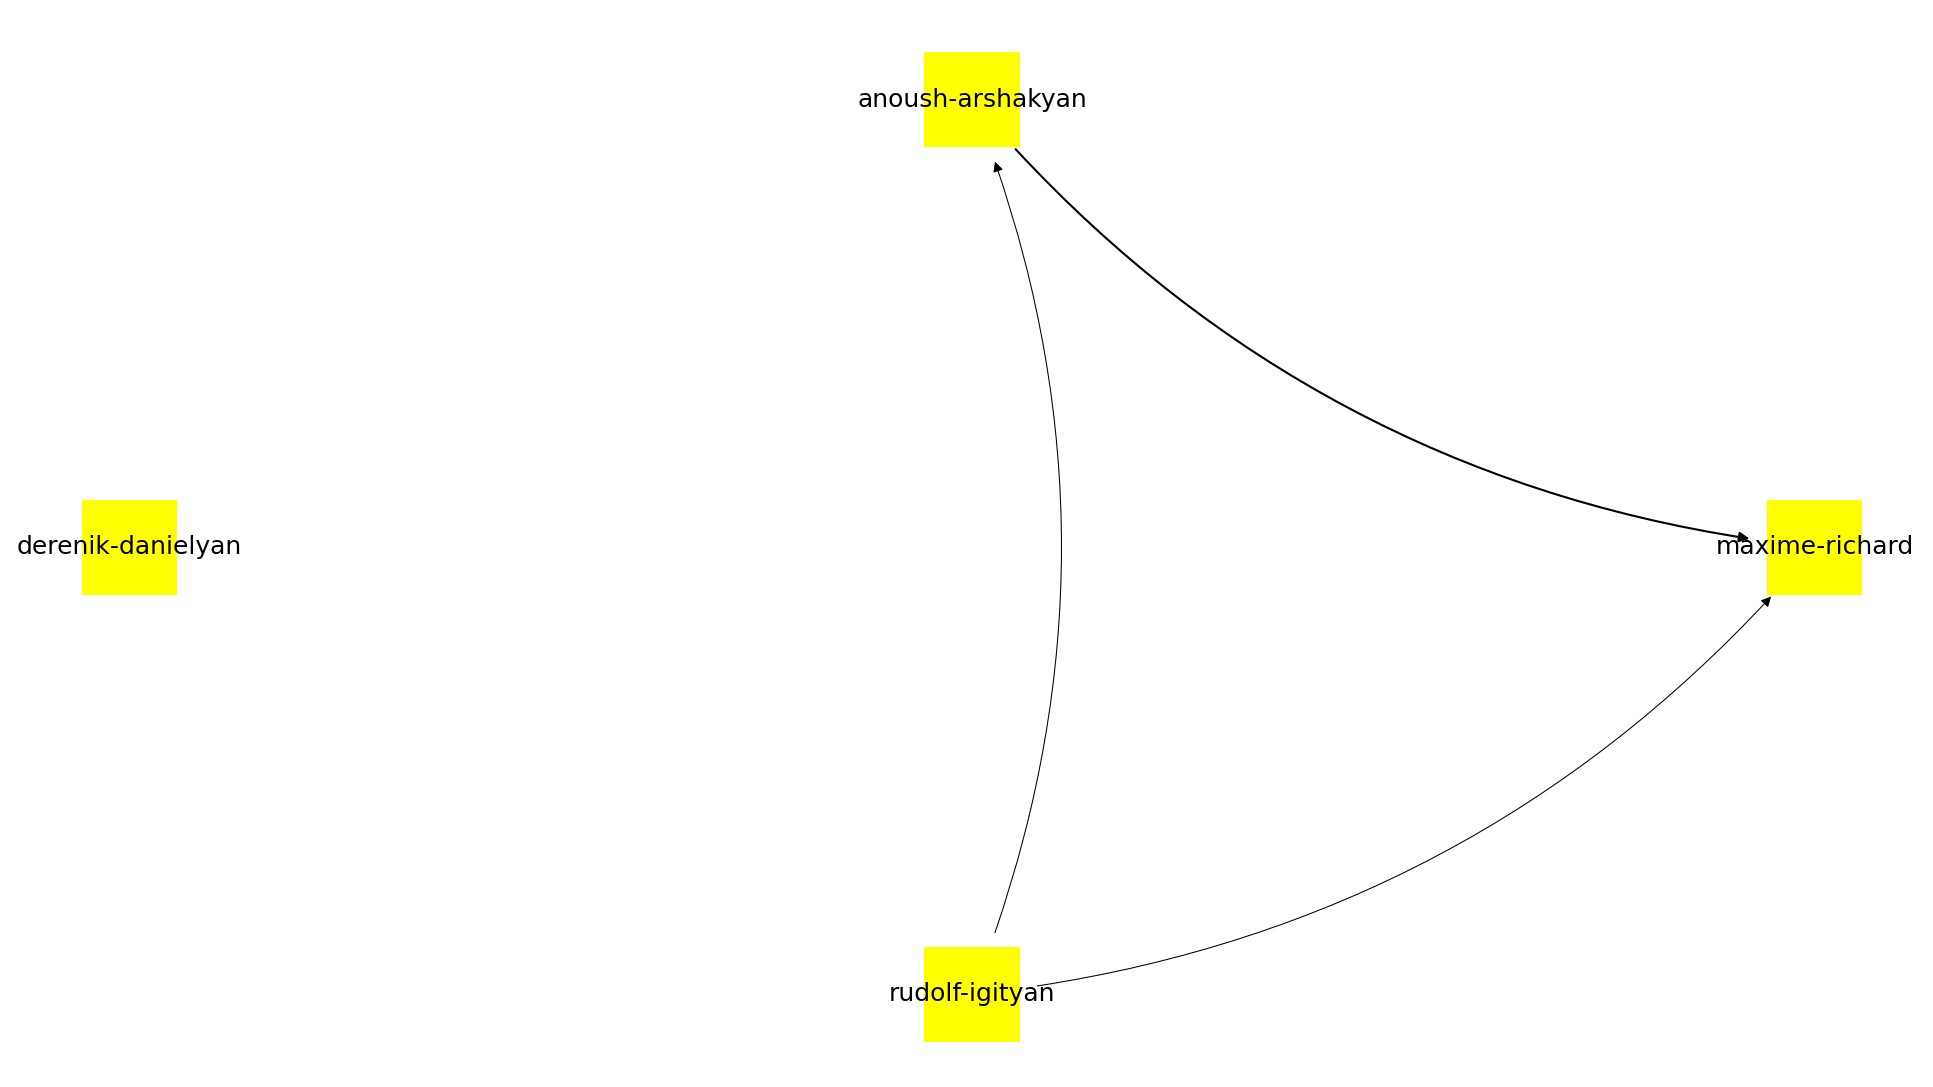
Here are some of the results from different Fab Labs. Labs that aren't included didn't have any connections between students (or had too few students to have connections).


Iteration 1
Click here to download the code for this project!
I wanted to visualize students' links to each other in their documentation. I implemented this in Python using BeautifulSoup, NetworkX, requests, and matplotlib. I first ran main.py which took 7 min to run, and copied the output dictionary into the top of analysis.py. Then I ran analysis.py which didn't take very long.
This project took advantage of the fact that writing an invalid URL in MkDocs usually displays a screen with links to all of the pages, but this is problematic for websites that don't use MkDocs, so I abandoned this system in the next iteration.
For example, this link:
https://fabacademy.org/2023/labs/charlotte/students/adam-stone/-
Analyzing The Graph
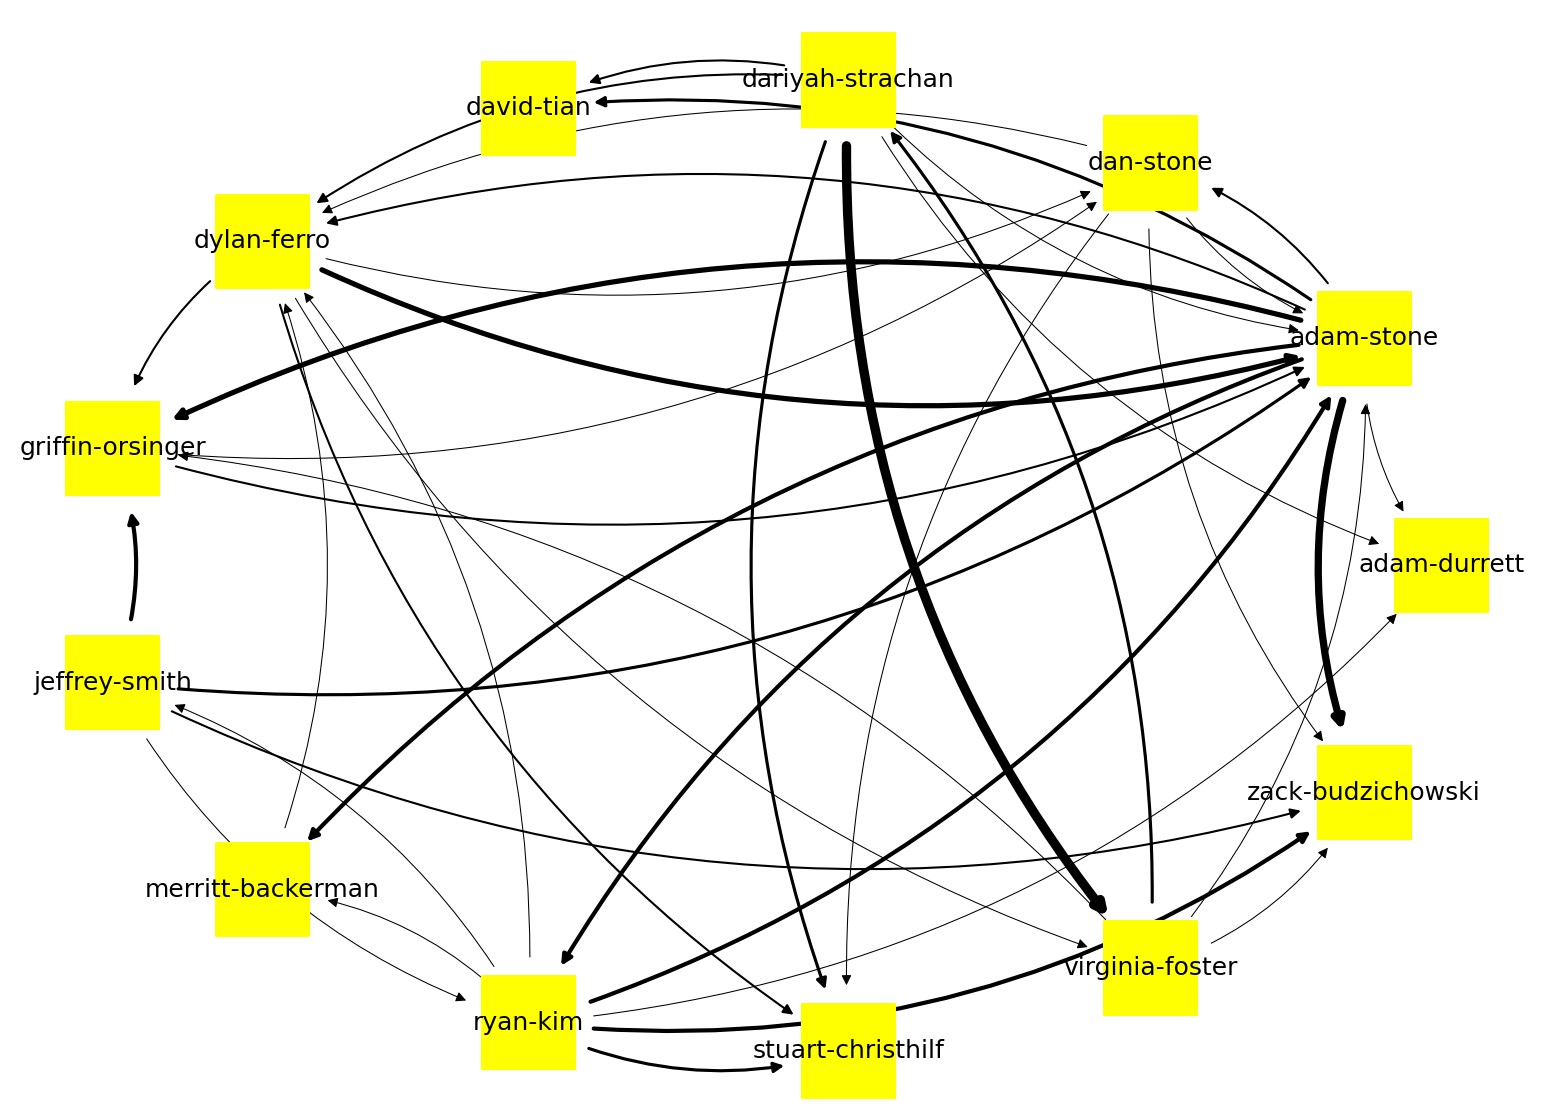
It's very interesting students who are very good friends have much stronger lines connecting them in the graph. I also realized that people usually either have a very small number of thick black lines or a very large number of thick black lines.
Disclaimers
The graph above image was taken on 5/11/23 and does not include credit given that isn't accompanied by a link to another person's site. Also the code is only applicable for 2023 students right now, so the students with no links on the graph are just returning students. It also, for now, assumes that the websites are using MkDocs, so some students' websites who do not use MkDocs may not reflect accurate results.
Future Ideas
I brainstormed with Stuart Christhilf
Stuart suggested that I do the past students on an outer layer of the graph, and we could see going back who is referenced very much, and who that person references, visualizing documentation in a very interesting way, akin to TwitchAtlas, to which Stuart introduced me.
I also recognize the challenges with archived students having a different URL format, but I'm sure this is still possible.
I'd like to get GitLab to automatically update the graph (possibly on the group site) whenever someone pushes documentation, or have it automatically update every week or so.
I also want to make the visualization filterable by week.
Stuart had an idea to make graphs about the number of commits different people have and their actual storage vs repo history storage. Also possibly a graph visualizing commits at different times in the day or week. I also want to make a word cloud out of commit messages.
I also think it would be interesting to use a path finding algorithm to see the degrees of separation between different students i.e. how many connections are needed to traverse the graph from one student to another.