7. Electronics design
Adam Durrett: Taught others how to use Analog Discovery 2 to analyze microcontroller. Made board for LED test Zack Budzichowski: Documentation, Analyzed Microcontroller Dan Stone: Set up the tests and recorded them, Analyzed Microcontroller with Oscilloscope, Made breadboard for Morse Code Test
This week we used an oscilloscope and spectrum analyzer to measure the performance of a microcontroler
Oscilloscope
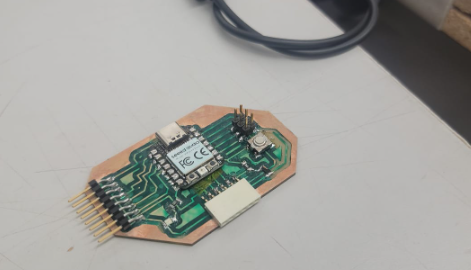
First we used an oscilloscope and an RP2040 Arduino board running the Blink example code to measure the peak to peak voltage, amplitude, frequency and period.
We used Analog Discovery 2 by Digilent as our measurement tool for the Oscilloscope and Spectrum analyzer
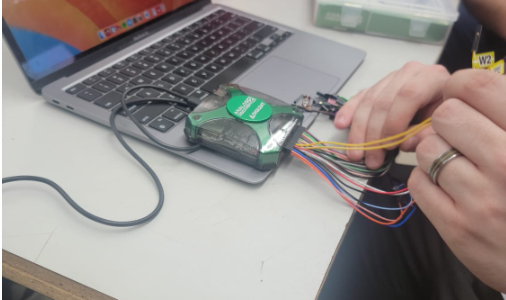
When we hooked up to the ground and the blinking LED we saw the base waveform of the LED pin turning on and off.
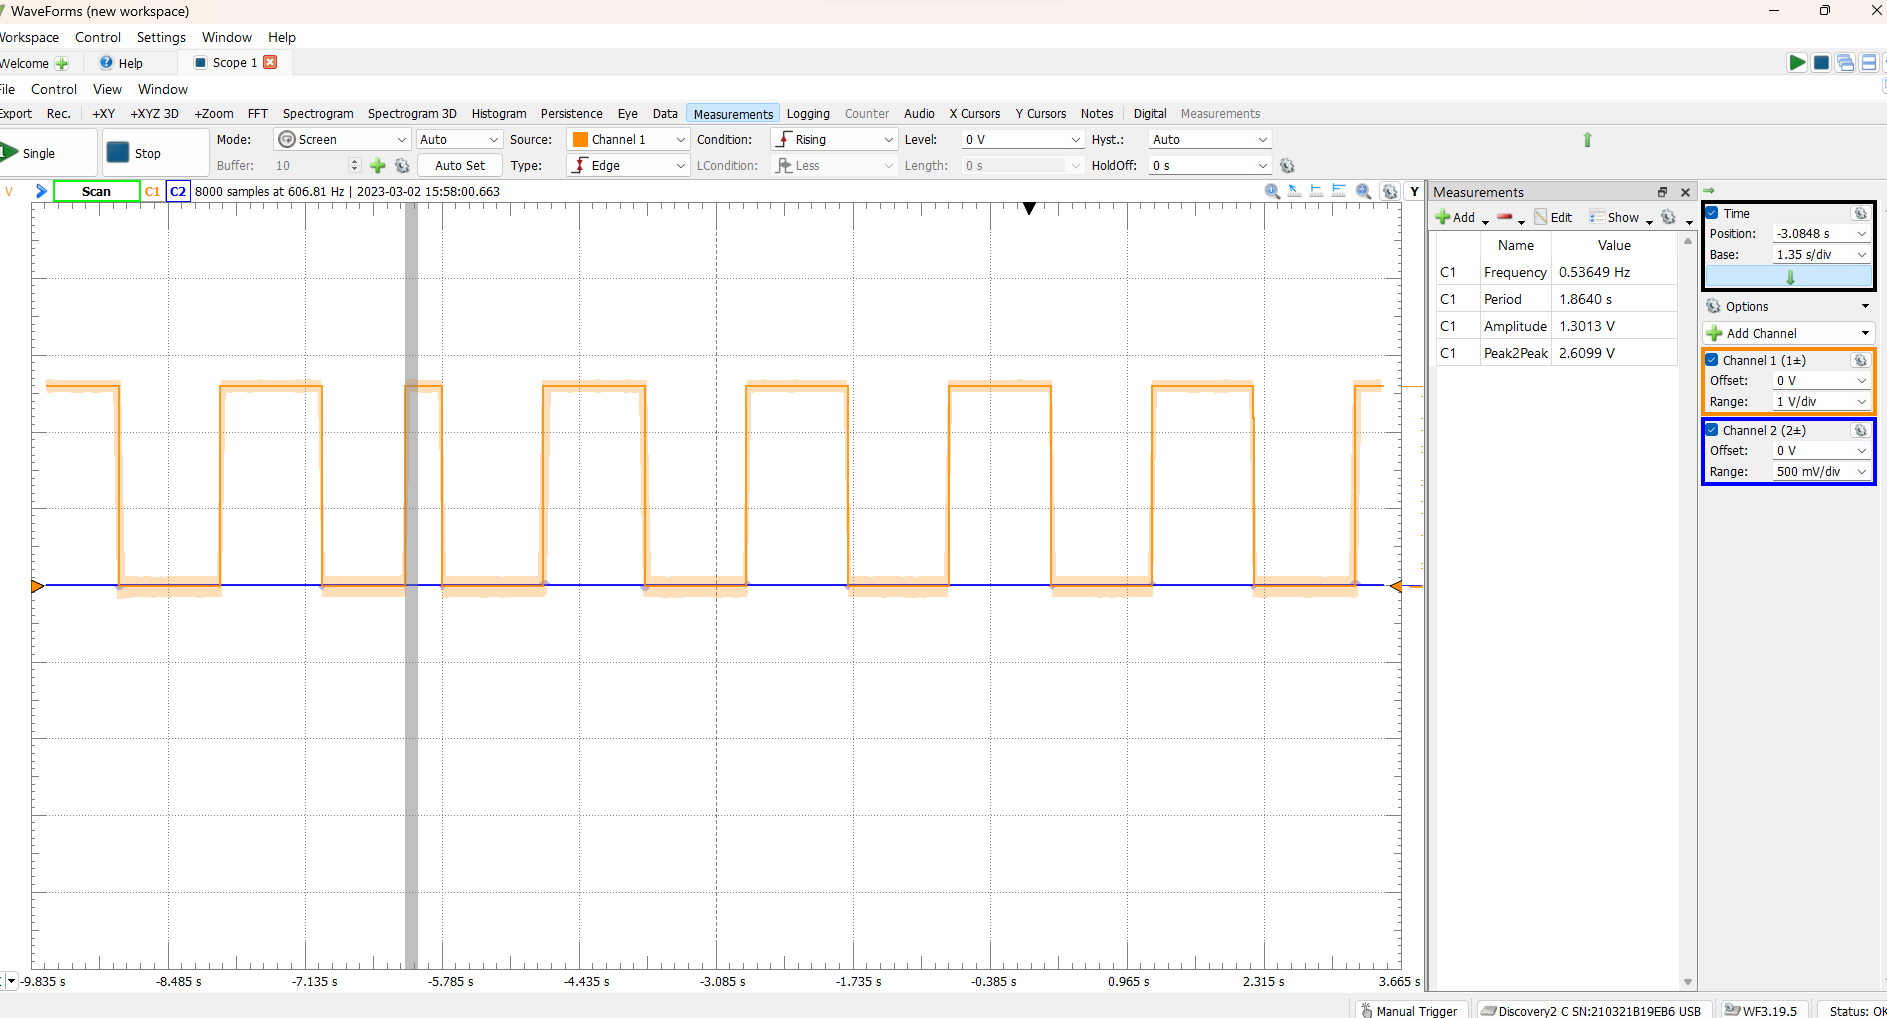
We then told the AD2 to give us the frequency and peak-to-peak voltage of the waveform. It also gave us the amplitude (1/2 peak-to-peak) and the period (1/frequency) of the signal.
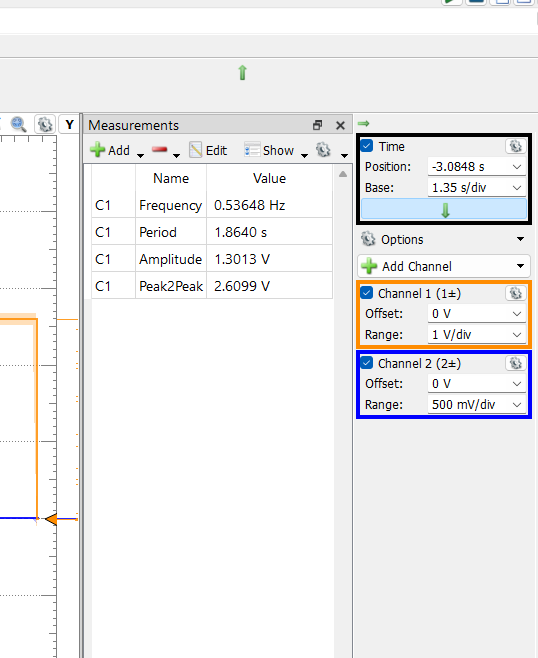
As you can see from the image, the measurements we got were: 1. Frequency - 0.537 Hz 2. Peak-to-peak - 2.6099 V 3. Amplitude - 1.3013 V 4. Period - 1.864 s
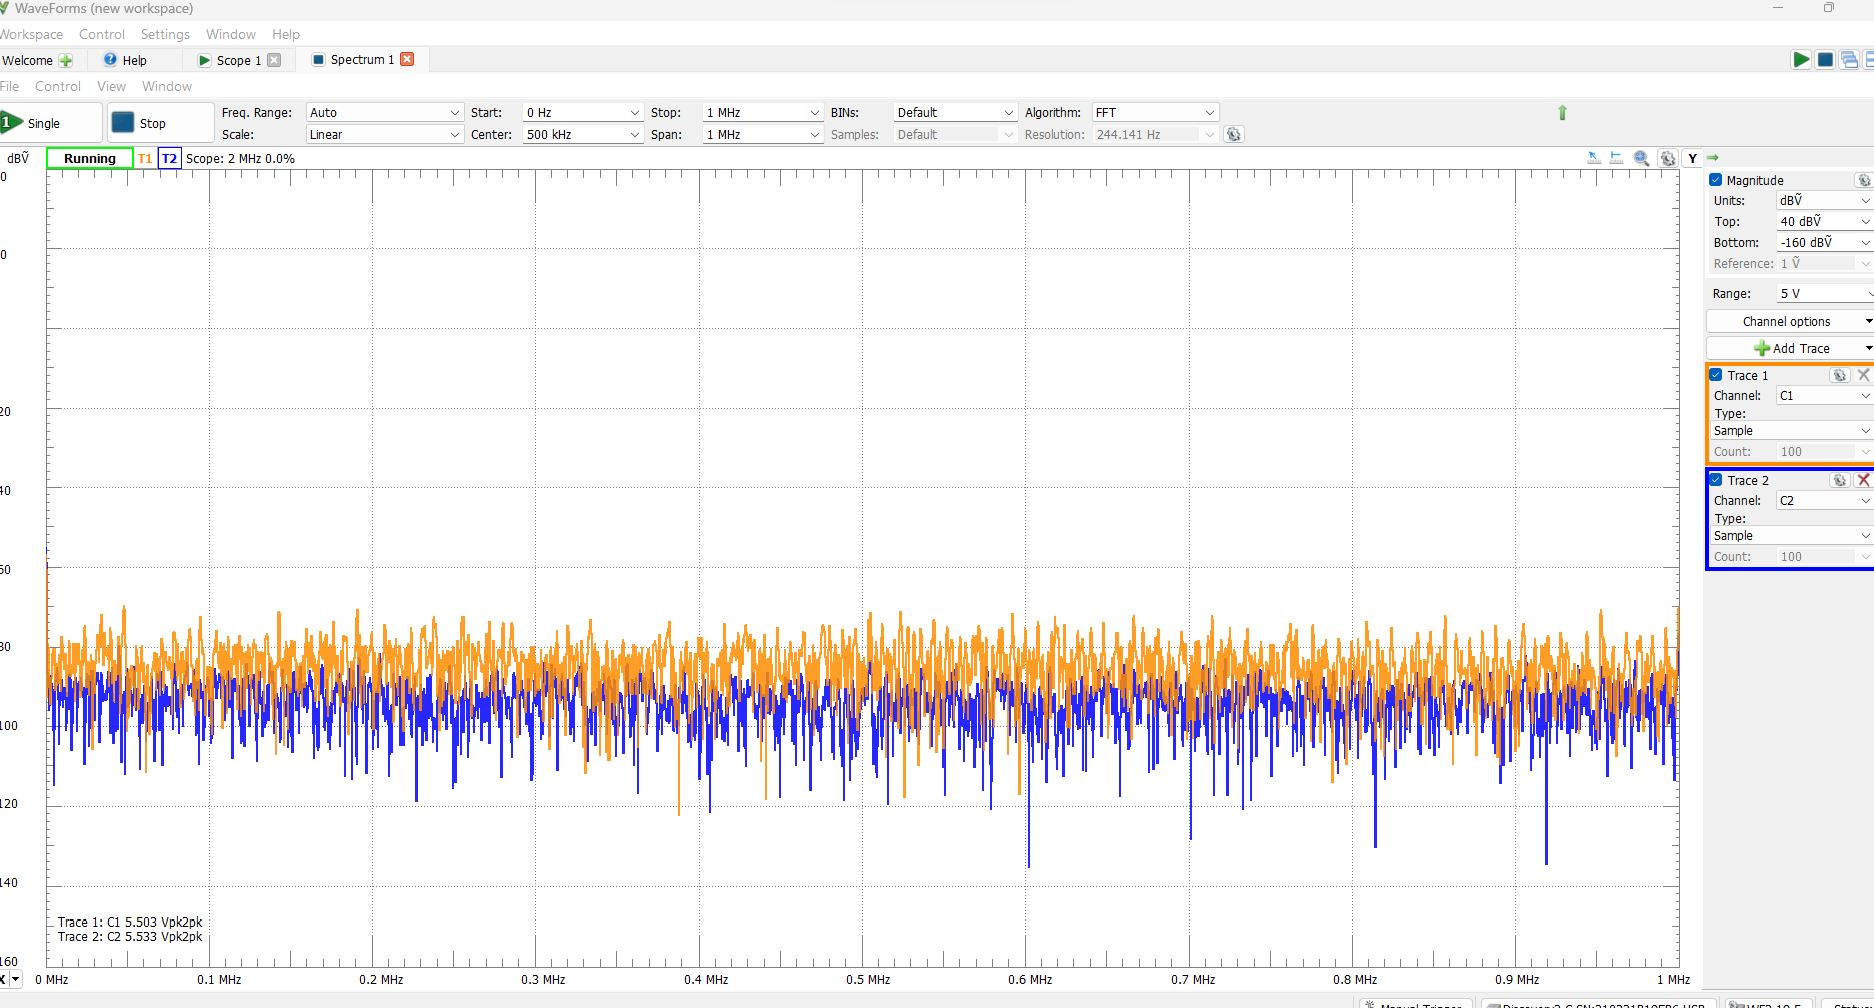
We then wanted to see if there is a lot of noise and so we turned it to spectrum analyzer The thin lighter-yellow bands above and below the wave represent the range of noise occurring in the wave.
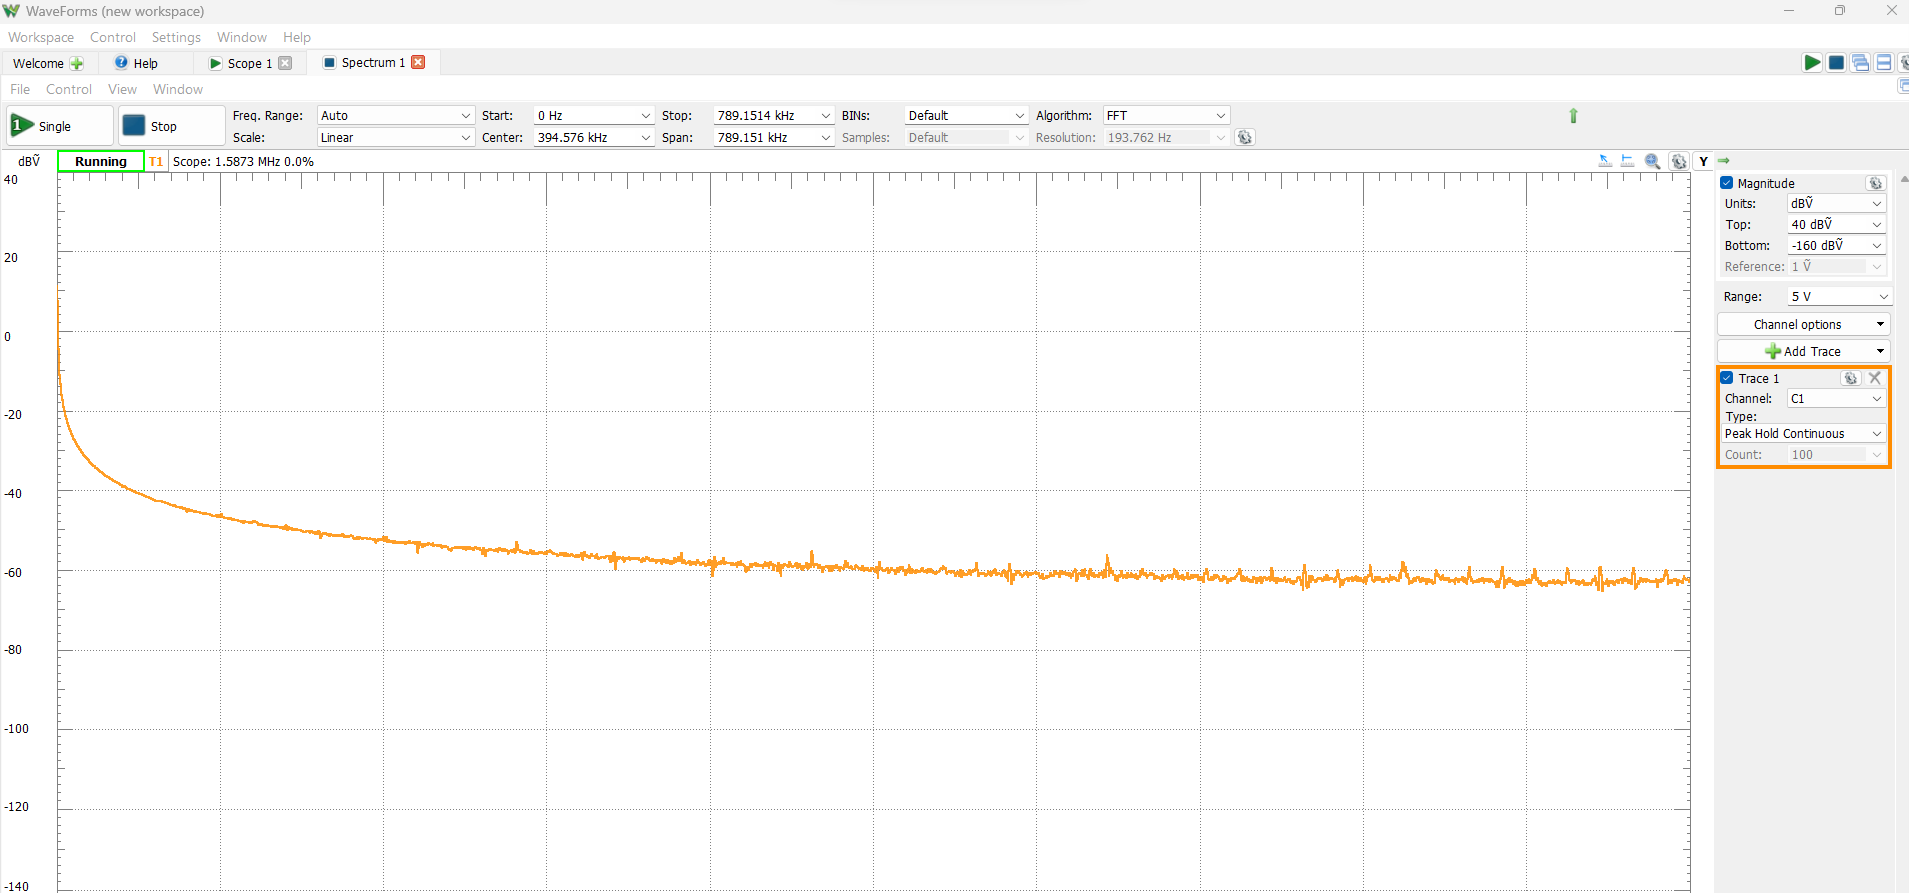
We removed the unused channel, moved to a Peak hold and see that there is minimal noise in the system. This was determined due to the fact that the largest value was the low frequency with a dbV of ~ -50. The rest of the max peak dbV of the other frequencies was -70 dbV.
We then decided to try out the Morse code generator dan stone built in embedded programming week. The pin jumped between 0V to 5V to represent the morse code signal. Short pulses are dots, and the longer pulses are lines.
Here is what the waveform looked like on the AD2: