Week 4 Students A
Griffin, Jed, Adam, Merritt, Ryan
Kerf
In Cuttle, this file was created parametrically to create the vector paths. We had to set the project units to inches before setting the dimensions. Then we copied the rectangle five times.
Next, we exported the SVG from Cuttle, uploaded it to Google Drive, and downloaded it on the computer connected to the laser cutter. Then, we created a new file in CorelDRAW, right-clicked, and imported the SVG. The dimensions were not kept from Cuttle, so we right clicked on the rectangles, clicked Ungroup All Objects, set the dimensions of one square, deleted the others, copied it five times, and used the align settings to ensure they were evenly spaced.
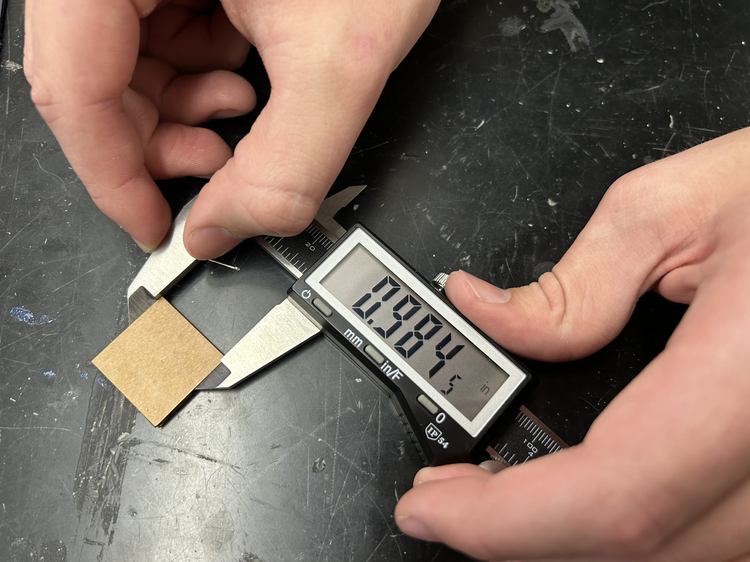
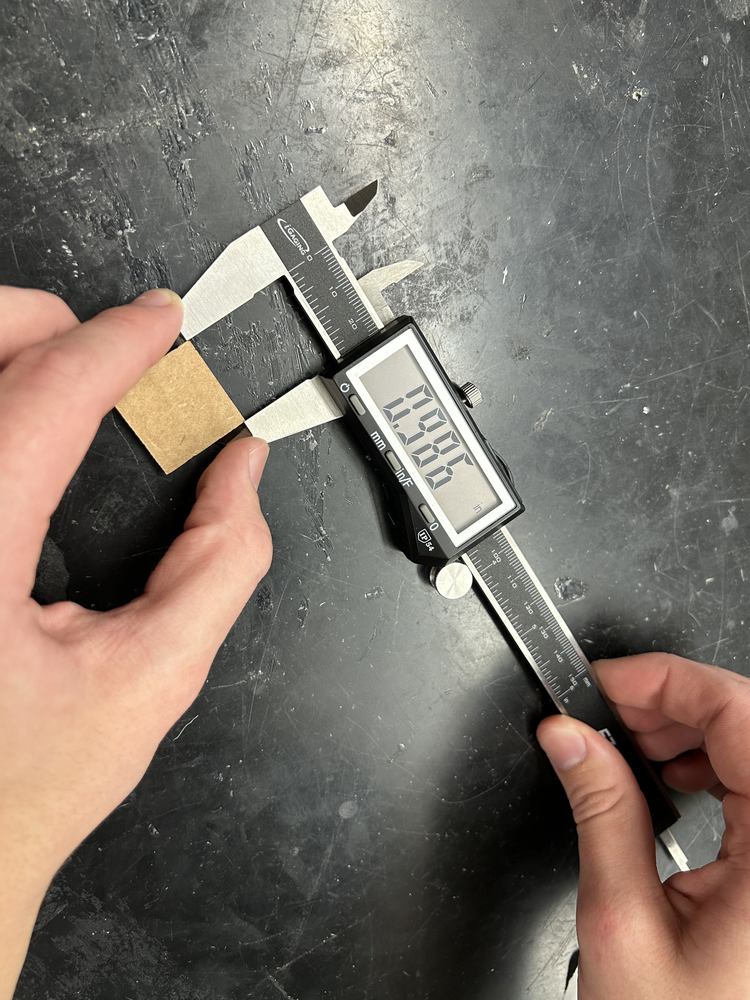
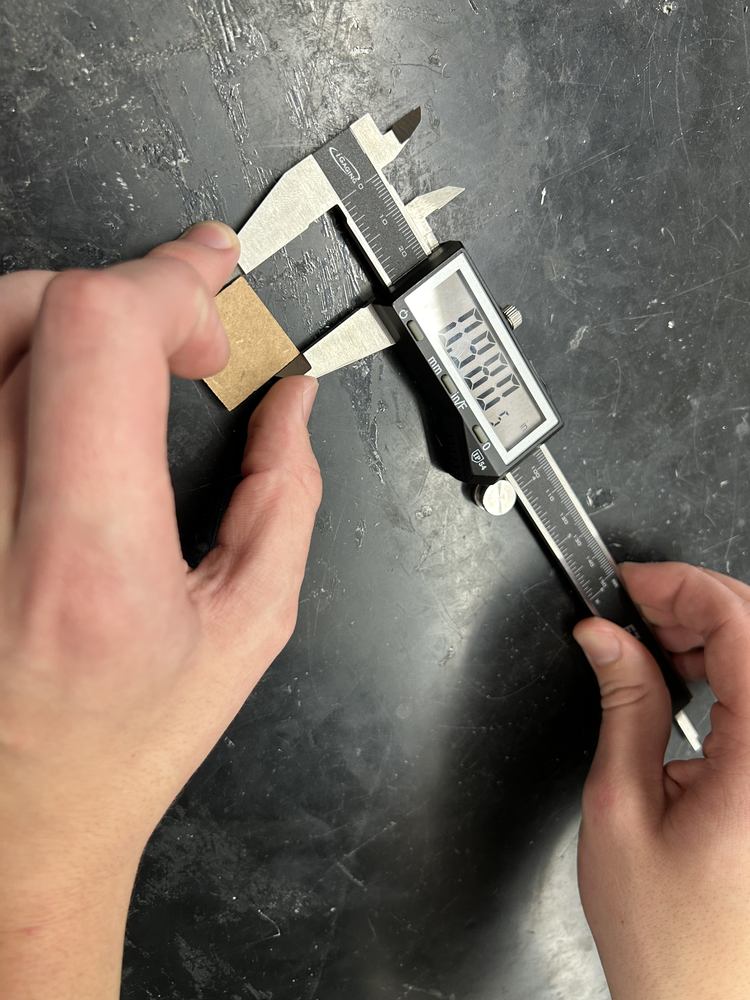
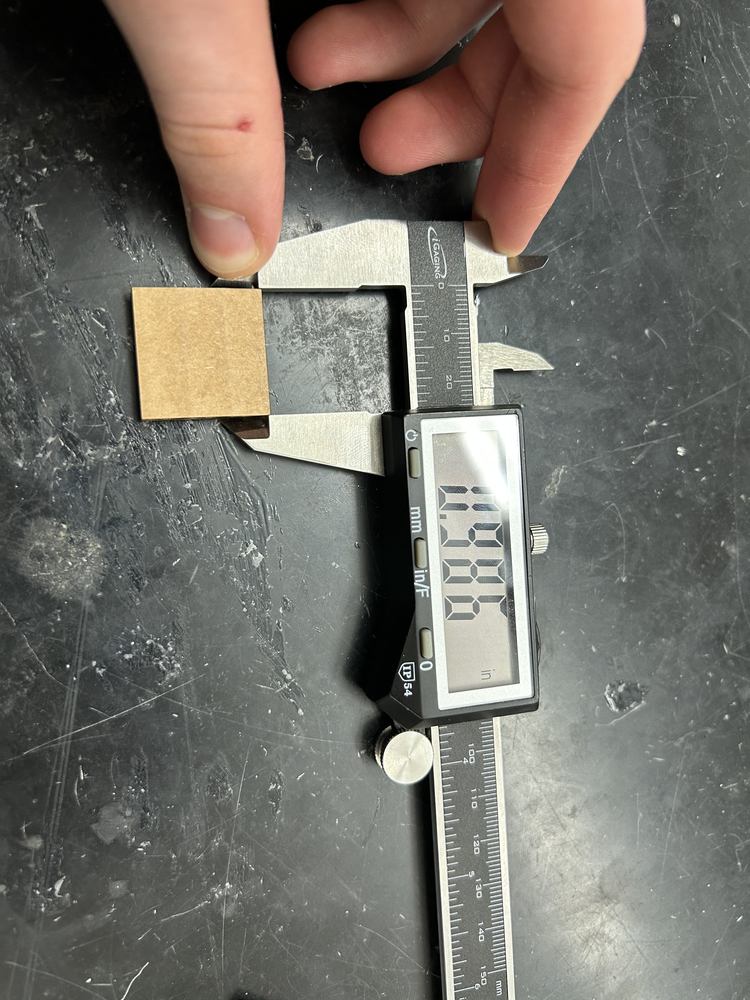
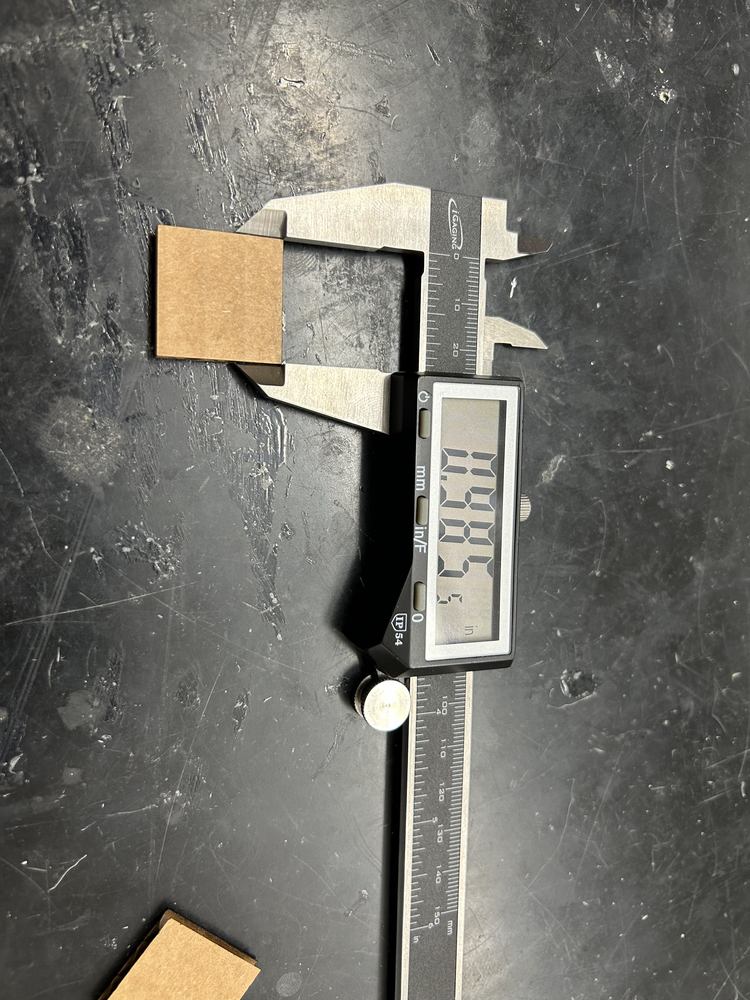
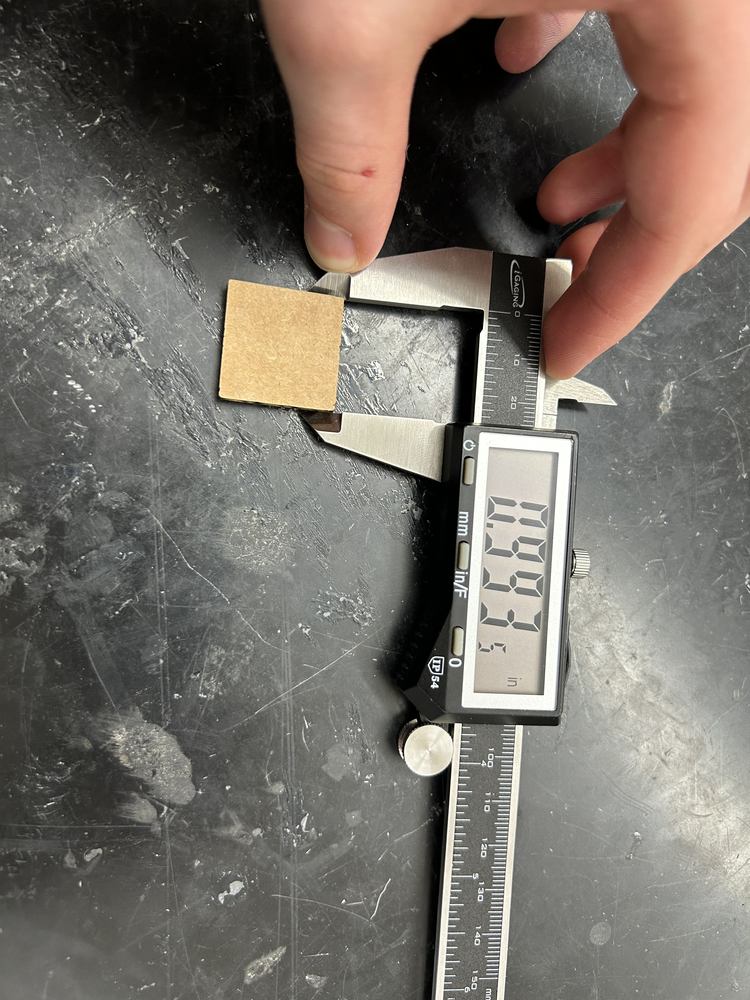
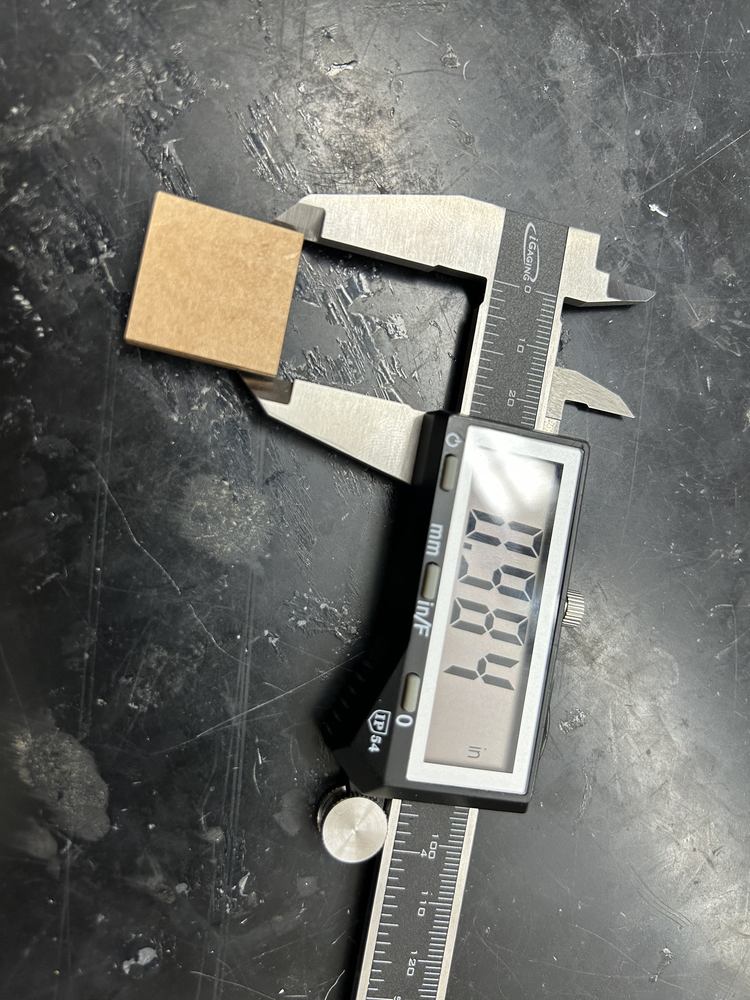
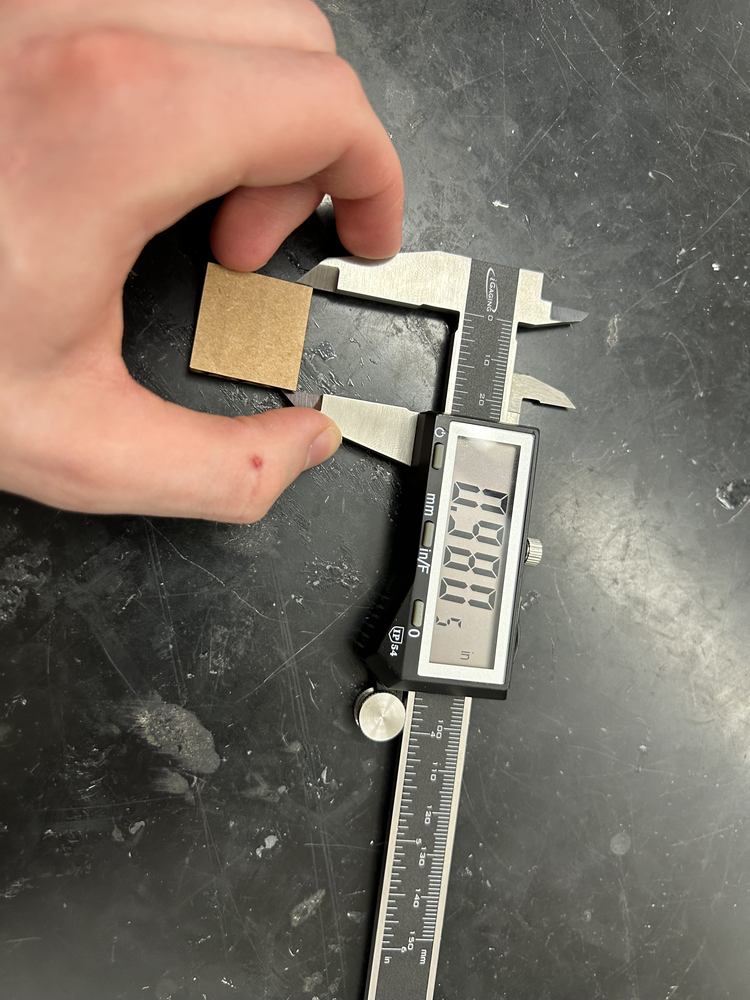
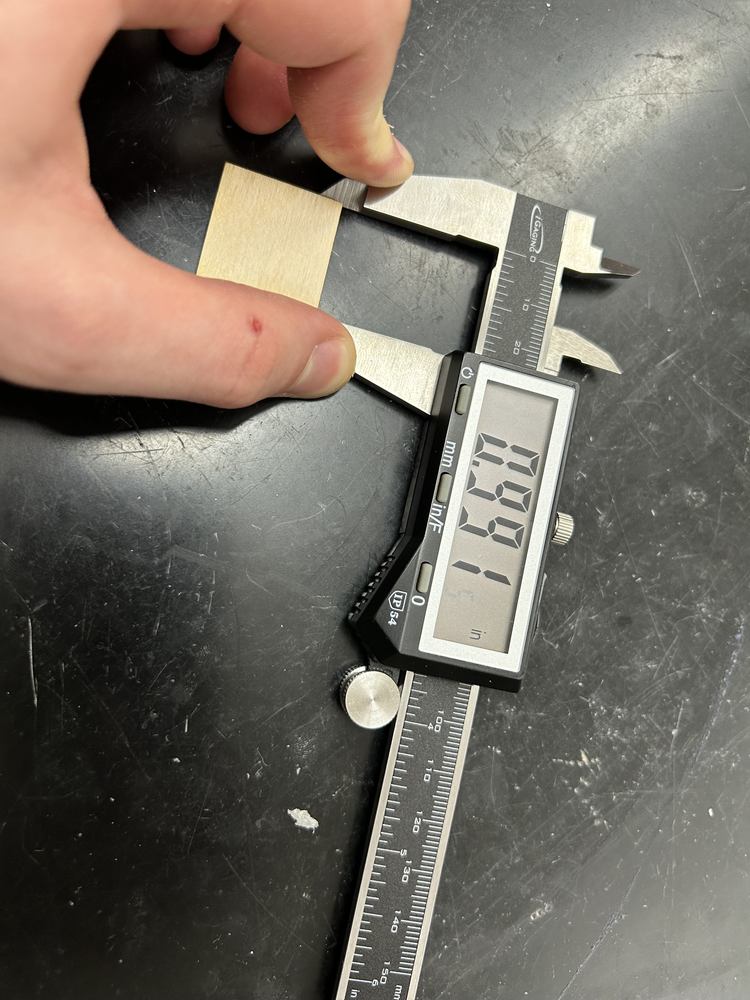
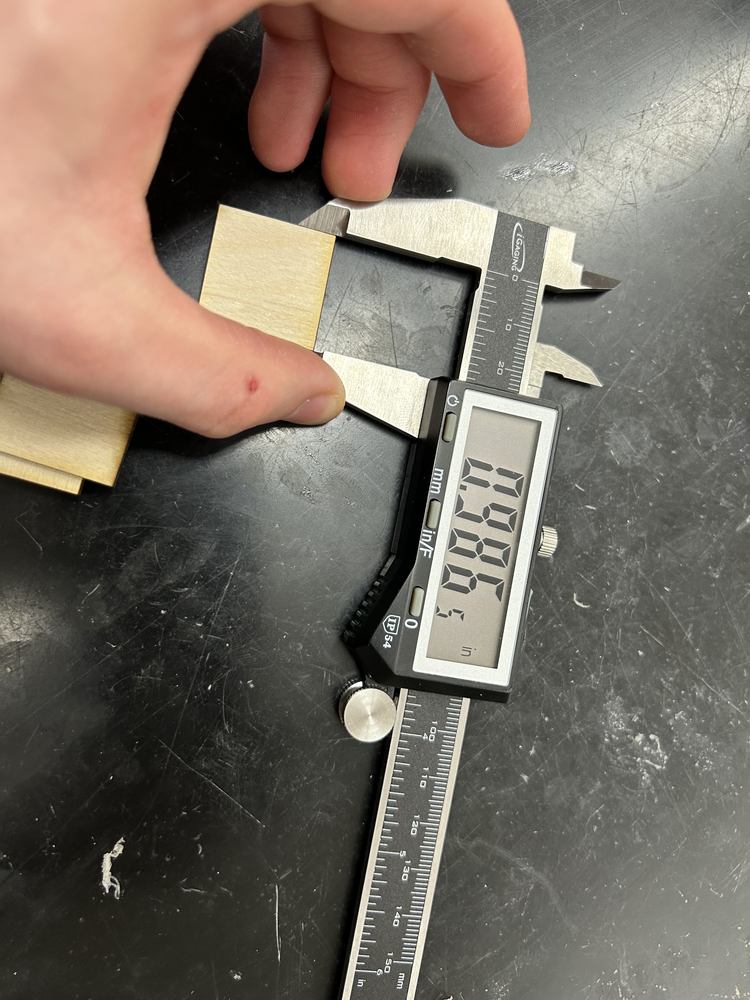
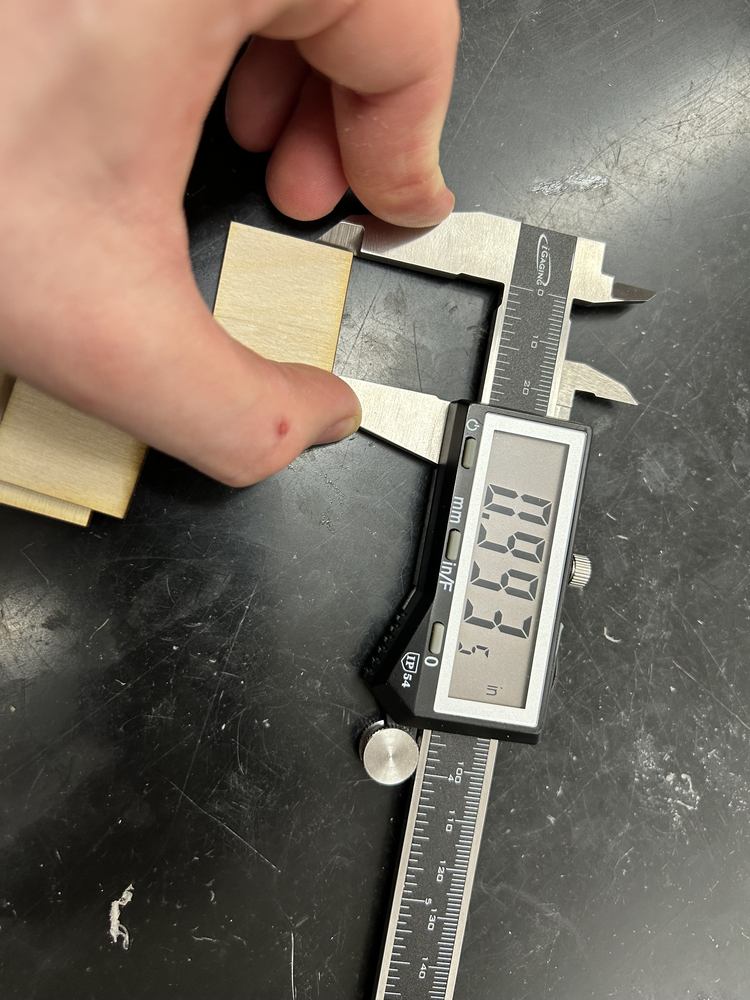
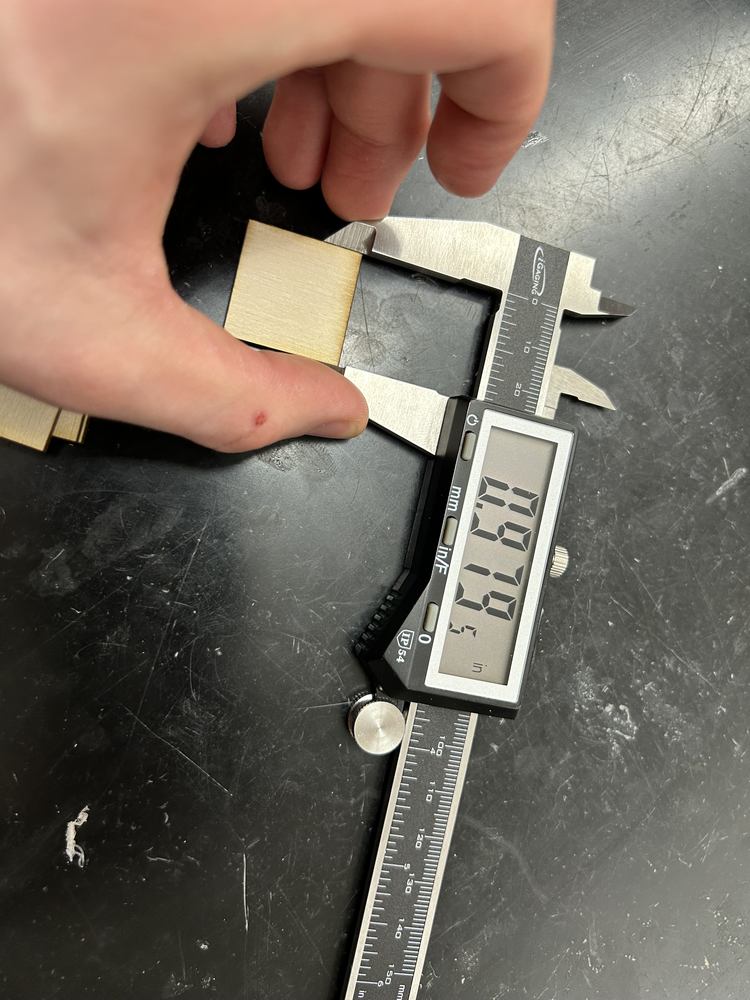
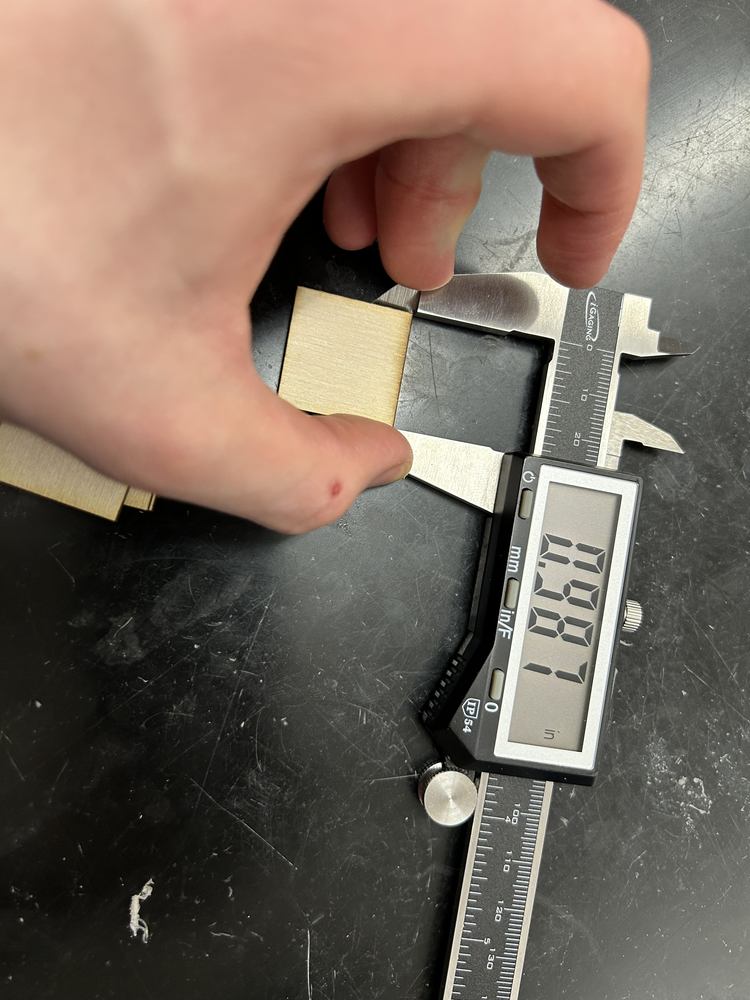
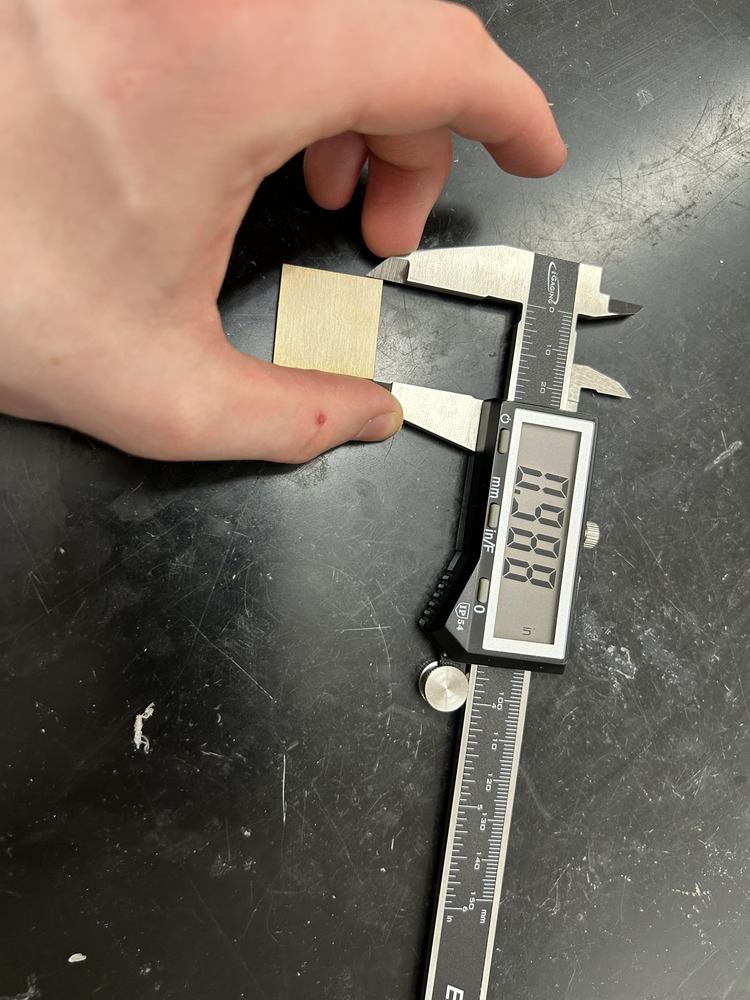
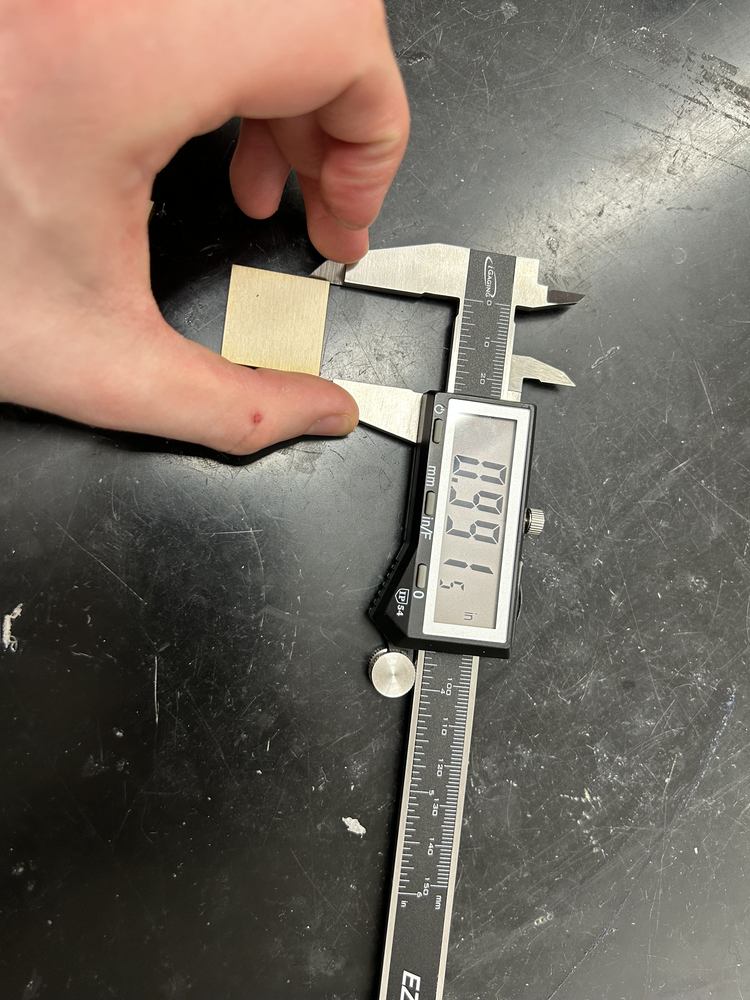
Next we clicked print, then realized that the lines weren’t set to hairline, so we wen’t back to CorelDRAW, set all lines to hairline, and printed again. Next we auto-focused the laser and moved the cut to the bottom left corner of the cardboard. We did the same for wood (measured 0.116in thickness so used settings for 1/8” wood). After we ran the job, we measured the side lengths of the cut out pieces. We also made sure to measure both the side length of the bottom of the face and the top because the curve the focus of the laser makes creates a different amount of kerf vertically. Also, some of the carboad measurements are outliers, so it’s possible that the carboard may have compressed accidentally when we used the calipers, but overall the average should still be accurate. Here are all of the measurements.
Cardboard
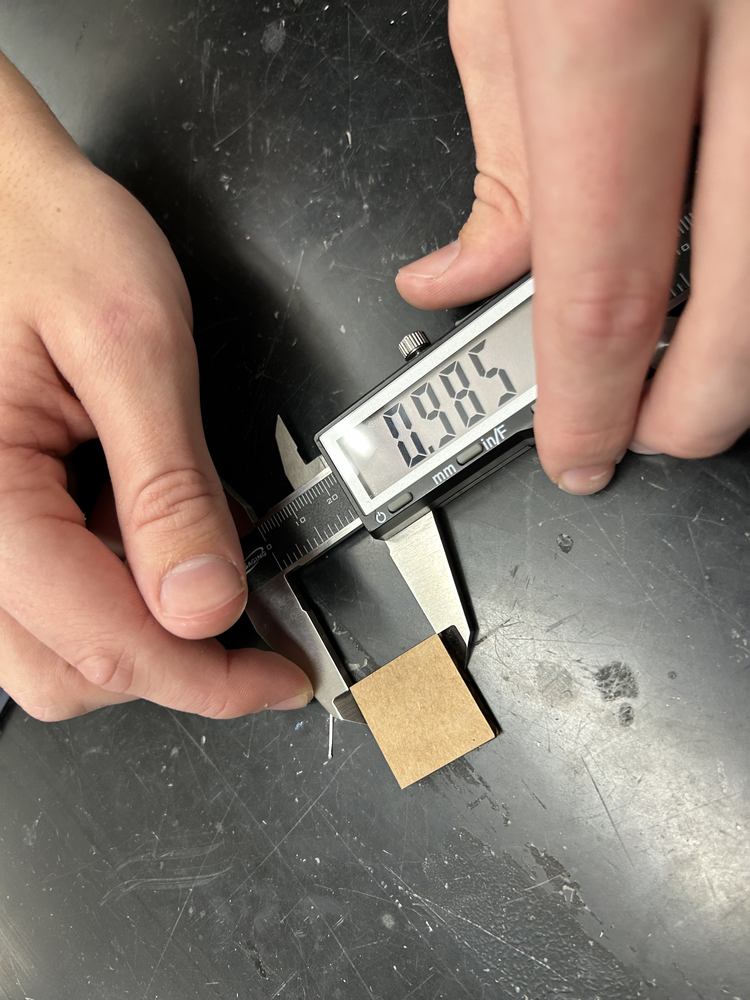
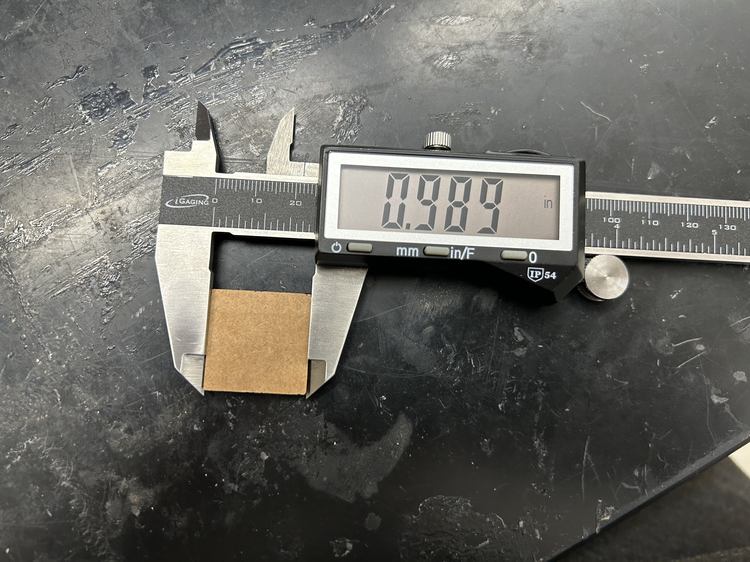
Table
| Smaller Side Length (bottom?) | Larger Side Length |
|---|---|
| 0.984 | 0.985 |
| 0.980 | 0.986 |
| 0.985 | 0.986 |
| 0.983 | 0.984 |
| 0.980 | 0.989 |
| Average Side Length Smaller (bottom?) | Average Side Length Larger |
|---|---|
| 0.9824 | 0.986 |
Average Between Sides: 0.9842
Average Kerf = 1 - Average side length = 0.0158in
Wood
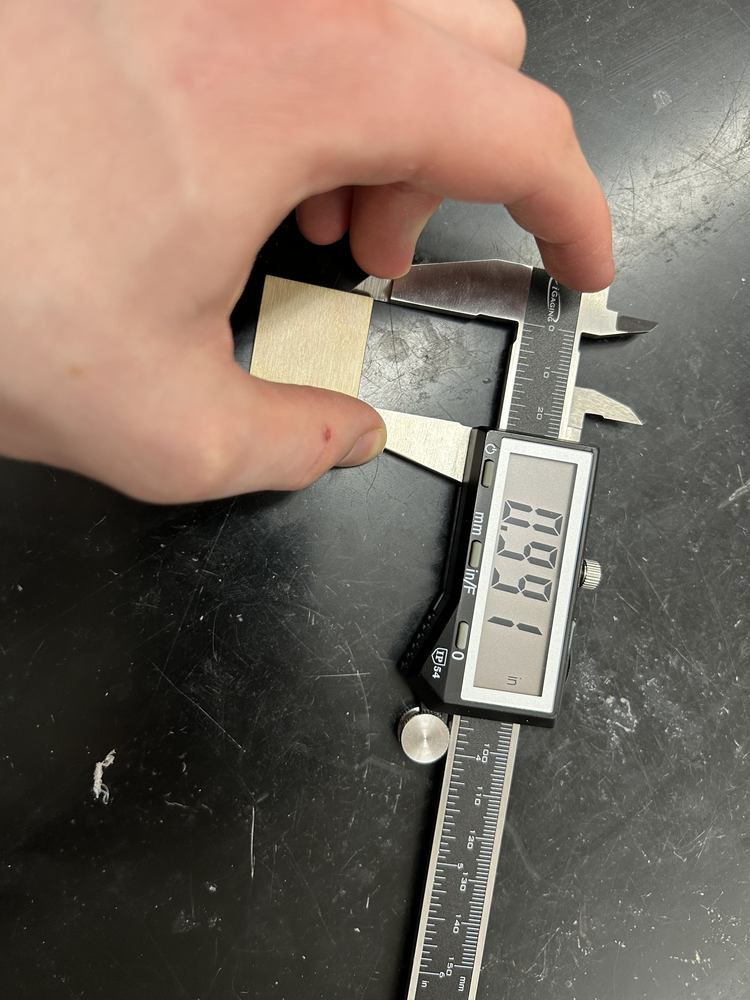
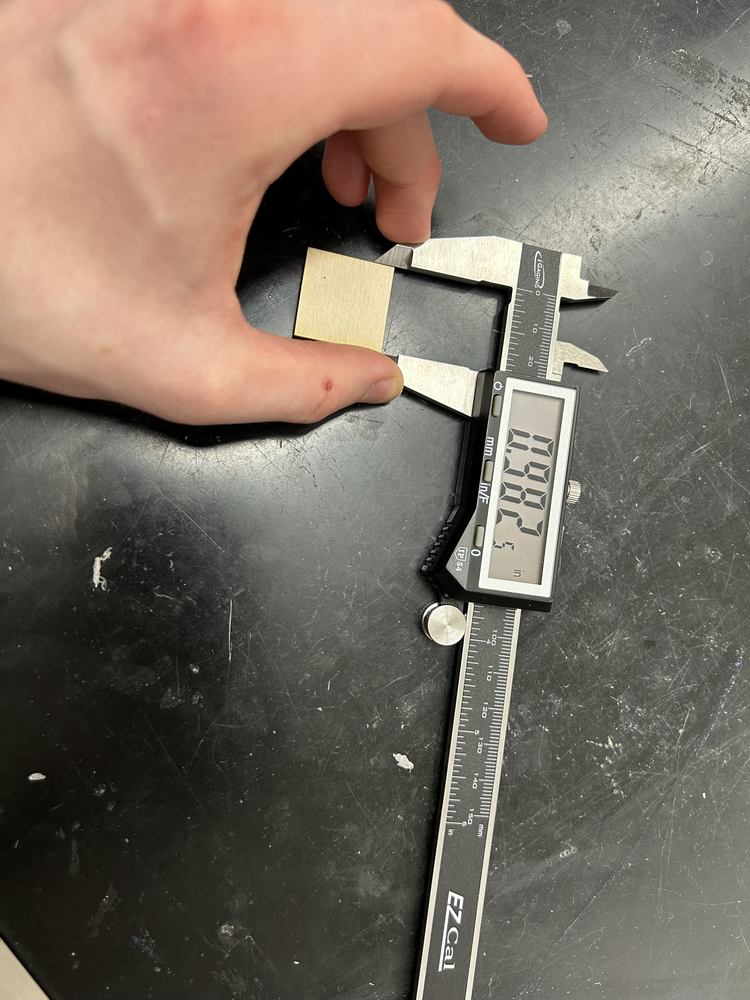
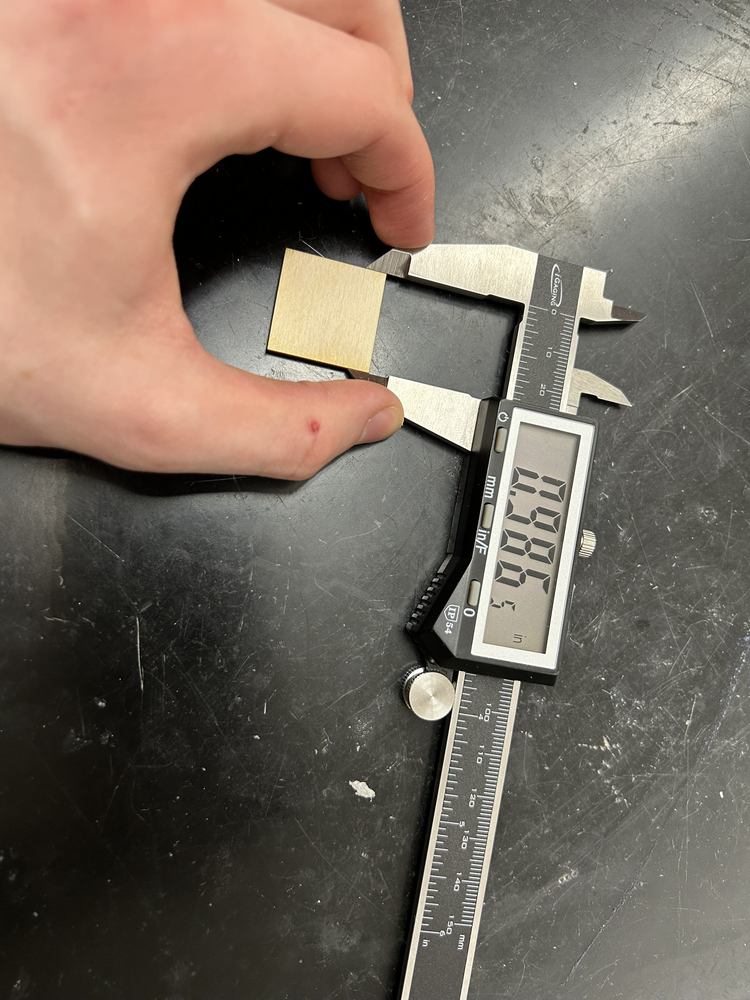
Table
| Smaller Side Length (top) | Larger Side Length (bottom) |
|---|---|
| 0.986 | 0.991 |
| 0.979 | 0.993 |
| 0.987 | 0.988 |
| 0.982 | 0.991 |
| 0.986 | 0.991 |
| Average Side Length Smaller (top) | Average Side Length Larger (bottom) |
|---|---|
| 0.984 | 0.9908 |
Average Between Sides: 0.9874
Average Kerf = 1 - Average side length = 0.0126in
Average Keft Across Materials: 0.0142in
MkDocs Troubles
I couldn’t serve MkDocs locally for the group site and got the following error.
ERROR    -  Config value 'plugins': The "git-revision-date-localized" plugin is not installed
Aborted with 1 Configuration Errors!

This website said to run this in the command prompt.
pip install mkdocs-git-revision-date-localized-plugin
Then it worked!
Accidentally Uploaded Large Images
Once, our group accidentally commited large images, but we found a solution here and used the following commands to reset our HEAD by one commit and make sure our changes were effective.
git reset --soft HEAD~1
git status
git log --graph --oneline
Then it reverted to before the large images were committed!
Group Git
To work on a group project in Git, we used the web interface to create a new branch then used the git clone command to clone the entire repo onto out local machines. Once on our local machine, we ran git branch -a to see what branch was active and what other branches existed.
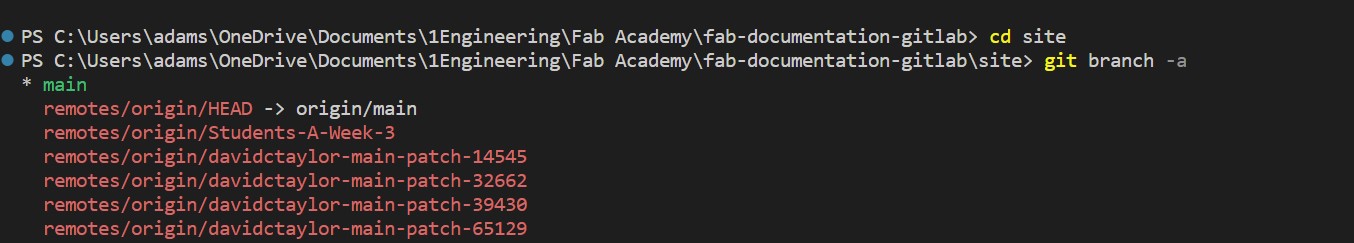
To switch to the Students-A-Week-3 branch, I used the git switch Students-A-Week-3 branch command, and the output was as follows.
* Students-A-Week-3
  main
  remotes/origin/HEAD -> origin/main
  remotes/origin/OGs-Week3
  remotes/origin/Student_Group_B_Week_3
  remotes/origin/Students-A-Week-3
  remotes/origin/davidctaylor-main-patch-14545
  remotes/origin/davidctaylor-main-patch-32662
  remotes/origin/davidctaylor-main-patch-39430
  remotes/origin/davidctaylor-main-patch-65129
  remotes/origin/davidctaylor-main-patch-77460
  remotes/origin/davidctaylor-main-patch-92755
The * next to our newly-created branch ensure we were working on the correct branch. Whenever we made changed, we used git add, git status, and git commit as normal, then when we pushed, we made sure to run git push not git push origin main to that we only pushed to the active branch.

We created a new markdown file week03a.md for our group’s documentation and a new folder in the images subdirectory to store our media.
It was also VERY IMPORTANT to make sure we always ran git pull before editing our local copy of the repo to avoid merge conflicts!!
Dithering images
This week Mr. Dubick tasked us with comparing the dithering of different dithering types on different materials. Initially Ryan and Griffin started trying to dither the Charlotte Latin logo, but it didn’t turn out, because they misunderstood what Mr. Dubick said, and rastered a clipart image and not a photo. They realized this after each item had been dithered with no difference in how they looked. After that mistake, we began dithering with an actual image. Griffin searched up a grayscaled image and we used that to dither the next images on each material. The image he found was this

The dithering process was fairly simple, all that needed to be done was select your material settings and change the dithering type each time. There were 5 types of dithering on our large epilog laser cutter, Floyd Steinberg, Jarvis, Stucki, Bayer, and Standard. The differences in the dithering process was easiest to see in the carboard, where you yould clearly see the dots.
 cardboard dithering images
The next dithering we did was the plywood. In the plywood you could tell a difference more so in the quality of the raster. We agreed that we prefered the Stucki dithering process for plywood.
 Plywood dithering images
Finally, the last material we used to dither was acrylic. None of us had ever laser cut acrylic, so it was a new process to learn. The main new thing to do was to take off part of the protective paper and change the settings again to be for acrylic. Dithering in acrylic was interesting because for the first time there was residue that was left on the surface of the material. The residue wasn’t particularly difficult to remove, but if it was left on, it affected the raster quality. The rasters are difficult to tell a difference with. There was no noticible difference bwtween each of them, but we initially though that there were just poor quality rasters, because we couldn’t see the detail particularly well. This was not the case, because as we found, you could actually shine a light in order to see the detail, which was a cool development.
 acrylic dithering images
 comparison between each image
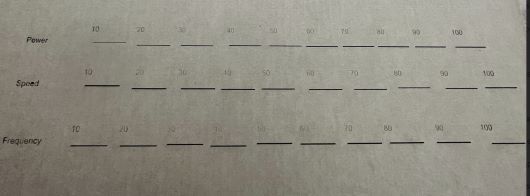
Characterizing the Laser Cutter’s Settings
Working together, we were able to characterize the Epilog Laser Cutter’s power, speed, and frequency. Power refers to the strength of the laser, the speed is how fast the laser moves as it cuts, and frequency is the rate at which the laser fires or pulses. We first planned out how to show the different types of effects the changes of the laser parameters had on the cut’s outcomes. We then decided that we would cut through many lines but do it in an organized manner so that we can show the difference the outcomes had when we changed power, speed, and frequency. We decided to have three rows of ten lines, and each row would show the change of power, speed, and frequency. Ten lines meant that we would do 10-100 in increments of 10. We would change each one off the basic settings that we could import into the cuts for ⅛ inch cardboard, which was around 40 speed 100 power and 10 frequency. From there, we edited each one 10-100.
Customizing in Corel Draw
Before we were able to do this, we had to figure out a way to import the settings for each line, since all of them were different. It would be extremely complicated if we changed the settings 30 times, changed the position of the line, and ran the laser 30 times, so we had the idea to change the color for each line. The epilog job manager is well created in which you can sort different settings depending on the properties of something that it is about to cut or engrave. For example, the numbers that show the increments as well as the words power, speed, and frequency were all set to black as well as 0.24 pt. In the job manager, we could set all of the black 0.24 pt marks to engrave, where all we had to do was import the material settings for engraving ⅛ inch cardboard. For the lines, we had to set it as different colors 30 times. In order to have this well organized, we decided to use the RGB color system, where we set the power as red, speed as green, and frequency as blue. Once we had the 30 lines in Corel Draw, we manually clicked each one and navigated to object properties, where we could change the value for RGB. We did so in an organized fashion where we set one color as the amount of speed, power, and frequency it had. For example, for the first line in the first row, that would be 10 percent power. Since we designated power as red, we navigated to its color property and set it as 10 red, 0 green, 0 blue. The next one was 20 red, 0 green 0 blue. For 50 percent speed, it would be 0 red, 50 green, 0 blue. This was so that when we saw all the different colors in the epilog job manager, we would know what to manually set the settings as. For example, when we saw the color of R0 G0 B80, we knew to change the frequency of that line to 80%, since we had designated blue as frequency in the beginning. Once we had the color settings set in CorelDraw, we imported it to the job manager, and we imported the cardboard cut settings and changed power, speed, and frequency for each one depending on its RGB value.
 screen that allowed for focus, movement, and print job
Setting RGB (issues)
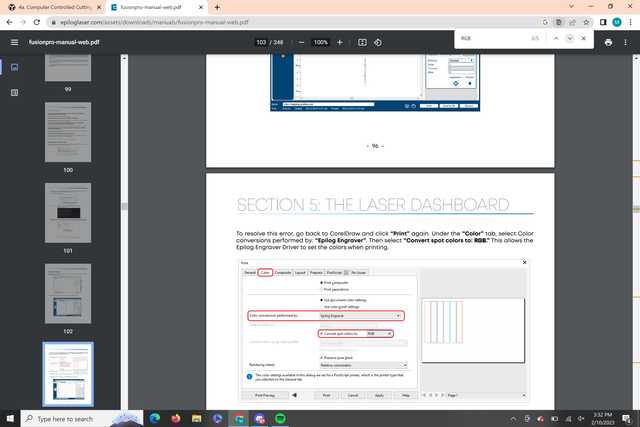
One problem we ran into was when we first tried to import the file, the set RGB colors were not the same as we set it. After a bit of research, Merritt figured out that when changing the color properties in Corel Draw, we must also change the color model to RGB. We did not know this, and so it was set as CMYK at first. On this color model, the red, green, and blue that we set would be different. All we had to do was change this setting to RGB, and import it again.
Here’s what that fix looks like in the Eplilog Fusion Manual.
Quick timelapse of the cut

Here is the final product, as well as the back view to see which lines cut through and which ones didn’t.
This is the front side of the product, with ten lines in 3 rows for power, speed, and frequency
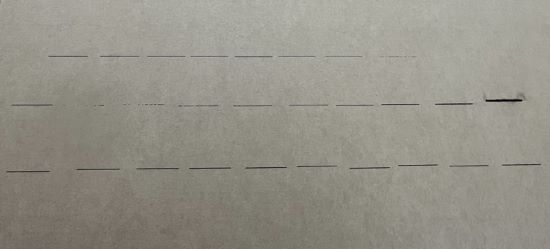 This is the back side to show that settings effect the amount that cuts through
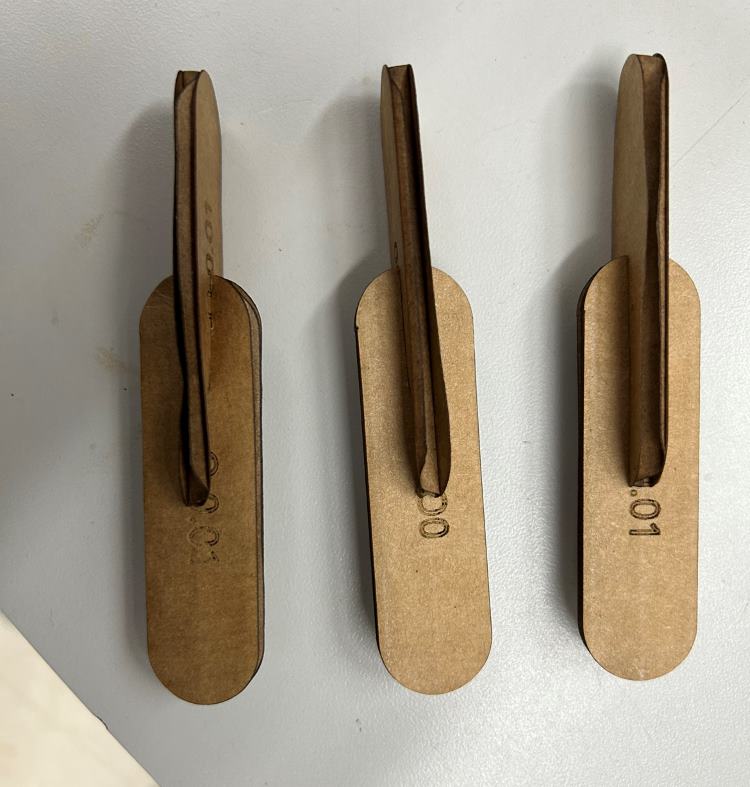
Testing Joint Clearance
Our group used Adam Stone’s design in Cuttle as a base for testing joint clearance. We changed the parameter for offset from thickness of material for slots in two pieces, set them to different values (-0.01in offset from material thickness, 0.00in, and 0.01in), and laser cut them all. In the end, we found that the 0.01in smaller offset was barely usable, the 0in offset worked the best for making a push-fit joint that will not come out easily, and the 0.01in larger offset worked the best for putting things together than can easily be taken apart again.
Here is the final Cuttle design we used for testing.