Week 4 Students B
Project members: Dariyah Strachan, David Tian, Dylan Ferro, Ginny Foster, and Stuart Christhilf
For this group project, we are to:
- Characterize the laser cutter using power, speed, and frequency to raster and vector an array that we created.
- Dithering (try out the different types of dithering for both clip art and photos in CorelDraw)
-
Set up this website.
-
Dylan did dithering.
- David, Stuart, Ginny, and Dariyah characterized the laser cutter.
- David setup the website.
Setting up the website
Setting up the site didn’t take too long.
I went to the student template posted by Dr. David Taylor on the slideshow that he showed before Fab Academy. I cloned it using the HTTPS key to Visual Studio code and stored it locally on my computer.
I went to the web IDE of the Latin group website and created a new branch.
I then used
git remote set-url origin <branch name>
to set the repository to push to that new branch.
The setup is complete.
It is important to note that you must Git pull every time before you git push something because otherwise, we could overwrite and accidentally delete other people’s work.
Characterizing the laser cutter
Medium Laser cutter (failed)
We started by discussing how to best test all of the features we needed to. We decided that we would use an array to test the relationship between speed and power, and test frequency and focus independently. We also decided to test the kerf by cutting three different squares and finding the average difference between the intended size and the actual size. Because one member of the group, Dylan, was not present when making these decisions, we decided to task him with handling the dithering.
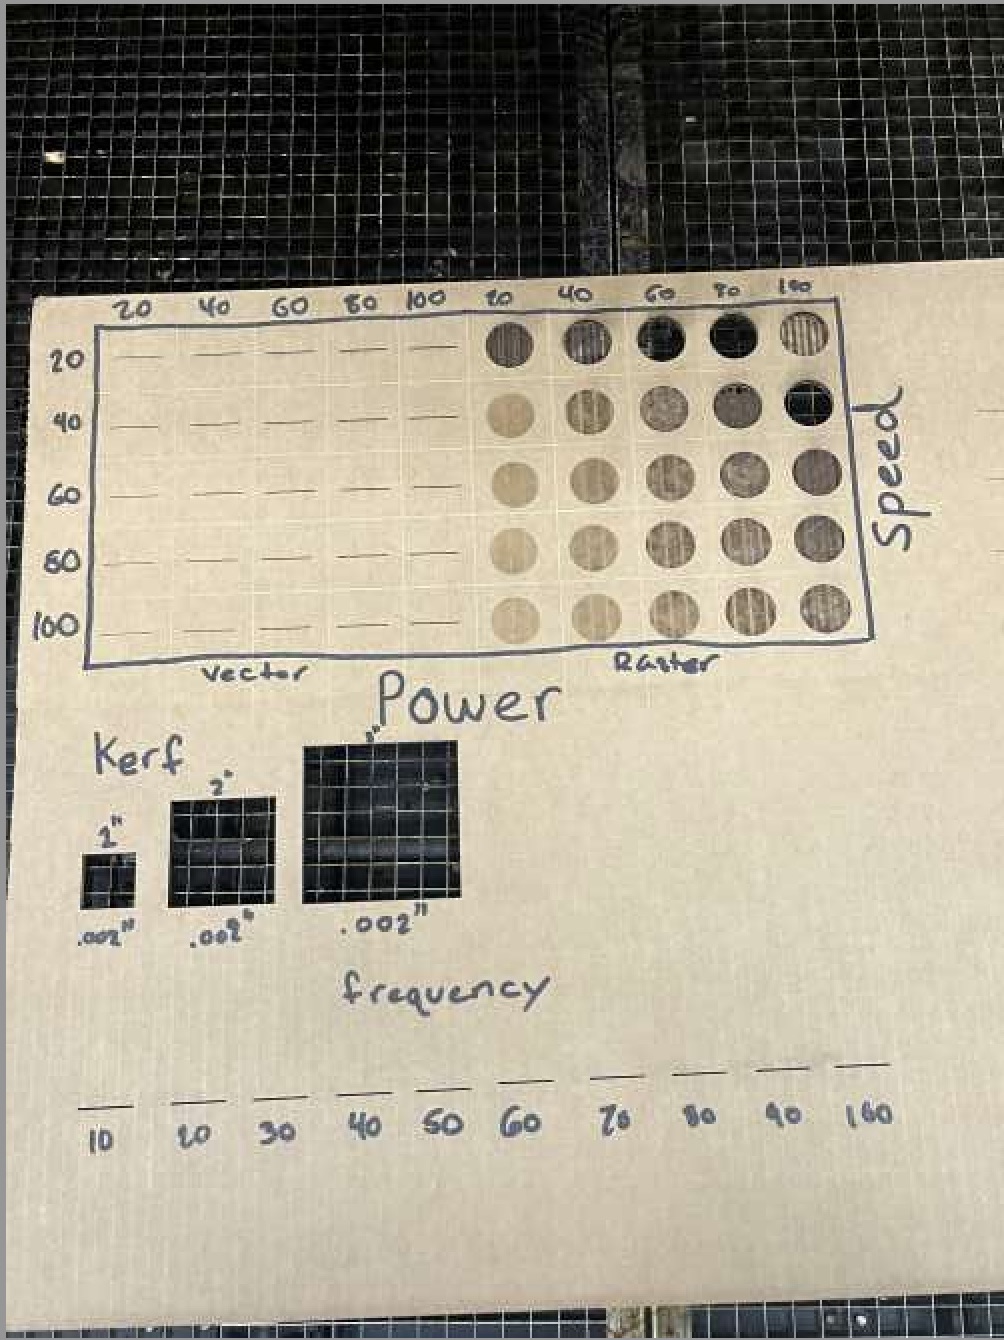
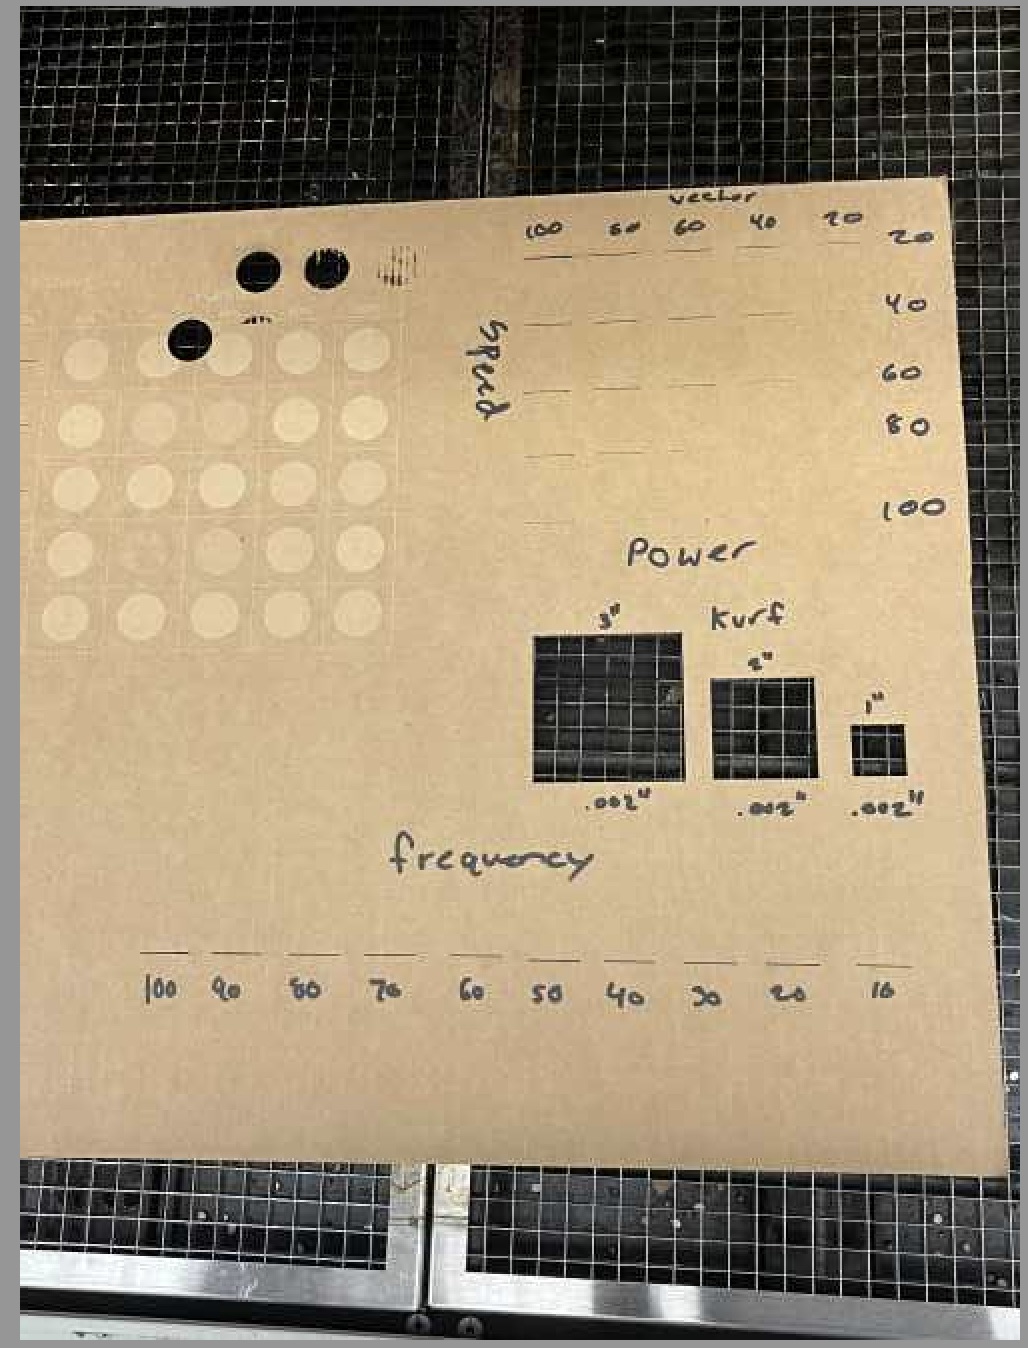
To get started with the speed and power testing Ginny made a matrix in CorelDraw. To make the matrix she first drew the x and y axes using the line tool on the left side of the CorelDraw. Then she drew the middle dividing line to separate the raster side from the vector side. Next, she used the line tool to draw the grid lines of the matrix. To characterize the laser, our group decided to go up 20% for each increment of the array, so Ginny used the text tool on the left side of CorelDraw to label each row and column. She also labeled the top and side of the graph and the vector and raster sides. After creating the grid, Ginny added the horizontal lines for the vector side and the 1 inch diameter circles for the raster side. With the grid complete, she made all of the lines on the vector side hairline and made sure everything else was set to 0.5 so it would raster. From there she exported the file and uploaded it to Google Drive. You can download the file made for this laser cutter below as well as the version used for the larger laser cutter that also has the kerf and frequency.
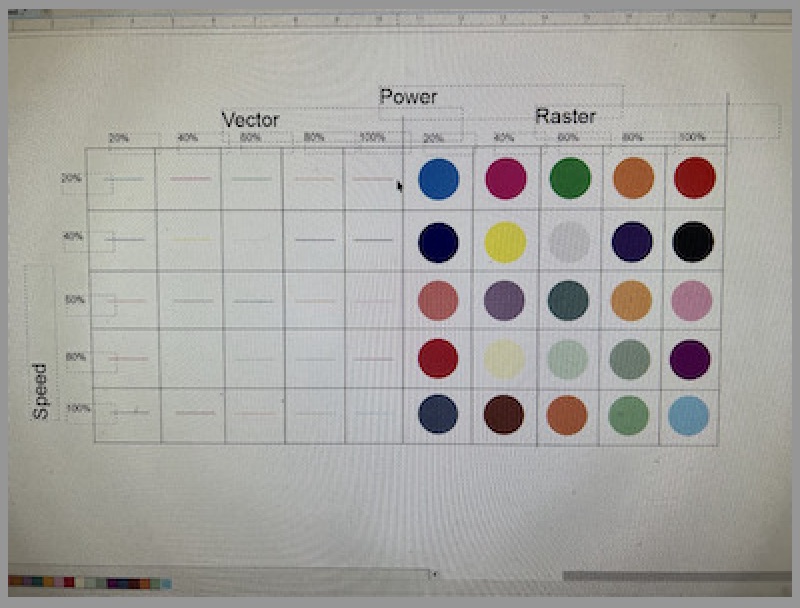
Notice that in the array, the power increases by 20% for every increment, and the speed decreases by 20% every increment. We have both vector and raster, so the laser is going to do a combination of both functions.
The process itself for building this was complicated. We used color mapping, inspired by previous Fab Academy student Andrew Jiang and Alaric Pan.
By making each circle and line a different color (each circle and line in the corresponding square must be the same color), we can use color mapping to create the array.
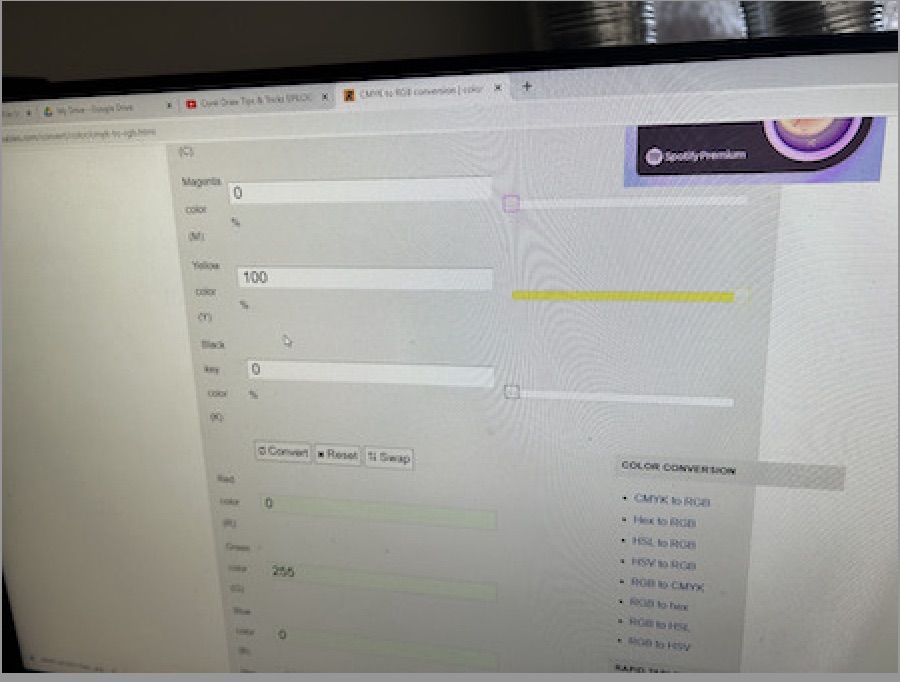
To begin doing this, Stuart and David began dragging colors from the right side of CorelDraw onto each corresponding line and circle. When all of the circles and lines that corresponded were colored accordingly, Stuart hit print and in the print interface. We opened up the color mapping option, and found that only six colors were in there, and they were not the colors in our file. Confused, we tried a few different things before realizing that the plus icon to the right of the color selection interface allows you to enter your own colors. So Stuart wrote down all of the color CMYKL codes from the file in an Excel file set up like the color grid. However, we had to convert the CMYK codes to RGB because the printer setting only allowed for RGB values. Then, Dariyah, Ginny, and Stuart began the tedious process of reading off the CMYK color codes, typing them into a CMYK to RGB color code converter, and then re-typing the RGB color codes back into the Excel file below the CMYK colors.
This took a while. Next, we set up the laser cutter.
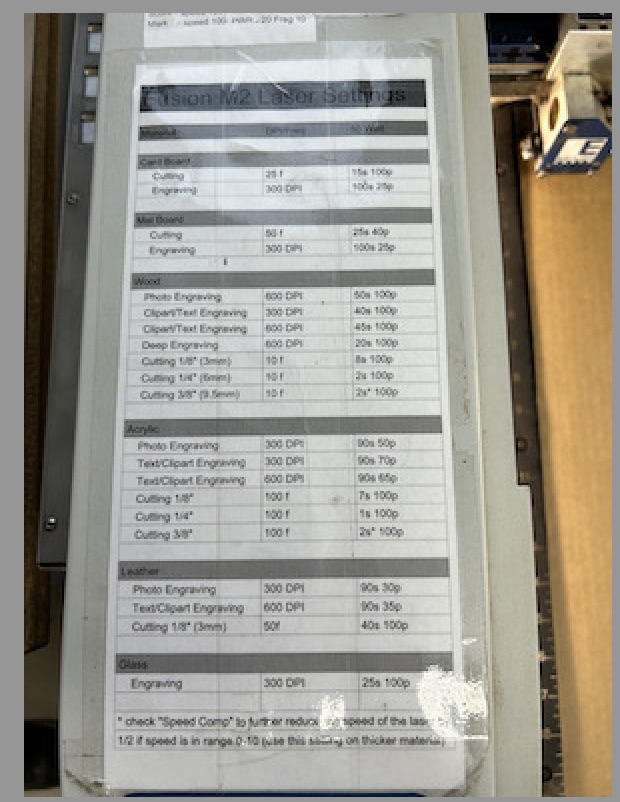
For all the words and lines written in black, they are to be rastered using the default settings, which are taped next to the laser cutter:
 So, we adjusted the settings in the preferences tab of the laser cutter:
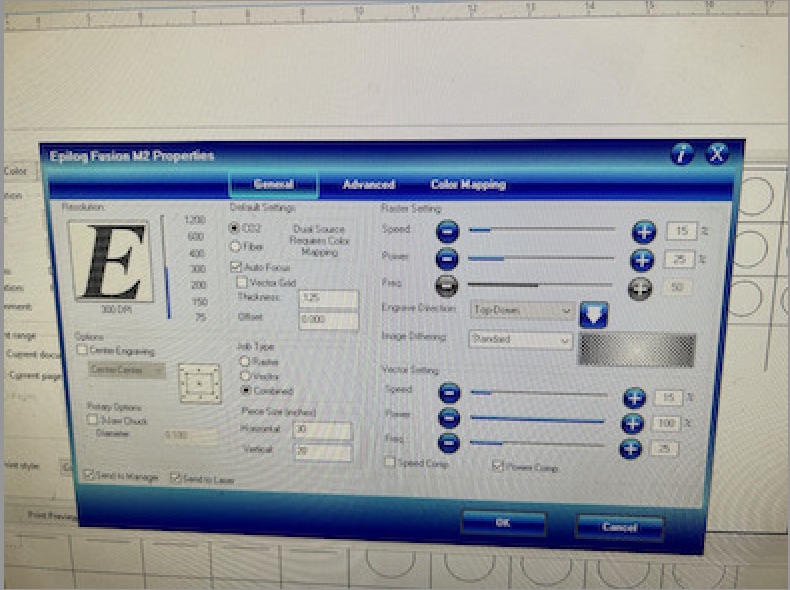
Then, it is time to add all the colors using this interface:
However, we could only add 15 colors at one time, so we decided to only raster/vector the first 3 rows:
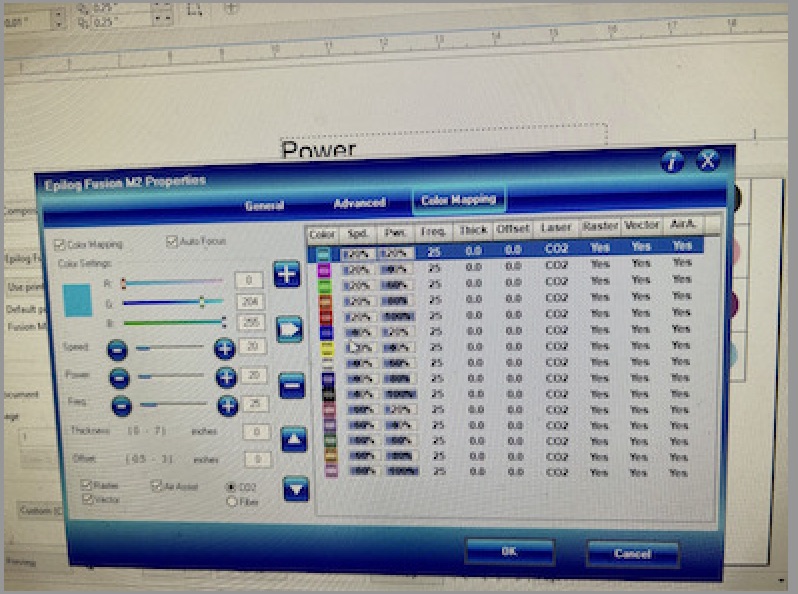
Note that the only settings we changed are power and speed. The frequency setting was the same the entire time (control variable) for rastering.
Doing all of this was very tedious. When we ran the laser cutter however, we didn’t perceive a change in the speed and power settings.
Our best guess for the reason it didn’t work was probably because we didn’t actually save the settings. That, or the laser cutter didn’t recognize the changed settings.
Later, Mr. Dubick told us that we could have mapped the RGB values in CorelDraw directly onto the laser cutter and make it work.
We decided to search the problem up on Google. As this article says, we could have set the default value for the laser cutter to be RGB, and not CMYK. This could have saved us a lot of work and trouble of converting between the formats. We could also have used the 6 basic color formats already provided by the laser settings.
As the medium laser cutter was giving us trouble, we decided to move to the large laser cutter to do this part of the project.
Something that we could have done:
Taking inspiration from last years’ students, we could have corresponded the (power, speed, frequency) values with our RGB values for the colors. For example, if we have power = 20%, speed = 60%, and frequency (normal), then for the RBG values we would have R = 20, G = 60, and put a constant value for B.
This could definitely have made our work much easier to read.
Kerf
As a side note, kerf is the amount of material that is blasted away by the laser cutter.
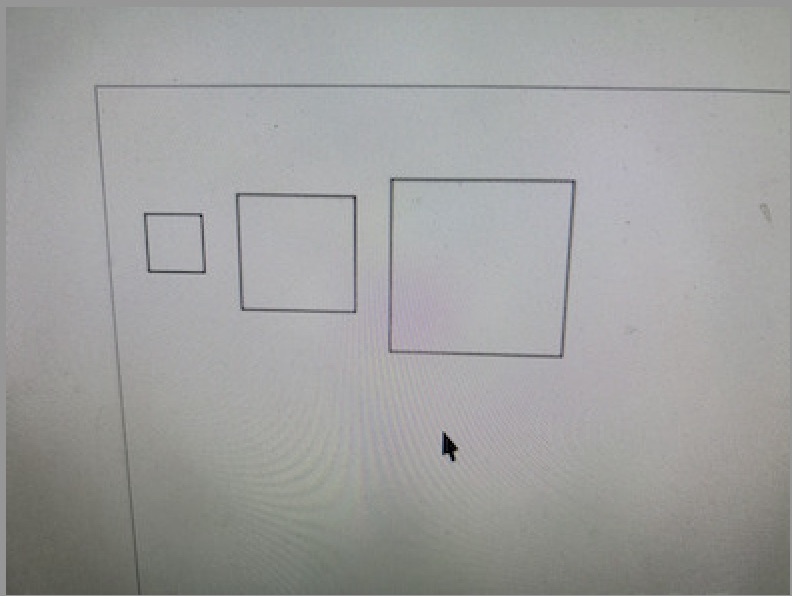
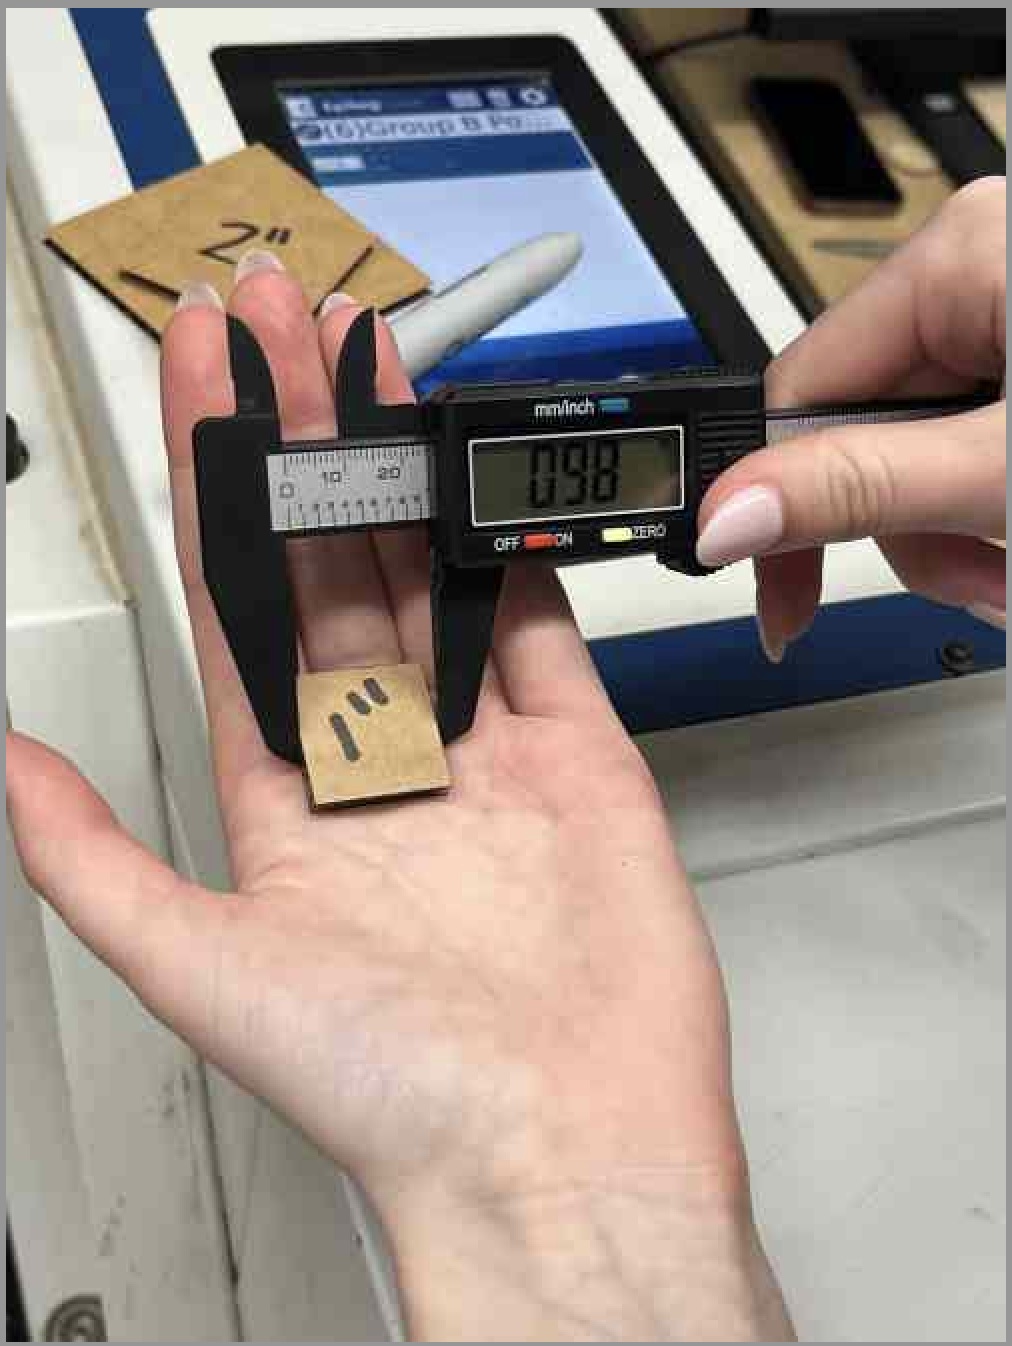
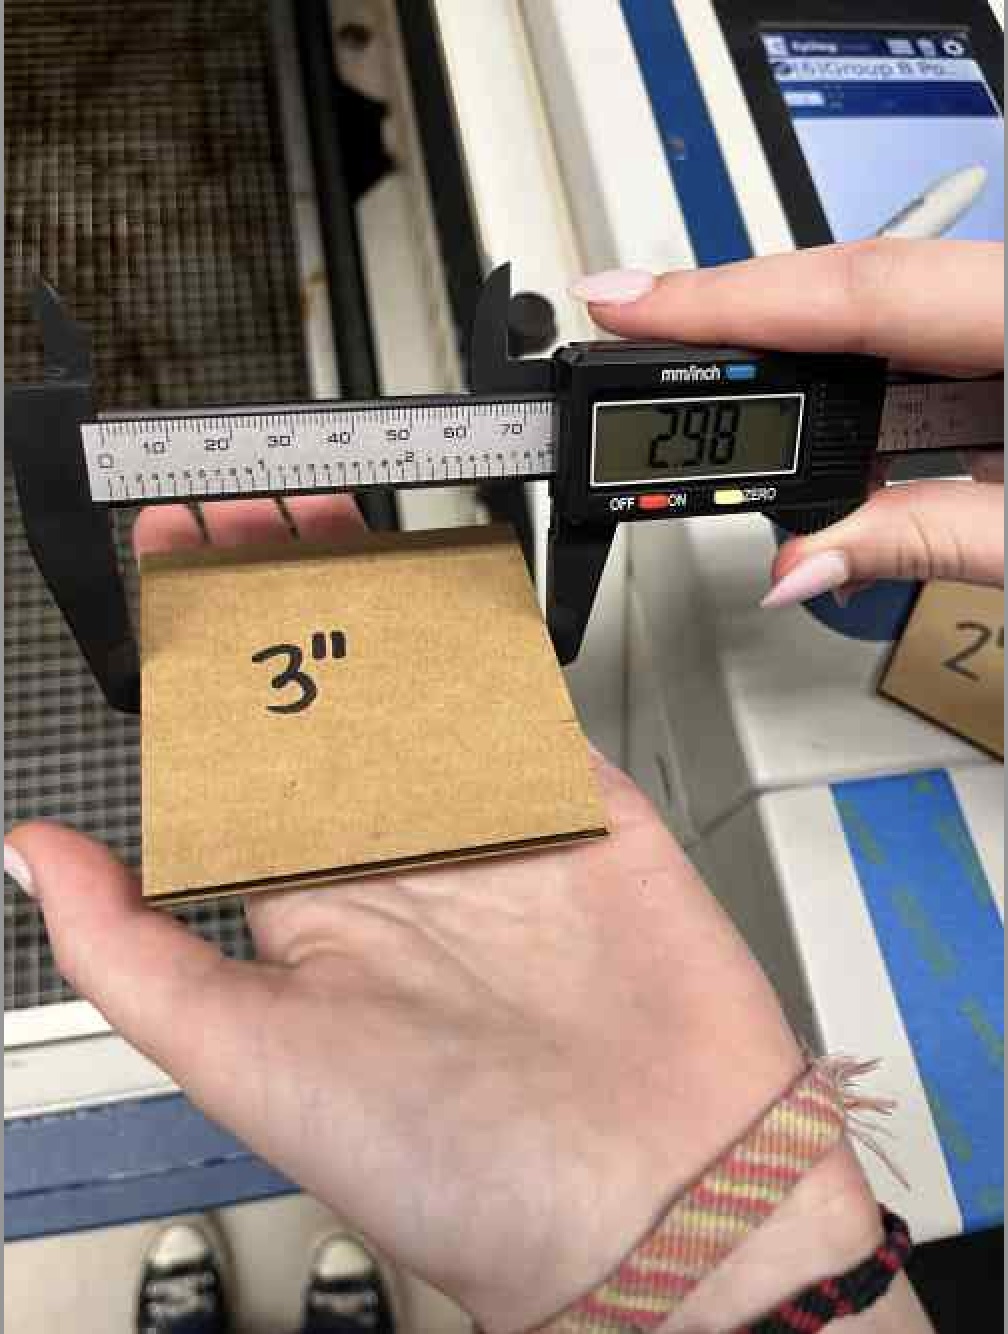
So we cut out 3 squares, a 1 by 1 inch square, 2 by 2, and a 3 by 3. They are all cut out on cardboard. Then, we measure the amount actual side lengths of the cut out pieces.
The squares were designed in CorelDraw:
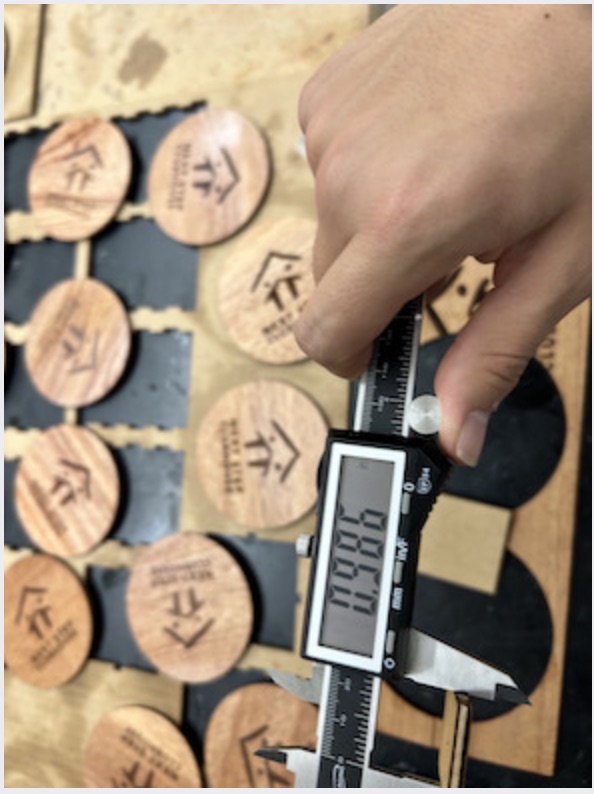
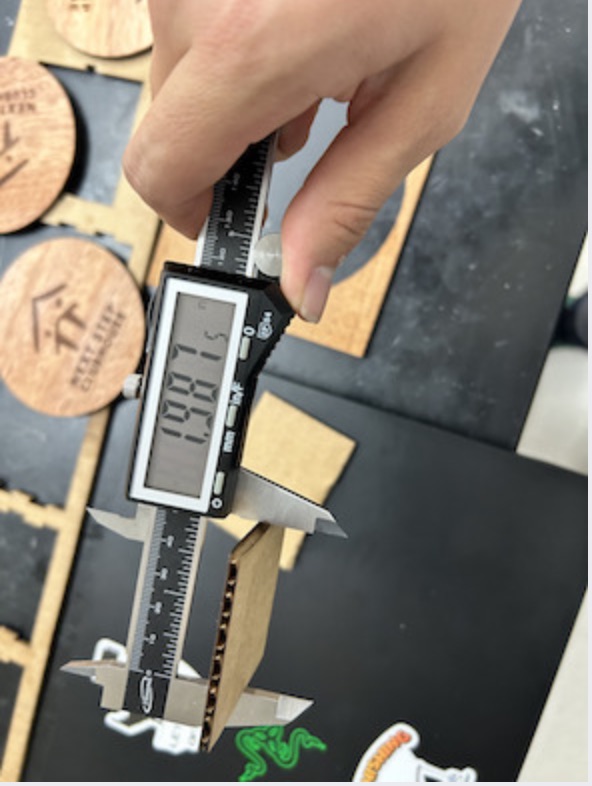
We also measured both widths of each square using calipers:
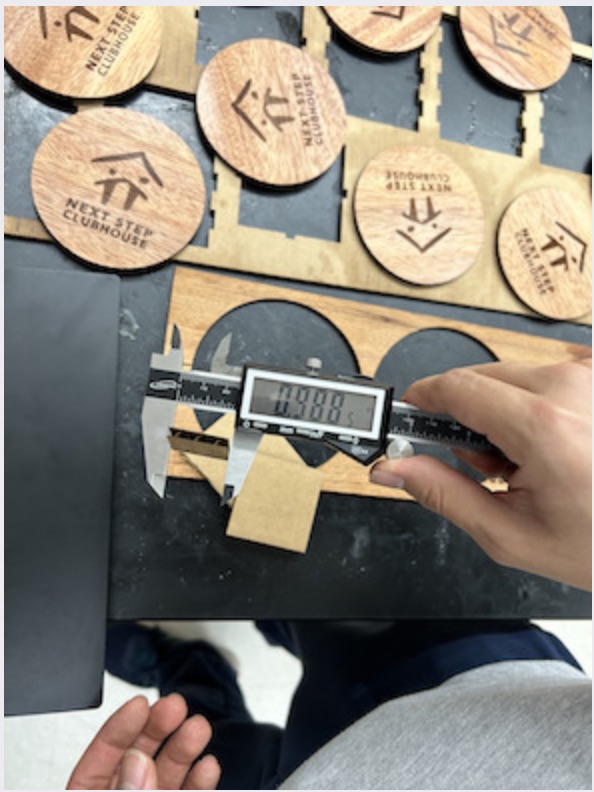
The kerf here is: 0.00575 in.
Kerf = 0.007 in
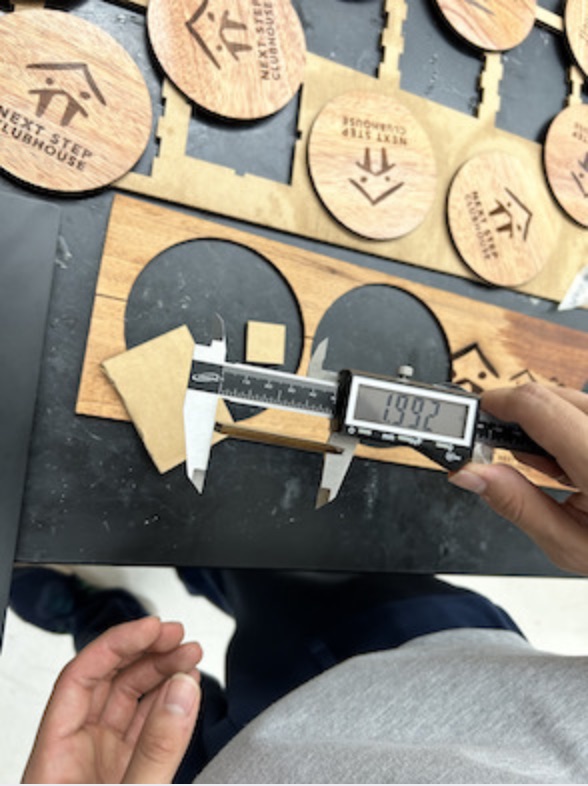
Kerf = 0.004 in
 Kerf = 0.0065 in
INPUT THE 3 by 3
So the average kerf for the 1 in square is 0.006375 inch, and the 2 in square is 0.00525 inch.
So, the average kerf for both squares are very similar, and the fact that it is very small shows how accurate the laser is. Wikipedia says that the optimal kerf is 0.004 inches.
Large laser cutter (successful)
We started the big laser cutting characterization by downloading the CorelDraw File that Ginny Foster made.
Using it we colored all the circles 1 value apart from each other and went into the settings and customized every every setting for each color. We changed the power speed and frequency so that the laser would use the settings listed in the grid when it was supposed too.
The advantage of this laser cutter is that it is more advanced. So, it can easily recognize the different colors in the CorelDRAW file and provide the user with different tabs for each color. Then, the user can customize the different colors in terms of frequency power, and speed. This is an automated version of color mapping.
Kerf for the large laser cutter
Once we were done with the main grid comparing speed and power we moved on to Kerf. we made 3 squares 1”, 2”, and 3” respectively and cut them under our grid.
After cutting them we measured them with calipers and figured out that the kerf for our big laser cutter is .02 inches.
Here is the back of our board where we did frequency. Technically we did in on the other side of the board but it is easier to see the effect of changing the frequency from this side. To do this test we just made 10 straight hairline lines and upped the frequency by 10 for every one by using color mapping and then splitting them by color in the Epilog printer settings interface. From left to right we made the value rise and you can see that as the frequency goes up so does the width and darkness of the cut.
Joint Clearance
For the joint clearance we created six squares with slots that had 3 different widths. The first set of squares had slots with a width of .125in, the material thickness while the second and third sets were made to be .025in wider and smaller than the material thickness. We found that the slots that were made to be the same thickness as the material has a noticeably better fit than the slots that were bigger or smaller than the material thickness. The sot that was too big had a loose fit and the pieces easily fell apart, however the sots that were too small did not fit together correctly. In conclusion the when connecting two materials at a joint, the material’s thickness is the best option to insure that the pieces fit together snuggly.
![]() 0.025in smaller than material thickness
0.025in smaller than material thickness
![]()
Equal to material thickness
![]()
0.025in bigger than material thickness
Focus Test
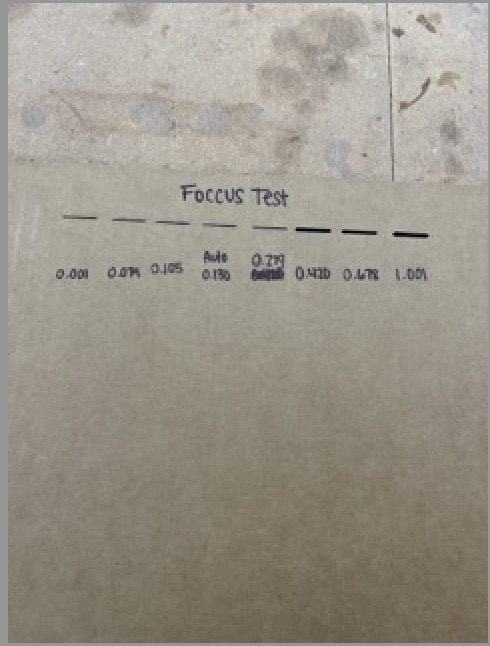
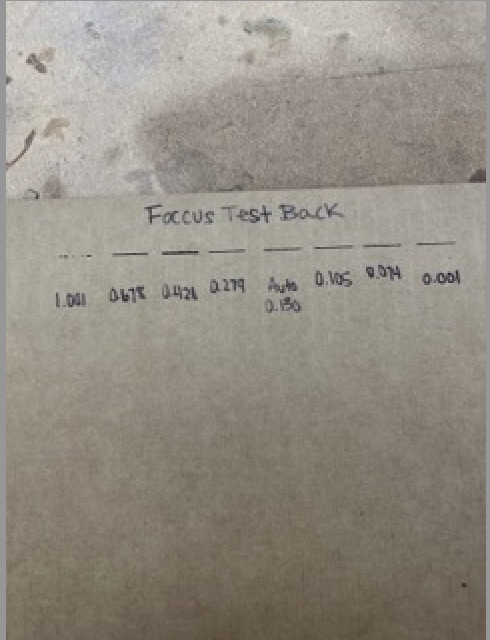
To test the affect the laser’s focus has on cuts we made a file with a series of different colored lines that we vectored onto a piece of cardboard. we started in the middle with the laser’s auto focus and as we moved further to the right we increased the distance between the laser and the material. Moving from the left of the auto focus line we brought the laser closer to the material. What we found out was that the closer to the material the laser was, the thinner the lines was. The farther the laser was from the material, the wider the lines were. There were also more burn marks the farther away the laser was from the material.
Results:
Dithering
Dithering an image on a laser cutter is a great way to add an different effects to the design.
All that needed to be done to dither was import your file of choice, choose material type of engraving, and change dithering type on the bottom, it is usually set to standard. There are 5 dithering settings on the epilog fusion pro, Standard, Floyd Steinberg, Stucki, Bayer, and Jarvis. I used standard for clip art, and the rest for my images. The dithering came out best on the cardboard, where you could tell the difference between the pictures.
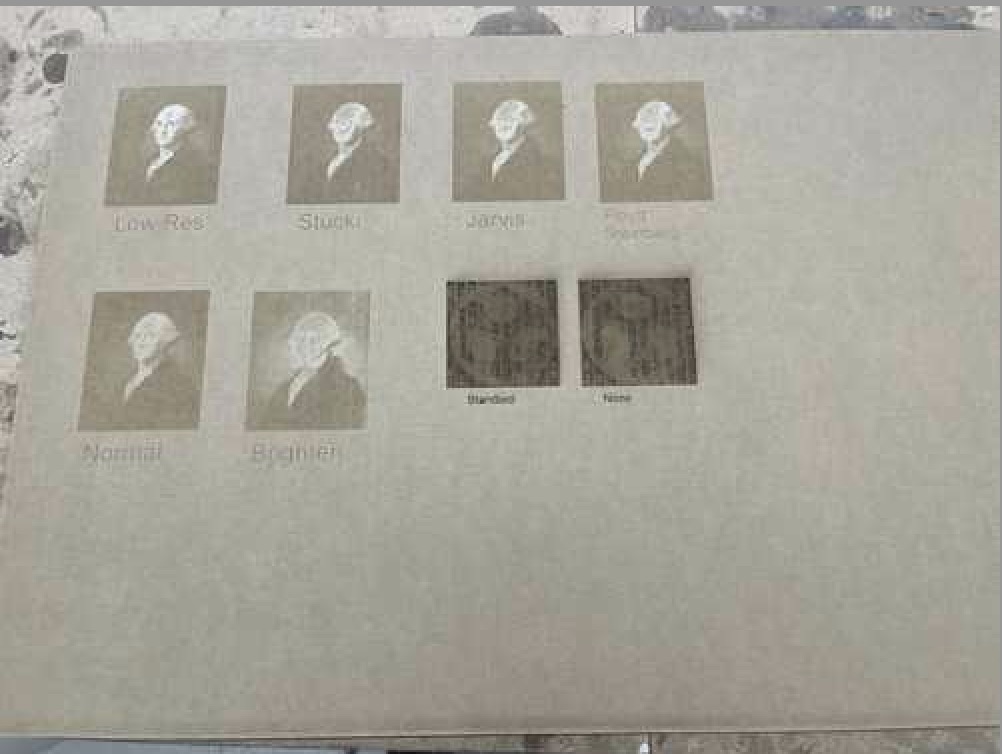 Cardboard
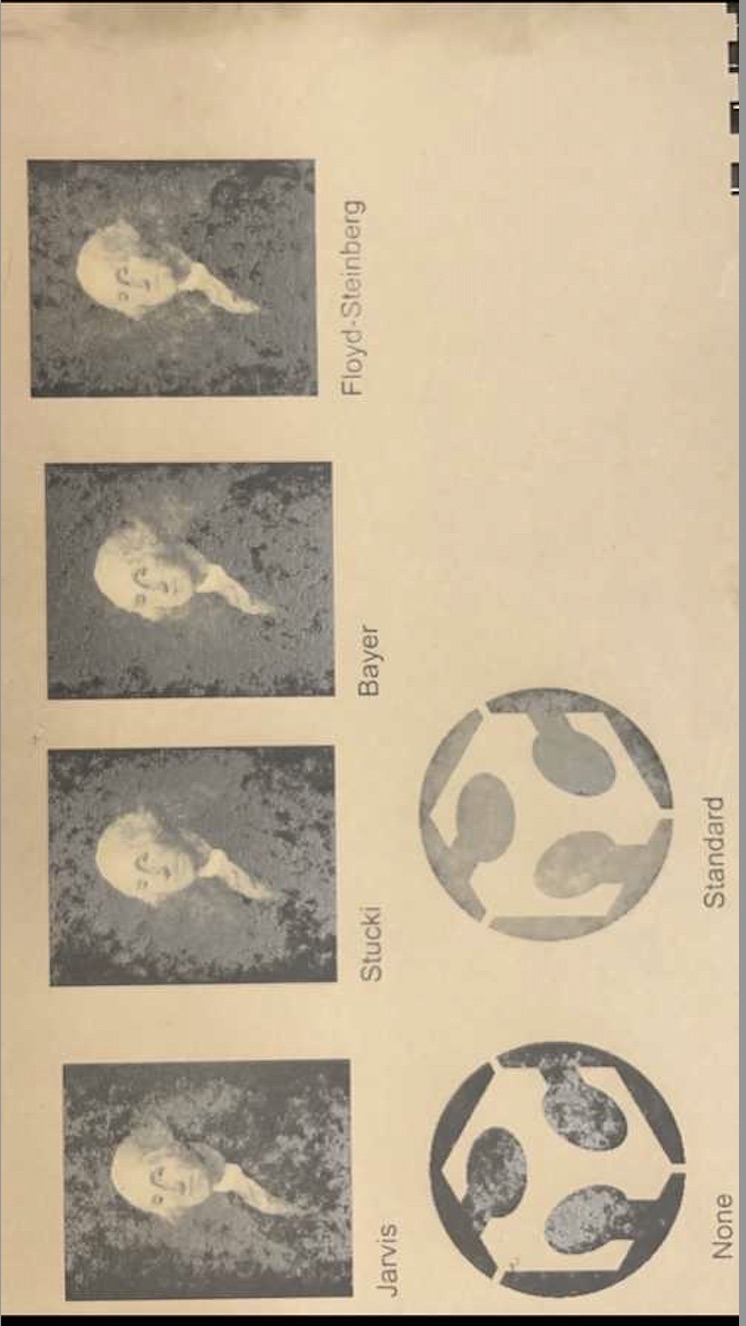
Acrylic
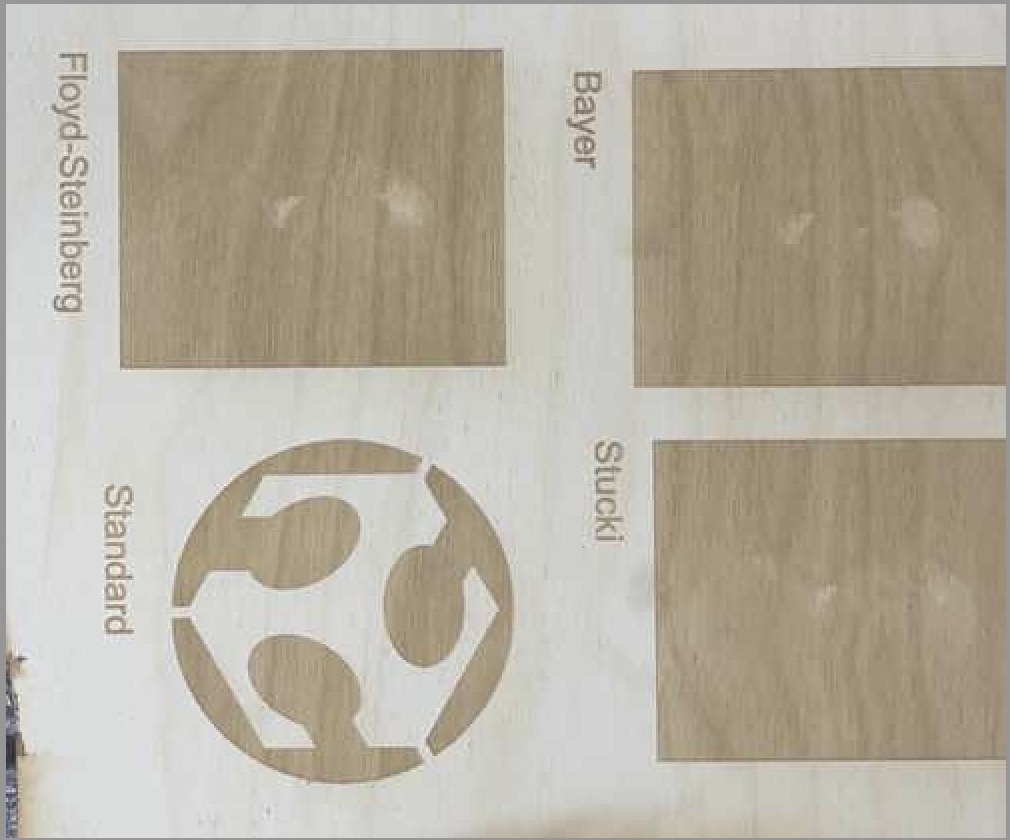
Plywood
Website Trouble
When David set up the website, he cloned the template made by Dr. Taylor and created a new branch called:
Student_Group_B_Week_3
However, in order to let the other members of the group have access to the file, we all used the:
git remote set-url origin <branch name>
command to set the URL.
However, this made the setup process a bit more complicated than it really needed to be.
Also, some members of our group’s local site mkdocs serve and git push failed.
Then, we realized that we didn’t have to set the remote url at all, and that all we had to do was to clone the repository from the branch David created, and then use:
git switch <branch name>
to switch to the correct branch.
We also moved our documentation file outside of a redundant folder and placed it directly under the assignments folder (renaming it to week04b.md). We also recovered the week01.md file that was accidentally deleted. We did this by downloading it from the template and going back to the VS code folder.
Then, everyone tried to serve the repository on the local website, and it worked.
Now, we are able to collaborate on it as it should be.