4a. Computer Controlled Cutting (Students)
75 Watt Laser
Nick’s Work
I was partnered with Aaron and our goal as a smaller group was to use the 75 Watt laser to test and characterize kerf, joint clearence, and focus. We spent a lot of time researching for solutions, looking at past Fab years documentation, watched Neil’s lecutre, but ultimately we ended up desigining our own solutions through experimentation and testing.
Personally, I worked on the inserting material, measuring kerf from the cut pieces, and designing (parametrically) the joints we used to test for joint clearence.
Note that our idea of measuring kerf came from our group member Jack Donnelly, who’s documentation is above.
Parametric Designs in Fusion
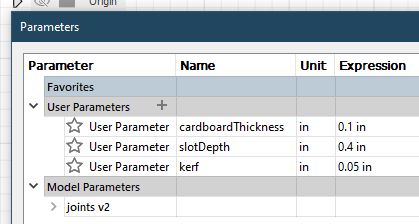
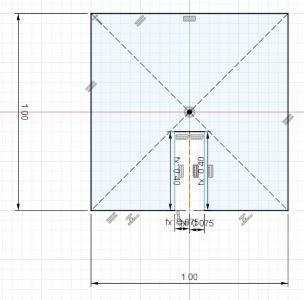
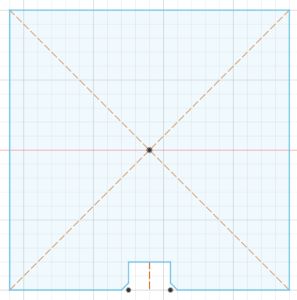
I started by creating a similar design to my parametric construction pieces.
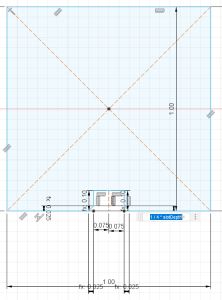
I also set up parameters to use for the dimensions.
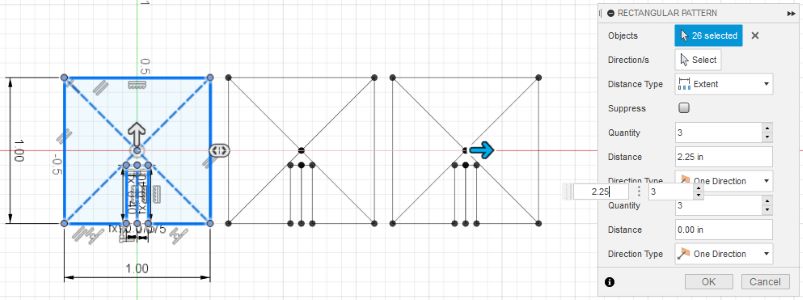
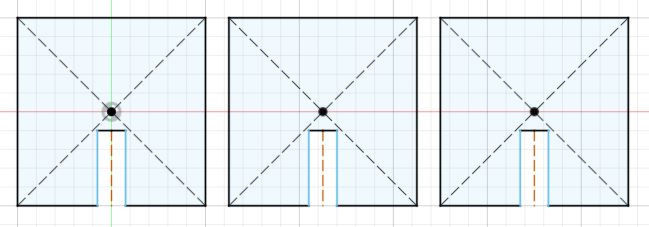
Then I patterned my sketches for the 2 seperate joints and added an extra in case I wanted to do a third joint.
Finally I created a chamfer joint.
Measuring Kerf Pieces
For kerf, I measured it. We used as I mentioned Jack Donnelly’s idea of measuring kerf which is shown in his section and we did so with wood on the 50W. The images below show a constant kerf value for each of the three sizes we cut to measure:
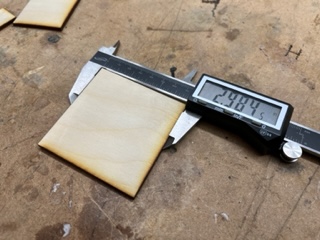
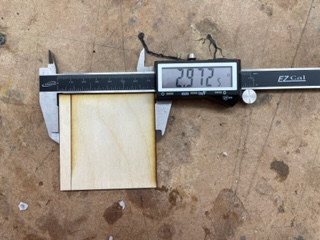
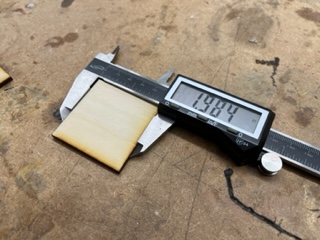
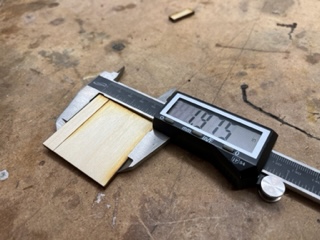
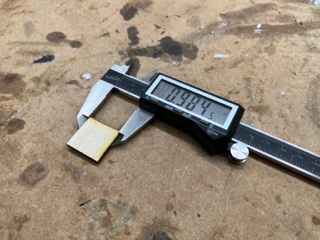
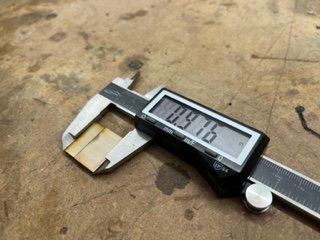
Looking at these pictures. The original values for the squares on Corel Draw were 3x3 2x2 and 1x1 inches. The claiper measured the first cut square, with a difference of 0.016 inches. Nick then cut the squares a second time to measure what the laser cut off. He recived dimentions that were 0.012 or extremely close to it inches from the first cut square for all 3 newly cut squares. This means that the laser kerf is 0.012 inches.
Measuring Focus Aaron
I partnered with Nick on characterizing our Laser cutters kerf, joint clearance, and focus. I worked on characterizing the focus.
I started by loading up a batman SVG into Corel Draw. ![]()
I copied this SVG multiple times for different levels of focus. I put a label under each logo for what the focus level would be starting at 0.000 and moving up in intervals of 0.300. I would set the laser to raster cardboard but wouldn’t auto focus. I manually moved the focus to 0.000 then have the printer only cut that logo. To cut another one I would move the bed level then delete every logo except for the one with the focus level. I repeated this step until the cardboard was clearly burned. The first half of the cuts were testing what happened if we increased focus (or decrease the bed level). I tried to do the same process but would decrease the focus (or increase the bed level) this was only able to engrave once before the cardboard was touching the laser tip. The -0.300 focus I believe I made a mistake because the laser rastering that with the context of the other focus levels doesn’t make sense.

According to the results, as the focus increased the level of engraving would increase, this could only be the case for cardboard. The file is here
Alaric & Andrew
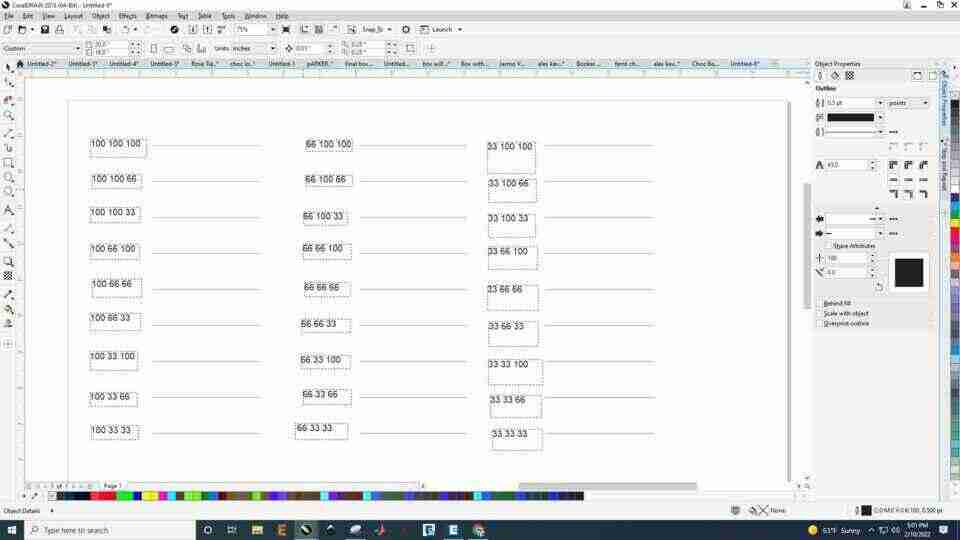
Alaric and Andrew characterized the speed, power, and frequency of the laser cutter. Speed refers to how fast the laser moves across, power refers to the intensity of the laser, and frequency refers to the rate at which the laser pulses. To start, Alaric thought of the idea to use color mapping to have all the cuts of different settings on a single file. They then collectively decided to do all possible configurations of the 3 settings in increments of 25%. However, when they went to design it, Alaric realized that that would take 64 different lines, which they decided would be unreasonable, so they changed to increments of 33%. Andrew then came up with the idea to raster the speed, power, and frequency settings of each line next to the line to know which line had what settings after the cut. He also came up with the idea to have the speed, power, and frequency values of each line correspond to the line’s rgb values for color mapping. This would make inputting the settings when sending the cut much easier as they would just have to line up the cut settings with the rgb values.
Below is a screenshot of the cut file:
Below is a video of the cut. In the video Alaric mentions concerns about the material in the laser cutter not actually being cardboard since the rastering looked like it was cutting through. After the cut, however, they realized that it was indeed cardboard since the rastering only went through the thin first layer of the cardboard and did not actually cut through.
The following images are the results of the cut front and back:
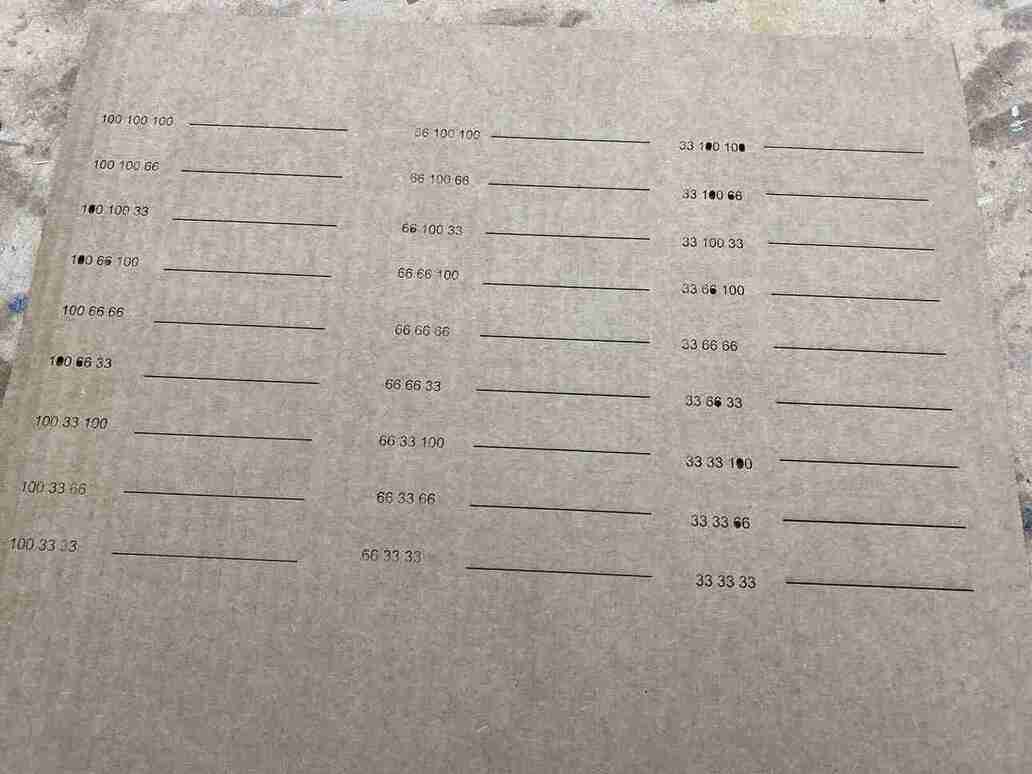
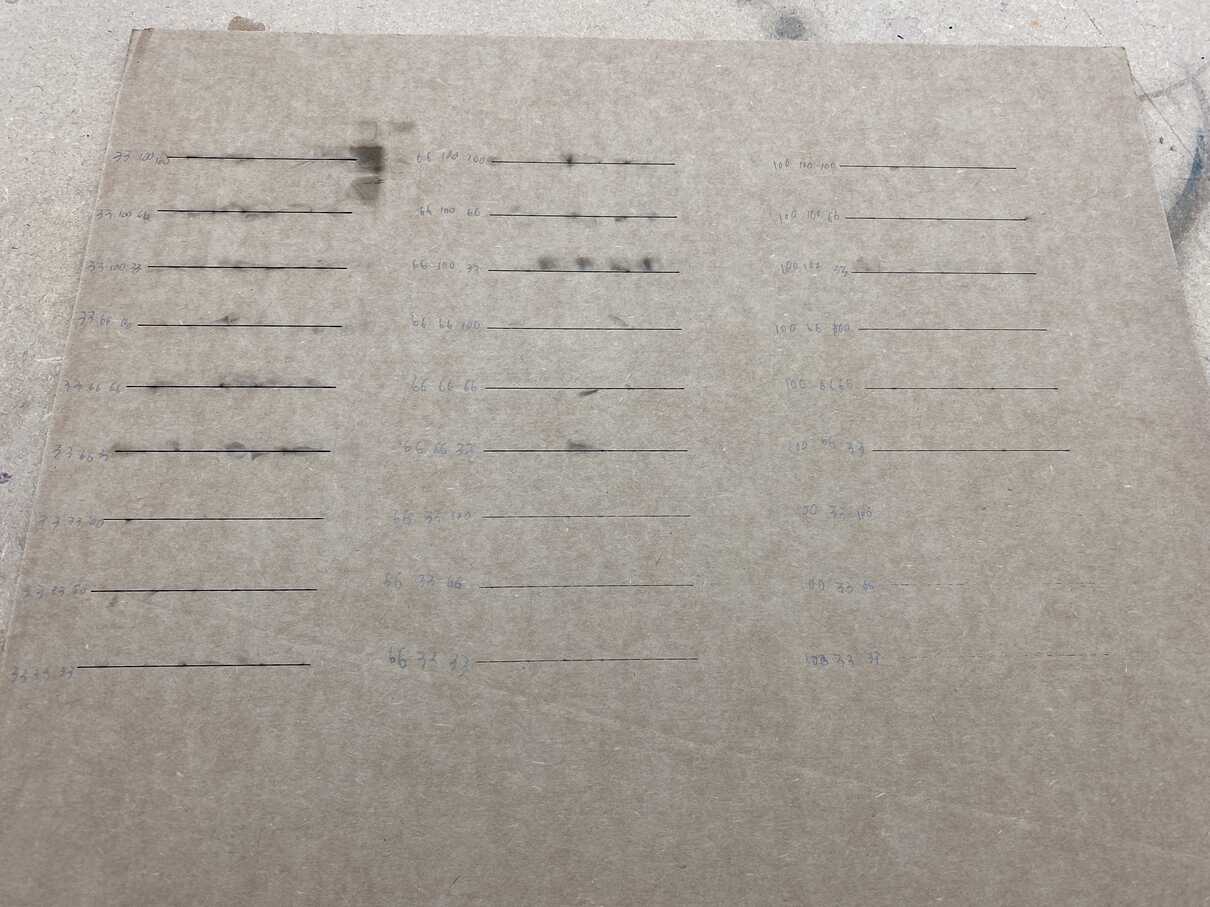
As you can see the lines with the settings in the order (speed, power, frequency), (100, 33, 100), (100, 33, 66), and (100, 33, 33), did not cut through. The optimal cut settings would maximize speed while minimizing power and frequency to make the cut fast while conserving energy and have less strain on the laser cutter. Alaric and Andrew determined that for most cuts the optimal settings would be (100, 66, 33) in the order of (speed, power, frequency). Cuts that need extremely high quality/precision, however, can use (100, 66, 100) since there are slight imperfections in the cuts with 33 or 66 frequency.
30 Watt Laser
Test:
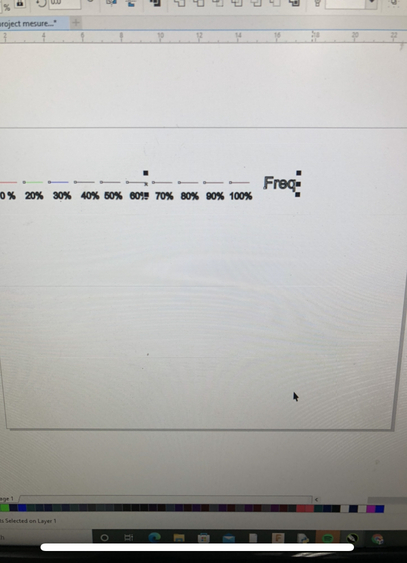
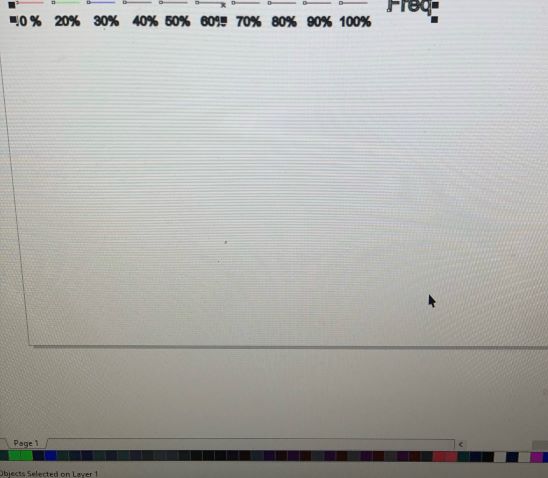
Jack and Jada tested how speed, power, frequency, and focus would effect how the 30 and 50 watt lasers performed. For the first part of this assignment they needed to create the file that would be cut. This was done by creating 3 rows of 10 small lines in corell draw. Each row was used to test either speed, power, or frequency. This would be done increments of 10%. After setting up the lines, they decided that they should color map the lines with each one being a diffrent color. This way they could have everything cut at once insted of having to change the values after every single line. After color mapping, they added percent values corosponding with the lines that would be engraved on the final peice of cardboard. Here is a photo of the file.
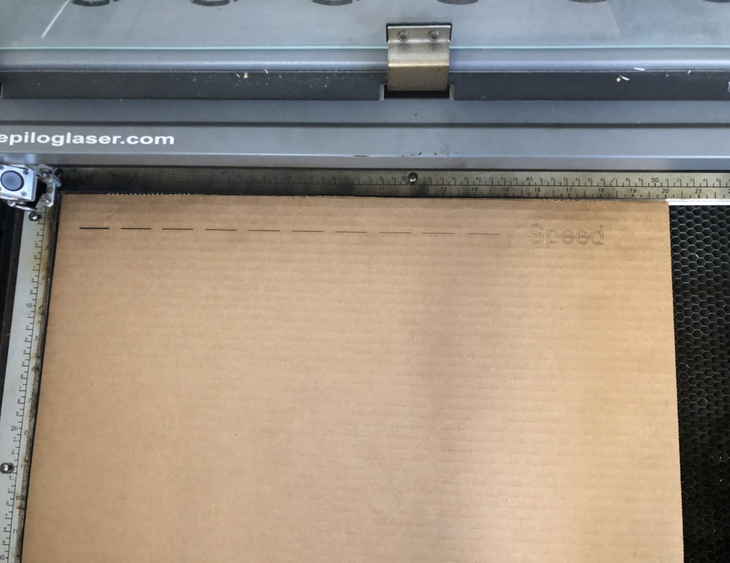
The file itself cut reletivly smoothly with no major issues, and the final cut came out well depicting the effectis of speed, power, and frequency. Here is a picture of it cutting and the final result.
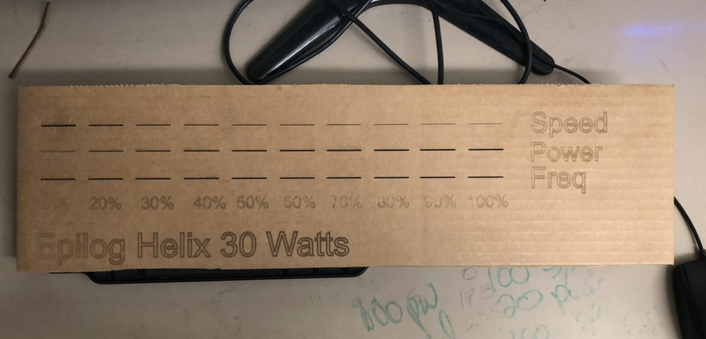
The results were what you would expect with faster and less powerful cuts not cutting through while the more powerful and slower cuts left bigger gashes and would ofter burn the cardboard. Frequency would control the resolution of the cut so for more percice cuts, a higher frequency is better but for lower quality cuts a lower frequency is fine.
Next, Jack and Jada tested for Kerf and focus. Kerf is essentially measuring the thickness of the laser. For kerf they created a box that was 3”x3”. They created one square and cut it then made an identical square with a line straight down the middle. They used a caliber to very precisely measure the length of the box and measure the box cut in two and calculated the difference. We measured the boxes in mm. The original 3x3 box without a line was 76.08mm long. The box with the cut line was 75.74mm. This gave the kerf value of 0.34mm. This was relatively easy to acheive.

Lastly we measured focus. We brought a simple “Avengers” logo design into CorelDraw then quick traced it as a bitmap. Then we measured the focus in incriments of 0.15. We started with 0/normal manuel focus. The normal manual focus was at +0.371 but we labeled it as the “0”. Next we moved it to +0.15, then +0.30, then lastly +0.45. This turned out nice, the only problem is that the logo could’ve been made a little smaller to make the cut go a bit faster.

Here as the focus gets higher the visibility goes down. +0.45 is impossible to see in a picture and nearly impossible to see in person but it is definetely there.
50 Watt Laser
Aarush’s Work
Myself and Pari were partnered as a smaller group for this weeks group assignment. We were tasked with characterizing the Speed, Power, Frequency, and Focus of the Epilougue Laser Fusion M2. First, I spent some time researching what each aspect meant. I made a table with my findings below
| Term | Description |
|---|---|
| Power | This is the output power of the laser which directly affects the deepness of the cut |
| Speed | How fast the nozzle of the laser cutter is moving in the X and Y directions |
| Frequency | Number of Laser Pulses per second the Nozzle emits |
| Focus | Spot size of the laser on the material |
After this, Pari and I divided the task up between the two of us, although both of us decided to watch the other do their part to gain more insight. I worked on the Frequency and Focus of the machine while Pari worked on the Speed and the Power.
Before we got started though, we discussed with our classmates Jada and Jack about how best to advance in our task. We decided to create a file with rows of 10 lines. The different rows would show different aspects, such as speed or frequency, and the 10 different lines would be at different levels ranging from 10%-100%. We would control the different levels by color mapping the lines, and adjusting either speed, power, frequency, or focus per row respectfully for each color. For example, one line would show speed at 20% while a different line would show power at 70%. As we increased the levels for one aspect by 10% each turn, we kept the other aspects constant in order to ensure the best possible results. We decided to try and get it all done in one run instead of multiple runs to save time, hence why we used the color mapping of the lines
Here is what our initial design file we came up with looked like
 as you can see, each line has a different color
and this is the final engraving we did on the carboard.
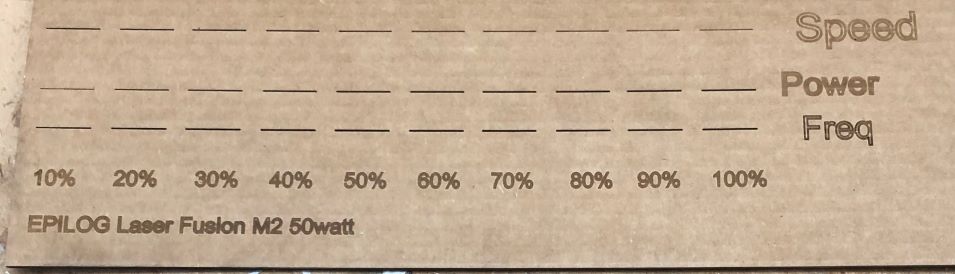
After we finished this, we realized we didn’t make a line for focus, so we had to go back and redo one for focus. The results of this task did not surprise us. The lines darkened as the laser was slower or the power increased. This meant a finer cut. Other than forgetting to do focus and having to do that once we thought we were finished, we had no major issues or speedbumbs in our assignment. Through this assignment, I learned what many different characteristics of the laser cutters meant redifinied my skills with all the laser cutters in our lab.
Pari’s Work
Pari and Aarush worked on the Epilog Laser Fusion M2 50 watt. Both of us characterized speed, power, frequency, and focus. Aarush and I decided to split up we allocated the different tasks at hand. I decided to do the speed and power and Aarush worked on finding the frequency and focus.
What do these terms mean?
| Term | Description |
|---|---|
| Power | This is the intensity of the laser, and how deep the cuts will be. You can use values of 1-100 for power. |
| Speed | This is how fast the laser is moving. Cutting at high speeds = less exposure and Lower speeds= more exposure to the material. |
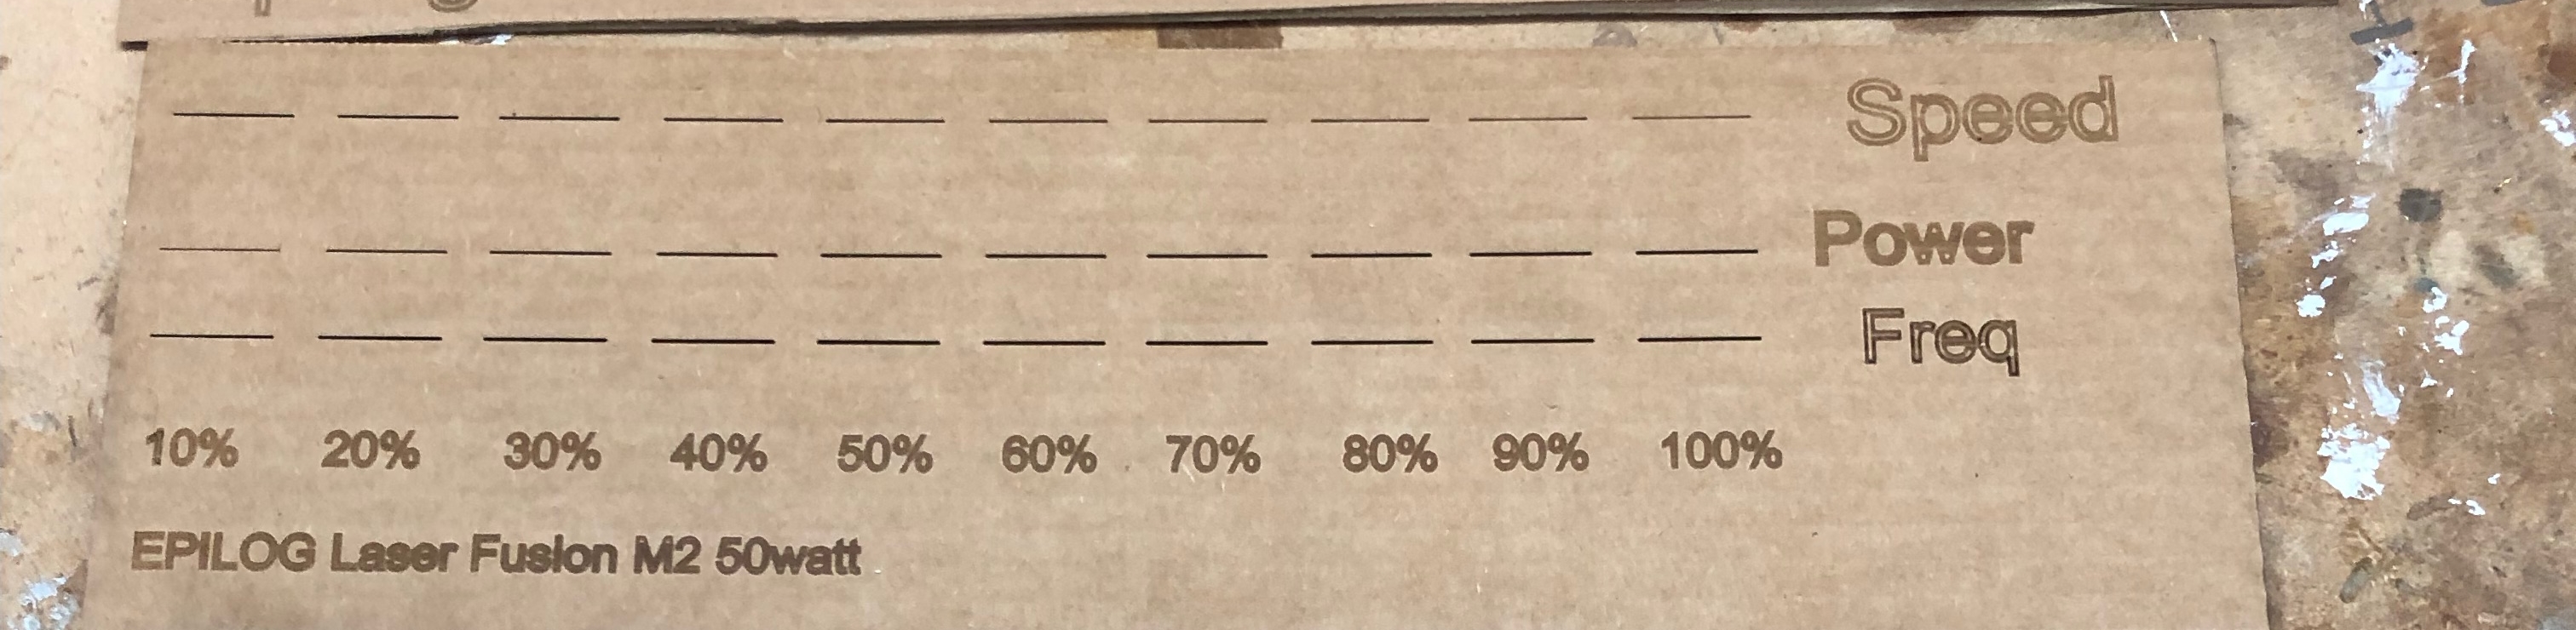
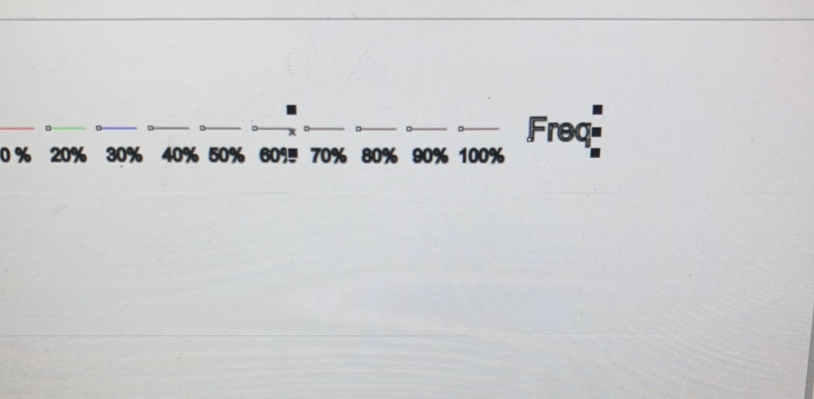
After learning what these terms are I designed the cuts in Corel Draw using color mapping and also designed the way the information was going to be presented on the cardboard. I based the design on past Fab Academy student group websites and referred to Alexandra Coston’s Group Project. They made a simple chart that went in increments of 10 and assigned each of the cuts to the same percentage.
Corel Draw Design

The different colored lines stand for the different power and speed for the cuts.
| Color | Power | Speed |
|---|---|---|
| Power | This is the intensity of the laser, and how deep the cuts will be. You can use values of 1-100 for power. | |
| Speed | This is how fast the laser is moving. Cutting at high speeds = less exposure and Lower speeds= more exposure to the material. |
Red- 10 Power, 10 Speed Green- 20 Power, 20 Speed Blue - 30 Power,30 Speed Etc
I labeled the bottom with the percentages to be able to read the chart properly.
After doing all the colormaps for the speed and power, I decided to use cardboard and printed the Speed and Power. One challenge that we ran into was how to engrave on a color map, this took us a while to figure out. We also were having trouble changing text to path. We searched up every tutorial out there, but still couldn’t figure it out, Jada Greene finally did and taught us all.
Final Display of Speed, Power and Frequency