11a. Output Devices (CLS Students)
Group A1
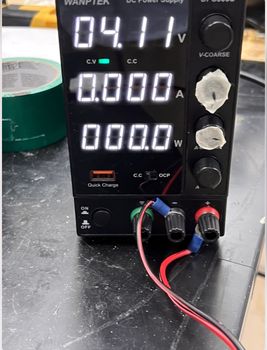
Both Nick and Alaric used a power supply to test Nick’s water pump. They tested the pump’s ability to pump water from one cup to another increasing the voltage in increments of 2.5v and staying at a consistent 50 mA to see the results.
2.5 Volts
2.5 volts proved to pump incredibly slowly to a point in which the pump would serve practically no useful function in a project at this speed.
5 Volts
They then tested 5v which was much faster but still not necessarily practical for any use.
7.5 Volts
Second to lastly they tested 7.5 volts which was much faster (as usual) and proved to be a useful speed. It took around 19 seconds to drain the entire cup from right to left.
10 Volts
Lastly they tested 10 volts. 10 seemed super powerful and potentially overkill, though keep in mind the pump was rated for 12v and 300 mA, so they were much within the safe limits meaning it could pump much quicker, but it still managed to pump the entire cup right to left in around 14 seconds beating 7.5 volts by around 5 seconds.
Conclusion & Graph
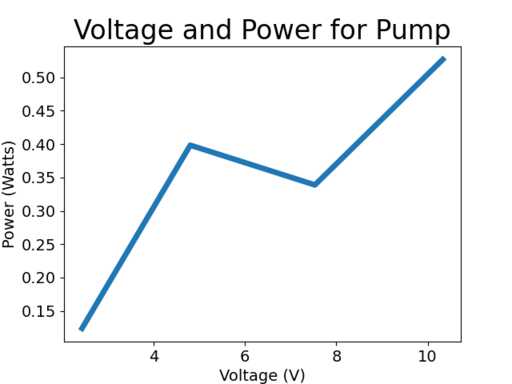
Overall, testing and incrementing the voltage proved that an increase in voltage will directly correlate with the speed at which the water pumps as illustrated in the tests above. This is because increasing the voltage increases power consumption as power is the product of voltage and current, and the current did not change very much. Below shows a graph of the results made by Alaric with python and matplotlib.
import matplotlib.pyplot as plt

voltages = [2.43, 4.8, 7.53, 10.33]
amps = [0.051, 0.083, 0.045, 0.051]
watts = []
for i in range(4):
    watts.append(voltages[i] * amps[i])
plt.plot(voltages, watts, linewidth=5)  # plots the points in a line graph
plt.title('Voltage and Power for Pump', fontsize=24)  # gives the graph a title
plt.xlabel('Voltage (V)', fontsize=14)  # gives a label to the x axis
plt.ylabel('Power (Watts)', fontsize=14)  # gives a label to the y axis
plt.tick_params(axis='both', labelsize=14)  # gives tick marks and sets the size of the labels
plt.show()
Pari and Aaron
For this week Aaron and Pari worked on testing a DC motor. The motor they used has specifications of 5V and 0.45A. Aaron worked on adjusting the voltage and noting the difference in speed, voltage and amperage as he increased the voltage. Pari worked on setting up the motor, connecting the wires and checking the data sheet to make sure the starting voltage wasn’t too much for the motor to handle.
Andrew, Aarush, Jada, and Jack
For this week Andrew, Aarush, Jada, and Jack tested a servo motor using Jack’s servo tester board. They hooked it up to a power supply and provided VCC and ground to the board, then they spun the potentiometer on the board and measured the power consumption. Here’s how it was wired up.
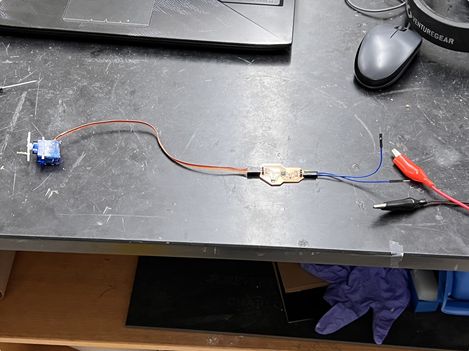
Here are the results in both image and video form