4b. Computer Controlled Cutting (CLS Adults)
Setting Up the Site
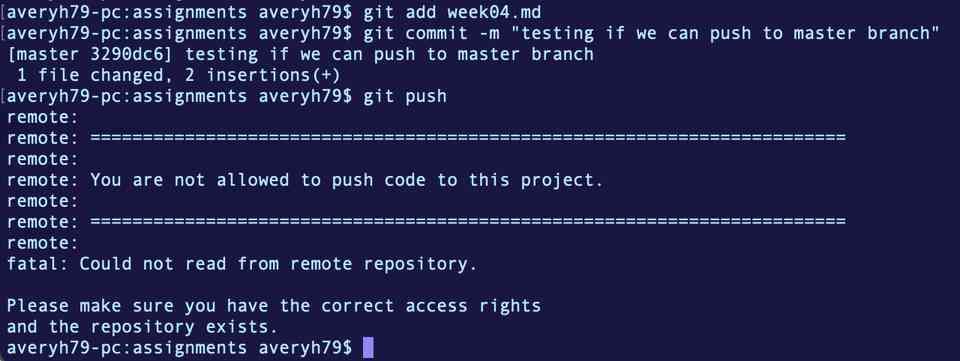
We found the class site code here. Everytime we tried to push to this repo, the following message was shown:
We figured out this was because the master branch is “protected”, as shown below:
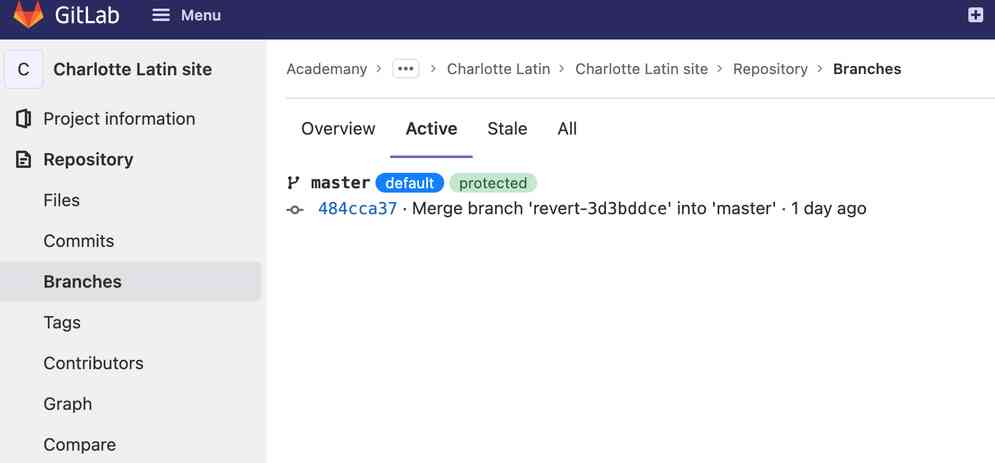
Because the master branch is “protected”, we cannot modify this code. So, one member of our group forked the repo:
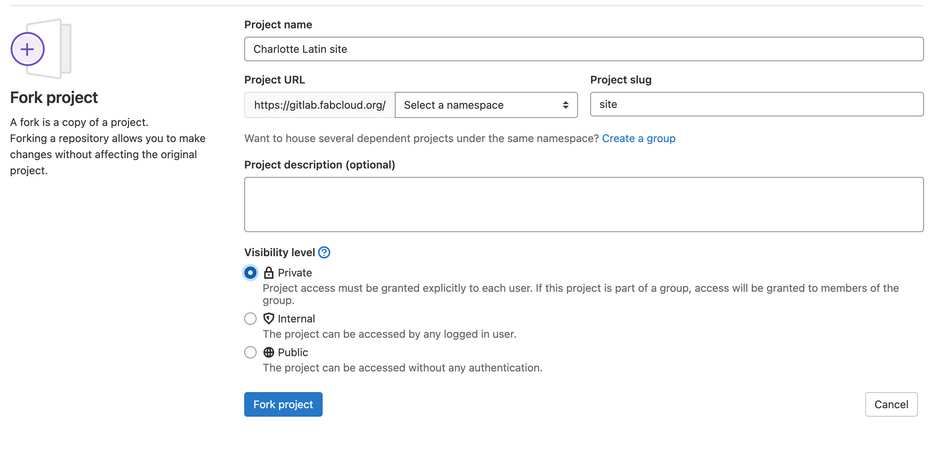
And invited the rest of the memebers of the group:
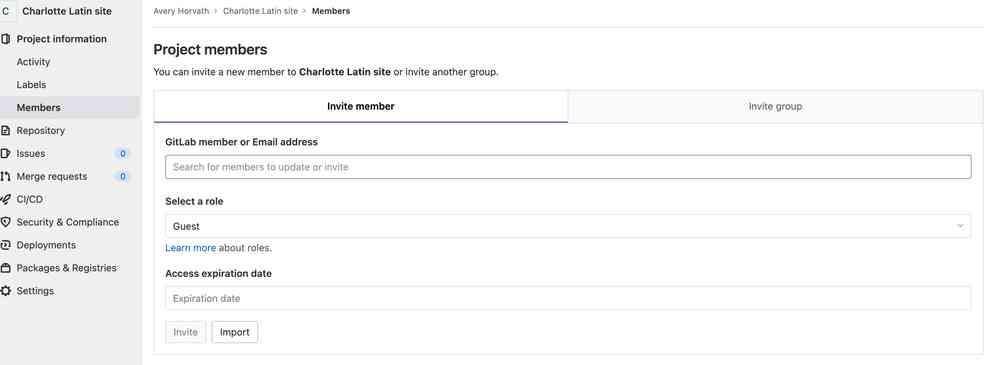
Then, the rest of the members received an email with a link to the forked repo. Each member can then push/commit and pull from this forked repo as much as they want. Once the assignment is complete, we submit a merge request to merge our code with the class site’s source code.
Testing Laser Cutter Specs
To characterize the Charlotte’s Fablab Lasercutter’s focus, power, speed, rate, kerf, joint clearance and types. We all worked together to analyze our laser machines in the lab.
(The AWESOME) Group: Avery, Barbara, Charlie, Nidhie and Scott.
Type of Laser Cutters:
Epilog Fusion Pro Epilog Fusion M2 50 Watt Epilog Helix 35 Watt Epilog Helix 30 Watt
Kerf
Kerf: the material that disintegrates due to the laser cutting. The measurements for Kerf is taken by the intended size, for example a one inch square BEFORE cutting minus the actual size of the square AFTER the cutting to equal the kerf.
| 0.15” Cardboard | 1” Intended Size | Minus | After Lase-Cut Size | Kerf |
|---|---|---|---|---|
| Fusion Pro | 1 inch | Minus | 0.972 (x 1/2) | 0.140 |
| Fusion M2 | 1 inch | Minus | 0.999 (x 1/2) | 0.005 |
| Helix 35-Watt | 1 inch | Minus | 0.989 (x 1/2) | 0.006 |
| 1/8” Wood | 1” Intended Size | Minus | After Lase-Cut Size | Kerf |
|---|---|---|---|---|
| Fusion Pro | 1 inch | Minus | 0.990 (x 1/2) | 0.0055 |
| Fusion M2 | 1 inch | Minus | 0.991 (x 1/2) | 0.0045 |
| Helix 35-Watt | 1 inch | Minus | 0.994 (x 1/2) | 0.0030 |
| 1/8” Acrylic | 1” Intended Size | Minus | After Lase-Cut Size | Kerf |
|---|---|---|---|---|
| Fusion Pro | 1 inch | Minus | 0.989 (x 1/2) | 0.0055 |
| Fusion M2 | 1 inch | Minus | 0.990 (x 1/2) | 0.0050 |
| Helix 35-Watt | 1 inch | Minus | 0.993 (x 1/2) | 0.0035 |
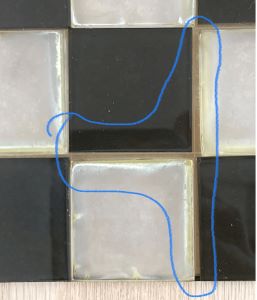
The Fusion Pro had the highest overall kerf, while the Helix-35 Watt laser cutter had the lowest kerf. While kerf values are generally low, they can add up in certain instances. For example, the image below shows a 9th grade student’s project (a laser-cut chess board). While kerf is not significant around one individual piece, it makes a big difference if multiple objects are cut in a row (as the chess board is in the image). After eight tiles were cut on acrylic (square dimensions of one inch), this led to a larger gap in the entire row.
Focus
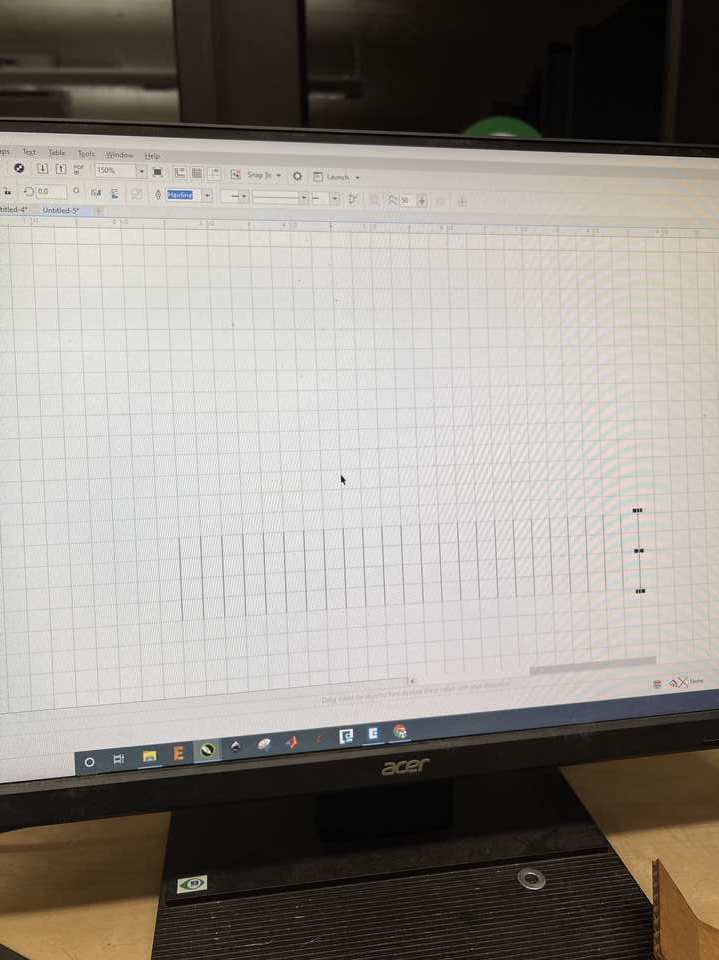
To test the focus, we used the Fusion M2 32 / 40 Laser System (Model 13000 / 14000) and the ramp test. To begin, we drew equally spaced vertical lines in Corel Draw:
Using the focus tool shown below:
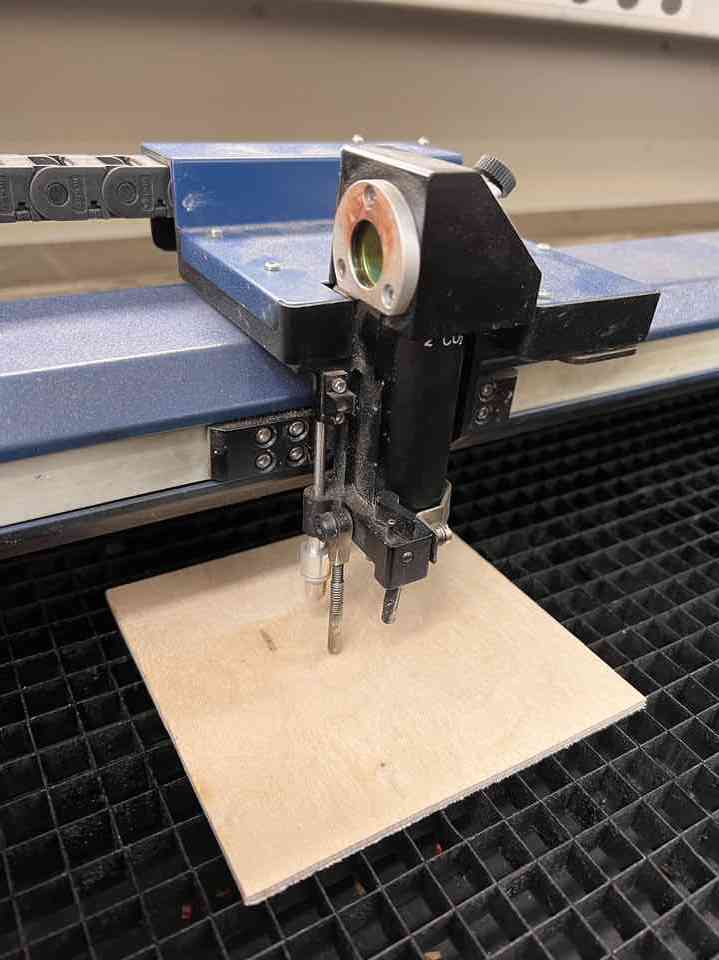
We placed the wooden board on an incline and placed this focus gauge in the middle - this sets the focus to the height at the middle of the board. The incline was set to be as steep as possible while ensuring the laser would never touch the top of the ramp at this focus. For this test, we should be able to see the effect of an incorrect focus as the laser cutter moves up and down the incline. The optimal focus should cause a line that is the same thickness throughout on both the front and back side of the wood and has minimal burn marks. So, theoretically, the lines at the top of the ramp should have too many burn marks and the lines at the bottom of the ramp should not have a uniform thickness. Our results matched this theory:

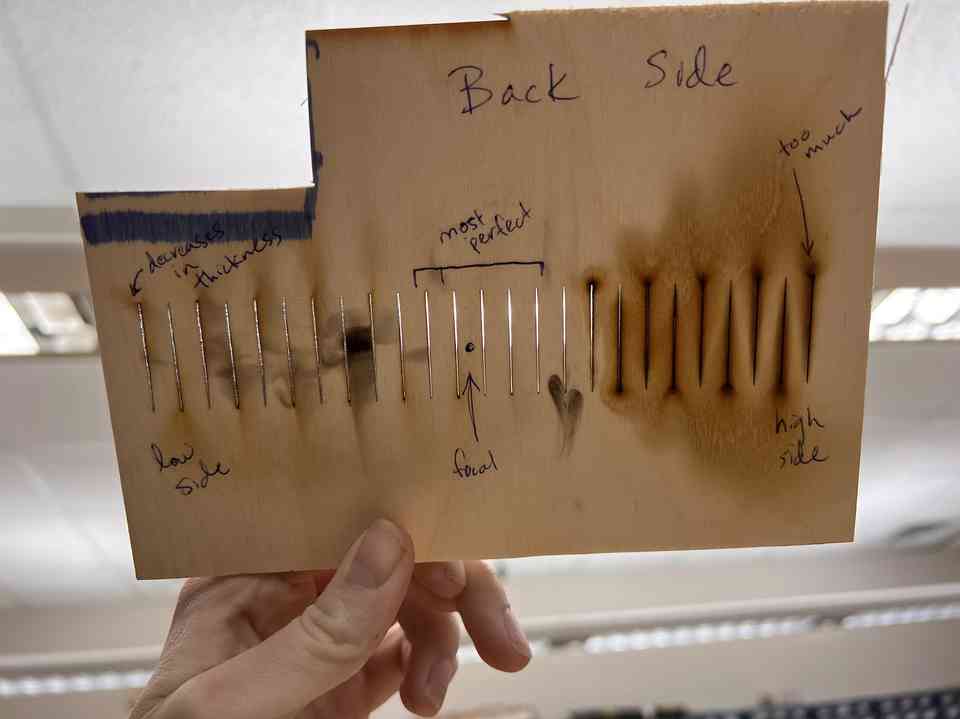
The cuts on the low side of the panel’s front are thicker because the kerf will have a greater effect if the laser is out of focus. On the back, these same cuts are not nearly as thick as the frontside - which backs up the theory stated above. In addition, the cuts at the top of the ramp show considerably more burn marks (more noticable on the back) than those further fown the ramp. The cuts that are uniformly thick and have minimal burn marks are those in the middle, where we placed our focus. Therefore, it was determined that the focus tool on the laser cutter is a good way of determining the optimal focus.
DPI and Frequency
DPI is a term used when rastering with a laser cutter, while “frequency” is related to the vector functioning of a laser cutter. Frequency can be set on the laser cutter we tested from 1 to 100. As we all discussed these two parameters, we realized that DPI and frequency were similar in their functionality. We decided to use two shapes- a circle and a square- both with the same center diameter, and we decided to test the frequency and DPI on the Epilog Fusion M2 Laser in the CLS Fab Lab (since this laser cutter requires thes setting to be entered manually with each job).
The steps we used to determine the best DPI were as follows in the table.
| Step | Description |
|---|---|
| 1 | Create a file in Corel Draw with a small square and a small rectangle. |
| 2 | Set the fill inside the circle and square to black (through Object Properties). |
| 3 | Make sure that the outside pen stroke is set to 0.5. |
| 4 | Run the laser cutter using the lowest DPI under the raster settings, and increase it one level for each test. (75 –> 100 –> 200 –> 300 – 600 –> 1200) |
| 5 | Examine the quality of the rastered shape (circle and square) on corrugated cardbard (that is 0.15” thick). |
The steps we used to determine the best frequency were:
| Step | Description |
|---|---|
| 1 | Create a file in Corel Draw with a small square and a small rectangle. |
| 2 | Set the fill inside the circle and square to “no fill” (through Object Properties). |
| 3 | Make sure that the outside pen stroke is set to hairline (or 0.001”). |
| 4 | Run the laser cutter using the lowest frequency under the vector settings, and increase it 10% (up to 60%) for each test. (10% –> 20% –> 30% –> 40% –> 50% –> 60%) |
| 5 | Examine the quality of the vectored shape (circle and square)– how well it cut through corrugated cardbard (that is 0.15” thick). |
The following image shows the results of our tests.
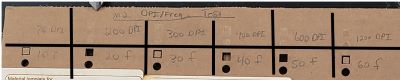
Summary of our results: DPI stands for “dots per inch”. When the frequency is higher, this means that more dots per inch are being detected. When vectoring, frequency is the measure of the number of pulses (of energy) per second.
The relationship between frequency and raster quality can be explained “as DPI increases, the darker the image rastered”. While more often is better, this is not the case with DPI, and it seemed that an ideal DPI setting for rastering on cardbaord is around 300 DPI. The shape of the obect being rastered did not affect the quality of the rastered image.
When vectoring our two shapes, it was interesting that the circle cut through every time. As the frequency increased, we saw 9/12 of the shapes overall fall out of the parent material. Our results did not show any clear trend. However, we deduced that there is lower heat given off (and burning the material) at low frequency settings. We discussed our tests with Tom Dubick, and he mentioned that low frequencies are often used on organic materials because of their quick charring. For a material like acrylic (a dense synthetic material), high frequencies would be preferred because melting is needed to cut it.
After running the tests, we were able to find the Epilog Fusion M2’s User’s Guide. It was interesting to note that in order to score a material like cardboard, a frequency level of 5% should be utilized. Low frequencies of 1%-5% should also be used on metals.
Speed and Power
To characterize the speed and power of the Fusion M2 32 / 40 Laser System (Model 13000 / 14000) and the Thingiverse user Erpel09’s Material Test Car for Laser Cutting and Engraving (SVG).
We ran this test several times on 1/8” plywood. First, we ran a baseline with the standard reccomended settings on the M2 for 1/8” plywood. Then we compared these results with the same test ran at half power, and then again at double speed. Note, the speed and power settings were changed for both rastors and cuts. The DPI and frequency we’re held constant for these tests.
| T1 (Std.) | T2 (Half Power) | T3 (Double Spd) | |
|---|---|---|---|
| Power | 100% | 50% | 100% |
| Speed | 8% | 8% | 16% |
| DPI | 300 | 300 | 300 |
| Frequency | 10 | 10 | 10 |

For rastering, the results of this test were pretty clear and as expected. Halving the power and doubling the speed led to very similar results. This can especially be seen on the engrave-wheel as compared to Test 1, which used the machines’ standard reccomended settings. As expected, the “100%” section of the wheel, appears half as dark for the tests 2 and 3 as compared to test 1.
Interestingly, the two tests began to diverge when it came to cutting. Test 2 (half-power) still succesfully cut through the material. On the otherhand, Test 3 (double-speed) did not make it all of the way through.
Important note about Test 3, the square cutouts did not drop loosely after the cut passes some of the squares are missing because a group-member punched them out. Hence the note “Punched ->”
This tells us that the standard power settings for this machine are perhaps on the conservative side. On the other hand, the speed settings seem to be fine where they are. Otherewise, if we reduce them, we risk leaving material or “tabs” around the edges of the cuts.
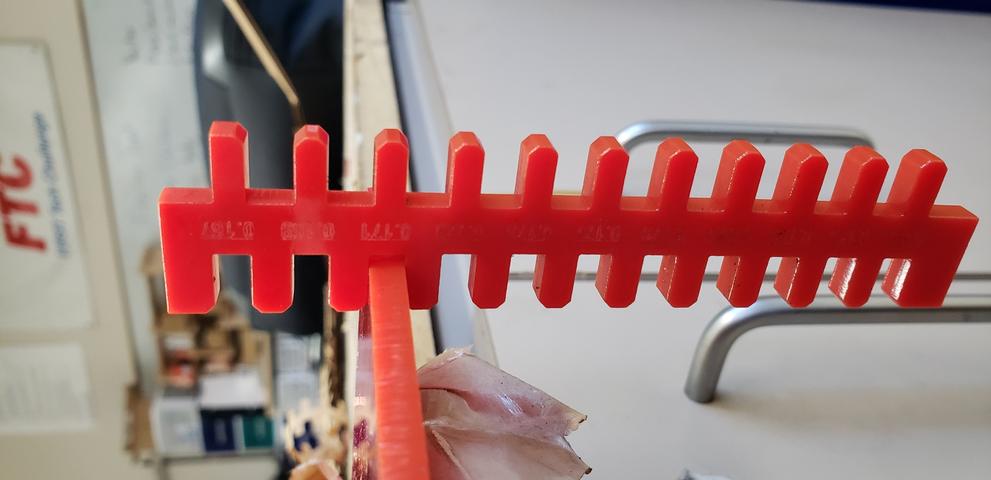
Joints
Our team did a multiple tests to characterize joints on the laser cutters. It is useful to understand which size gap will create a slip-fit vs. a press fit. To test this on an acrylic sheet of thickness 0.177”, a comb-test was created. Nominally, each gap varied by 0.002” (eg 0.179”, 0.177”, 0.175”, etc). By nominal, it is meant that these are the values the comb was designed with. Of course, these gaps are theoretically larger than these values by a factor of 2*kerf.
This agrees with this page that details how to achieve a theoretical line-on-line contact or perfect fit. This can be done with the equation,
Peg = slot + 2*KERF
Therefore, since these pieces we’re being cut on the M2, which has a measured kerf of 0.0045”, we should design the peg to be 0.009” larger than the slot for a perfect fit. In practice using the comb-test, a slot size of 0.175” led to a suitable slip-fit whereas a slot size of 0.171” led to a suitable press-fit.