7b. Electronics design
Oscilloscope
We followed these steps to calibrate and get accustomed to the oscilloscope.

DC
Using a SAMD11C board that each of us made, we connected the oscilloscope probe to the VCC of the board and the aligator clip to the same ground in the circuit:
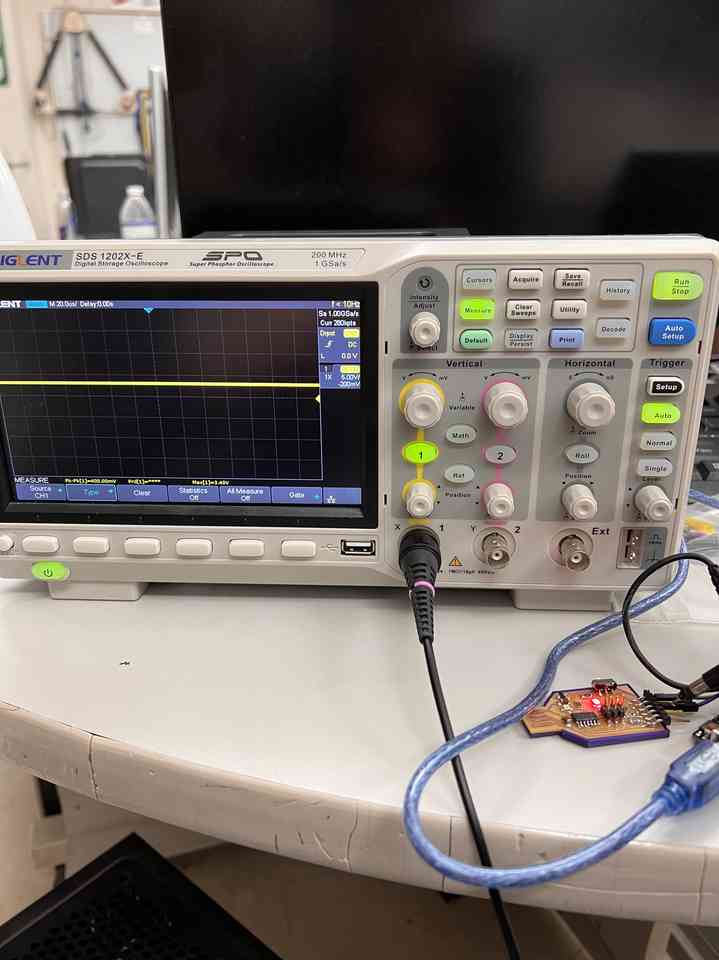
Using the measure function, we confirmed that the “Max” of this signal is the expected 3.3V, which is the same as the input. Because we are inputting DC, the straight line is expected. We confirmed that this voltage matched the voltage input to the LED when the LED is always turned on. Interestingly, when we switched the voltage regulator to the 5V position (on the bottom right of the SAMD11C PCB), the “Max” of the signal is around 5V (ours was slightly less). Since the required 3.3V needed to light the LED had been achieved, this did not change when the switch was in the 5V position.
PWM (Analog-Like)
PWM is used to get an analog-like output from digital means. Although PWM isn’t a true analog output, it tries to mimick an analog signal by applying power in pulses.
We loaded Fading.ino (Files–>Examples–>Analog–>Fading in the Arduino IDE) to a PWM board via our SAMD programmer to show this. This code sends varying 0-255 values to the LED via analogWrite command, which determines the “pulse with” - i.e. how long the LED is on or off. Although the peak voltage of the signals are not changing, the LED effectively looks brighter to our eyes when the value sent is greater. This is explained further here. The image below shows the PWM doing its “magic”.
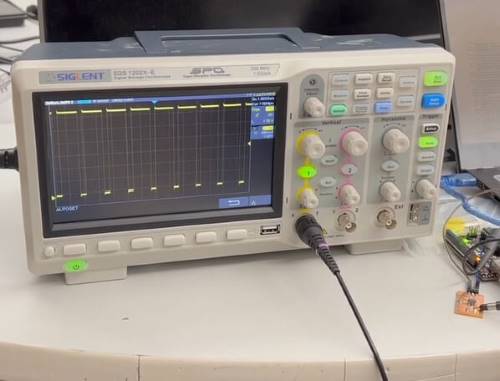
As the LED brightens, the amount of time HIGH (Peak of the signal) gets larger while the amount of time LOW (trough of the signal) simulatenously gets smaller. Then, as the LED dims, the inverse happens. The period of the wave stays the same - as shown by the number of peaks and troughs shown in the video staying consistent - and the only thing that changes is the time spent HIGH/LOW. The oscilloscope also illustrates that the signal is just a square wave, confirming the output is still digital. This is very different from the line observed in the Max function of the voltage previously displayed.
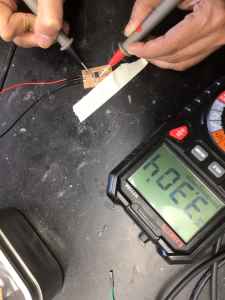
Multimeter
We decided to use our ATTiny Blinky board to experiment with the multimeter. Using a _(brand) multimeter, we set the dial to , and connected the ATTiny Blinky to the SAMD11 Board. The “fade” code had already been uploaded onto the ATTiny, and to confirm that we were inded controlling it, we change the fade times. Once we saw that the SAMD11 was programming the ATTiny Blinky board, we started to measure the voltage across the componenets on it. The following table shows the results of our investigation.
| Image/Vide | Explanation |
|---|---|
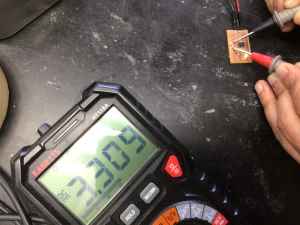 |
This test showed that the voltage across the capaitor was stabilized around 3.3V. This made sense because the switch on the SAMD11 was set for 3.3V (and not 5 V). |
 |
In this test, we tested a random LED to see how the voltage of an object outside of our ATTiny Blinky Board would compare. The voltage of the LED off by itself was ~1.5V. |
 |
For this test, we tested the voltage across the ATTiny 412 chip. By placing the positive probe on the VCC pin, and the negative probe on the GND pin, we were able to see that the chip had a voltage of 3.3V. This matched what was going on with the capacitor; so the voltage “pulsations” were only occurring in the LED and the resistor– not other parts of the circuit. |
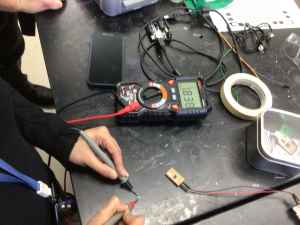
In the following activity, we tested the voltage across the LED as the Arduino code was controlling it to fade. The voltage faded with the light being emitted from the LED. The video below shows the voltage changes in the LED.
For the following test, we tested the voltage across the ATTiny 412 chip. By placing the positive probe on the VCC pin, and the negative probe on the GND pin, we were able to see that the chip had a voltage of 3.3V. This matched what was going on with the capacitor; so the voltage “pulsations” were only occurring in the LED and the resistor– not other parts of the circuit. The video below shows the voltage readings in the resistor.