Week 7 Students A
Jed, Merrit, Ryan, Griffin, and Adam
Multimeter the LED - Griffin
When checking the voltage of the LED with a multimeter, the LED had a voltage of 2.5 V when it was on and 0 when it was off. The voltage of the 1k resistor was .7 V when it was on. When measuring the voltage of the chip by placing the red probe on the power and the black on the ground, I found that the voltage of the chip was 5 V.
 <<<<<<< HEAD
Photo by Jed
<<<<<<< HEAD
Photo by Jed
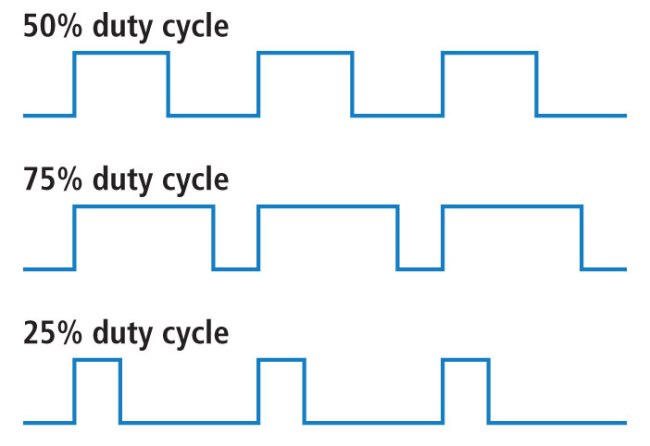
Understanding PWM - Adam
This website helped us understand how PWM uses digital signals to simulate an analog value. Every signal has a % duty cycle which represents for what proportion of an alloted amount of time the signal is high and for what proportion it’s low. This percentage can then be measured by another device and interpreted as a non-binary value.
Photo by Jed
5bbfd7871519b28f6423c5c371b7beff4268e115
Analog Discovery 2/ Oscilliscope- Ryan and Merritt
The Analog Discovery 2 is a great tool that can do a variety of tasks. The tools we used involved the Waveforms Generator, and the Scope, which is an oscilliscope on the WaveForm software. We connected it to the computer with a USB and tested some things out.
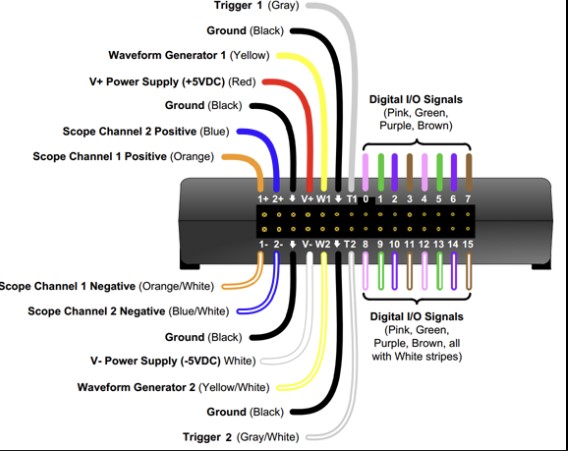
We used Adrian’s board that we had all soldered at the beginning of the week to test some things out with the scope. First, we made sure it the board worked by blinking the LED that was soldered on. Once we knew it was working, we decided to first test the voltage change by setting an OUTPUT pin to HIGH and LOW with a 1 second delay. The pins on the AnalogDiscovery all perform a certain task:
Digital Signal Voltage Wave
Because we were using the Scope Channel 1, we connected the 1+ and 1- pins to the breadboard with an LED and resistor connected to power and ground. However, Ryan pointed out that we could just connect the 1+ and 1- pins directly to the OUTPUT pin that we had set in the code and the 1- to GND, since we were just getting a voltage reading. The code set the OUTPUT pin to a LOW then HIGH, so when we plugged it into the osclliscope, we saw the line that showed voltage go up and down constantly. SInce this is digital, it was a line going up and down, as the signal was either high or low.

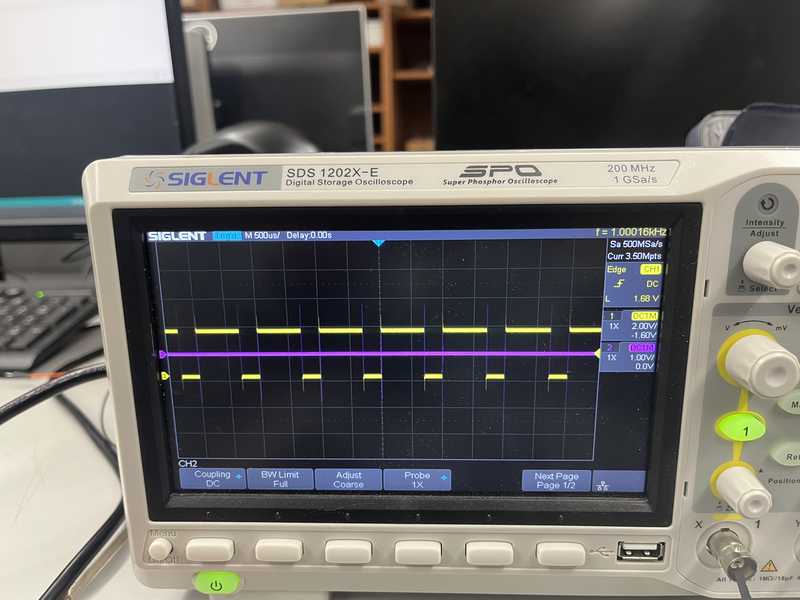
PWM
As Adam researched an mentioned earlier, we had to first get a better understanding of what PWM was. After gaining a better understannding of how it takes the average time a digital signal is high and converts it to an apporximate analog signal, we uploaded the arduino example code “Fade”. This code faded an LED over a range of 0-255 in increments of 5 with 30 miliseconds between each incrament. We uploaded the code to FabXiao board we made, then plugged the pin that we chose to fade, in this case pin 7. We then connected pin 7 to the V+ channel of the oscilioscope, and saw what the PWM output looked like.
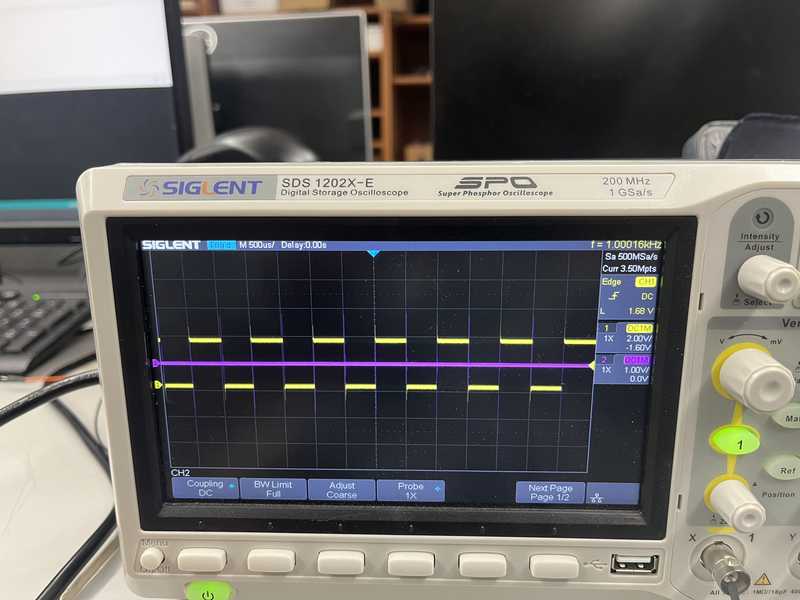

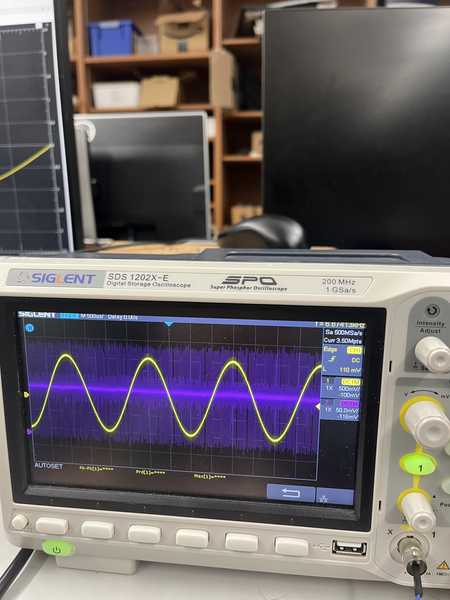
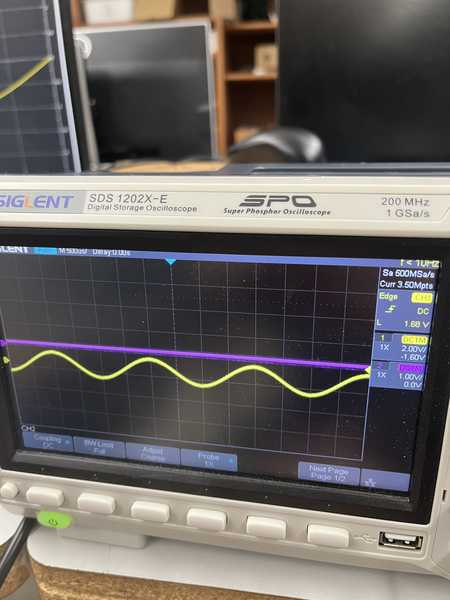
Waveform Analog Signal
None of the microcontollers at our lab are capable of producing an analog signal, as none of them have DAC (Digital-To-Analog Converter), so instead, in the WaveForm software, we swtiched from the Scope to the WaveGen tool, and Merritt uploaded an Analog Signal as an input to the pin, by choosing the W+ and W- as sources to generate the wave from. We then brought in a real physical oscilliscope, and we connected the pin via a breadboard to share the power source from the USB along with GND. We plugged the power into the oscilliscope and set it up to read the Analog signal, which turned up in an actual wave. Throughout this process, we were able to gain insight on activating and reading signals, and then using the tools to read them through a graph that shows the signal change over time. This could be useful in later projects when we need to see if there is a signal coming in or out of a component. The Analog Discovery 2 also has many other options to choose from that can perform a variety of tasks. Always make sure to connect the right pins, or else there will be no reading in that channel or it would read the wrong data. Here’s what the analog signals looked like on the scope.