Week 10 Group Assignment: Measuring Output Device Power Consumption
Task Overview
According to the Week 10 syllabus requirements, our group needs to select output devices, measure their electrical characteristics using a voltage-current-capacity meter, and analyze and understand their working principles. In this assignment, we will cover 3 parts:
- Measuring the power consumption characteristics of 6 LEDs on a custom XIAO ESP32C3 development board (written by Lei Feng)
- Measuring the power consumption and operating characteristics of the Grove Mini Fan (written by Lei Feng)
- Measuring the power consumption of an LCD connected to XIAO ESP32S3 (written by Liu Hongtai)
Materials and Equipment
Hardware
- Custom XIAO ESP32C3 development board (with 6 LEDs)
- Grove Mini Fan module
- YZXstudio ZY1271 USB voltage-current-capacity meter
- Connecting wires/Dupont cables
- USB data cable
- Computer (with Arduino IDE installed)
Core Measurement Device: YZXstudio ZY1271 USB Voltage-Current-Capacity Meter
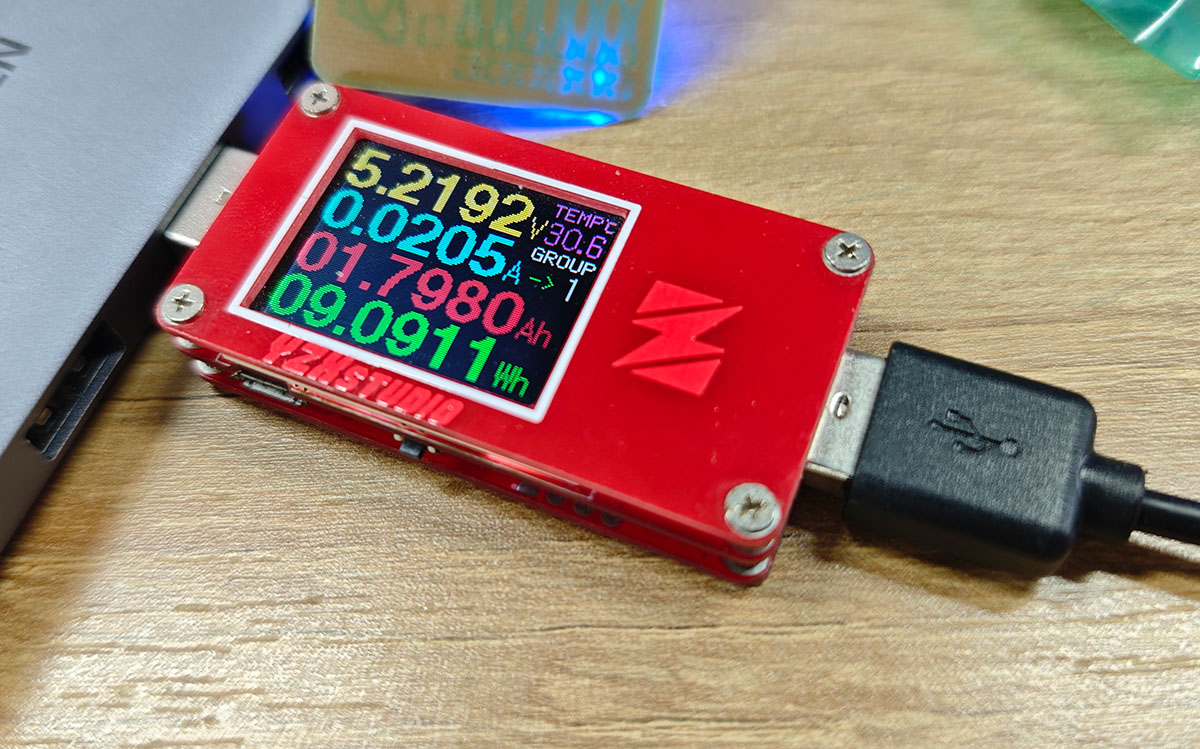
YZXstudio ZY1271 USB voltage-current-capacity meter with color screen
Main Technical Specifications:
- Input voltage: DC4-24V
- Input current: Continuous ±3A
- Voltage resolution: 0.0001V
- Current resolution: 0.0001A
- Capacity accumulation: 0-99999Ah; 0-99999Wh
- Capacity resolution: 0.0001Ah; 0.0001Wh
- Accuracy: Voltage range 0.2%+2d; Current range 0.1%+2d
- Display screen: 1.3-inch 128*104 dot matrix color TFT LCD
- Refresh rate: 0.36 seconds/time
Measurement Guide
Steps for Using YZXstudio ZY1271
- Hardware Connection
- Connect the USB voltage-current-capacity meter to the power adapter
- Connect the tester output to the XIAO ESP32C3 development board
- Complete connection sequence: Power adapter → YZXstudio ZY1271 → XIAO ESP32C3 development board
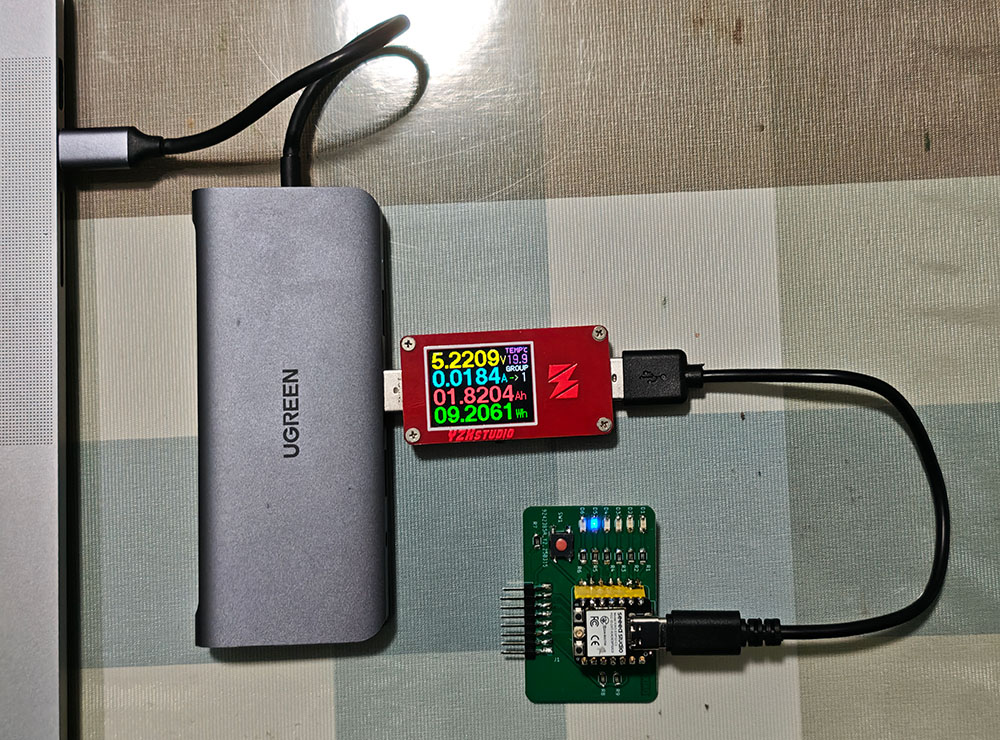
Device connection sequence: Computer USB port (as power adapter) → YZXstudio ZY1271 → XIAO ESP32C3 development board
- Tester Operation Instructions
Press the button on the side of the tester to switch between multiple function modes. The button location is shown in the figure below.
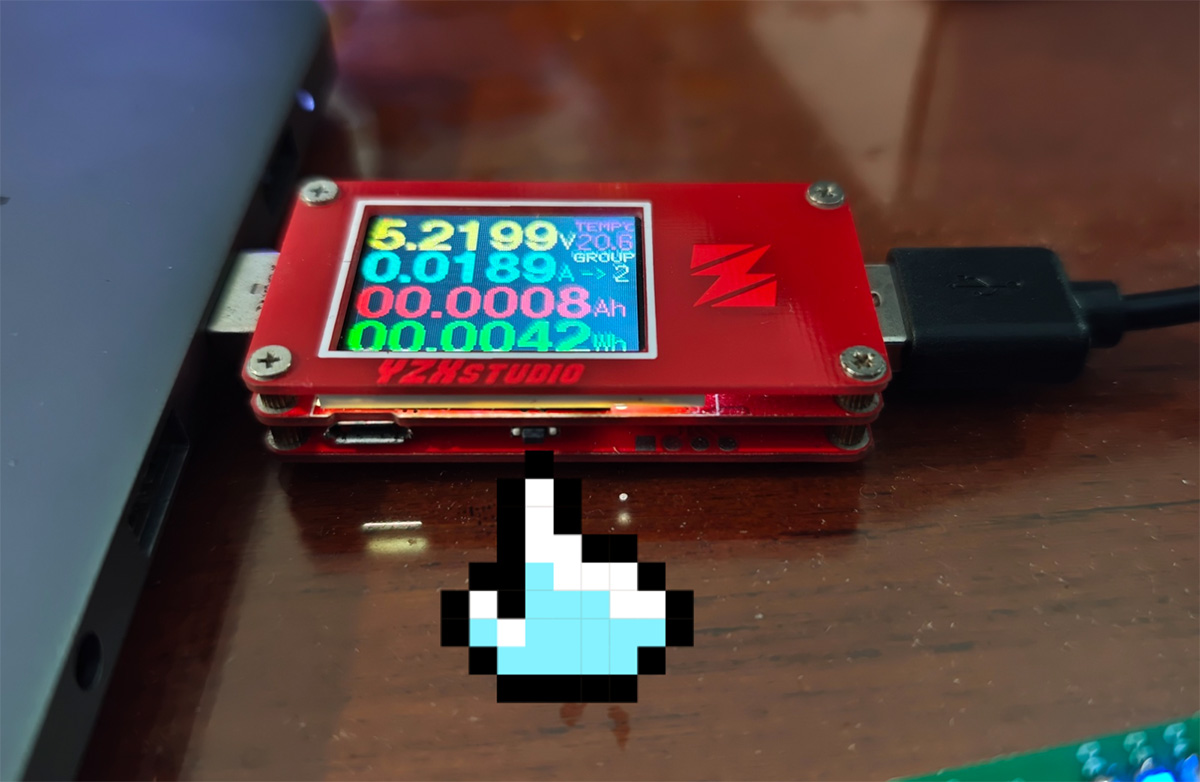
Button location of the YZXstudio ZY1271 USB voltage-current-capacity meter
- Function 1: Large font display of voltage, current, Ah, Wh, with temperature and current capacity group on the right. Long press to jump to the next group, extra-long press to reset the current group, short press to switch to the next function.
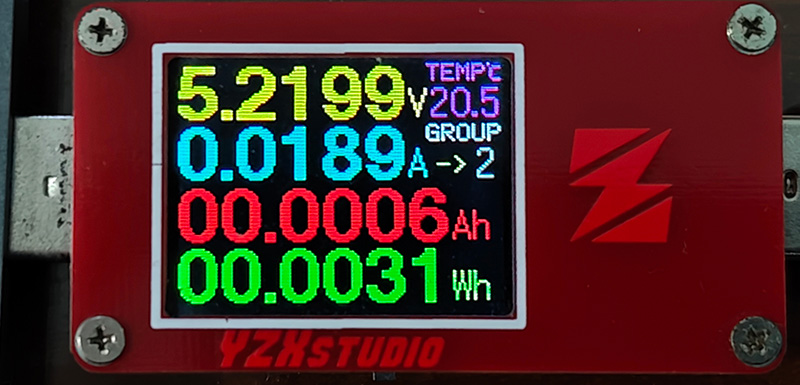
Function 1 display screen of the YZXstudio ZY1271 USB voltage-current-capacity meter
Ah (Ampere-hour): This is the accumulated value of current over time, representing the total charge consumed by the electrical device. 1 ampere-hour equals 1 ampere current maintained for 1 hour. For example, if a device continuously consumes 0.5 amperes for 2 hours, it has consumed 1 ampere-hour of charge. Ah value reflects the physical unit of battery capacity and device power consumption.
Wh (Watt-hour): This is the accumulated value of power over time, representing the total energy consumed by the device. 1 watt-hour equals 1 watt of power maintained for 1 hour. The calculation formula is: Wh = V × Ah, i.e., voltage multiplied by ampere-hours. Wh value directly reflects the actual energy consumption, taking voltage into account.
When measuring device power consumption:
- Ah tells you how much charge has been consumed
- Wh tells you how much energy has been consumed
These values are useful for evaluating battery life, comparing the energy efficiency of different devices, and calculating the operating costs of power systems. In the YZXstudio ZY1271 voltage-current-capacity meter, these values accumulate continuously as the device operates until manually reset.
- Function 2: Voltage and current remain the same, with large font power and equivalent load resistance below. Long press to jump to the next group, extra-long press to reset the current group, short press to switch to the next function.
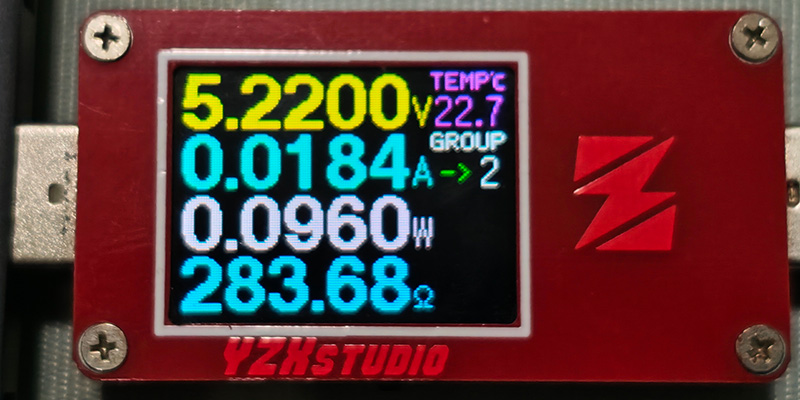
Function 2 display screen of the YZXstudio ZY1271 USB voltage-current-capacity meter
Function 3: D+ D- voltmeter, which can measure the D+ D- voltage of USB sockets to determine adapter type and USB port type. Note that it's recommended to test adapter types without load, as inserting a phone or device will interfere with the test results. The right side displays recording time and trickle shield. The system only records capacity and increments time when the current is greater than the trickle shield value, and displays "·REC" at this time. The trickle value can be changed in settings. Long press to enter system settings. NORM means normal output, HI A means overcurrent, HI V means overvoltage, LO V means undervoltage, HOT means overheating.
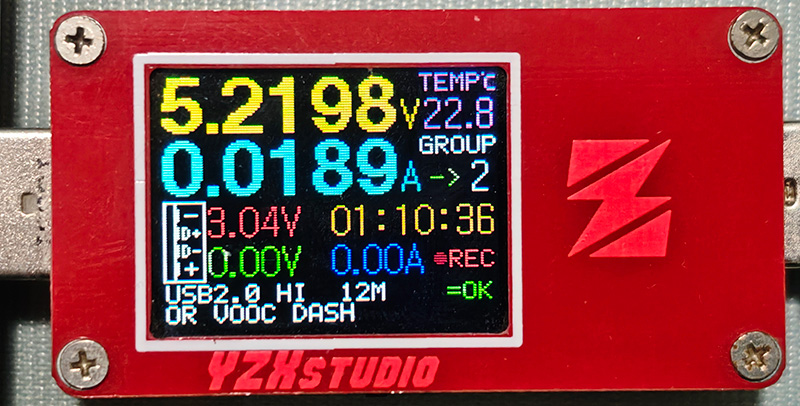
Function 3 display screen of the YZXstudio ZY1271 USB voltage-current-capacity meter
- Function 4: Micro-resistance measurement function, recommended for data cable testing. There are 2 test modes: 1: Voltage drop detection 2: 4-wire Kelvin detection. In voltage drop detection mode, REF displays reference data, CRT current voltage and current, RES calculated micro-resistance, Vloss data cable voltage drop. Testing method: Plug the USB meter directly into the adapter, adjust the constant current load to a stable 1-2A and plug it into the USB meter, long press to record the REF reference data, then plug the cable to be tested into the adapter, and the other end into the USB meter and the constant current load from earlier, and the RES column will display the resistance value and voltage drop. For 4-wire Kelvin detection, please purchase a dedicated test fixture and directly plug the data cable to be tested into the fixture to display the line resistance.
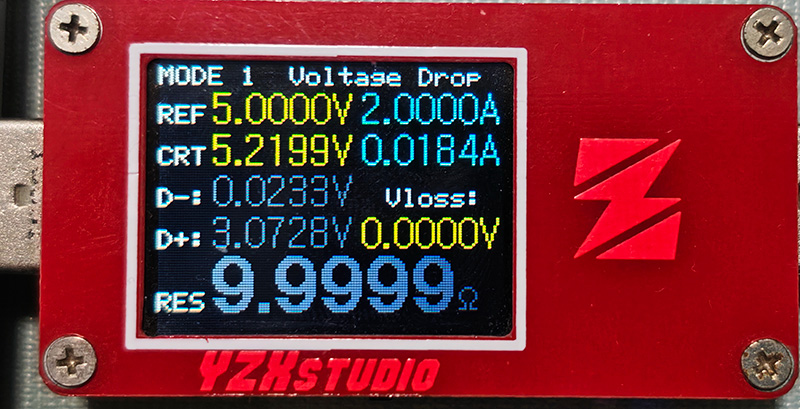
Function 4 display screen of the YZXstudio ZY1271 USB voltage-current-capacity meter
Function 5: Curve drawing, which can be used to monitor voltage and current fluctuations. Long press to switch between normal slow curve, fast voltage-current curve, D+ D- voltage curve, and background recording curve. The curve drawing speed and offline curve recording time interval can be modified in settings. A total of 384 offline data points can be recorded, with a time range from 1 hour to 48 hours.
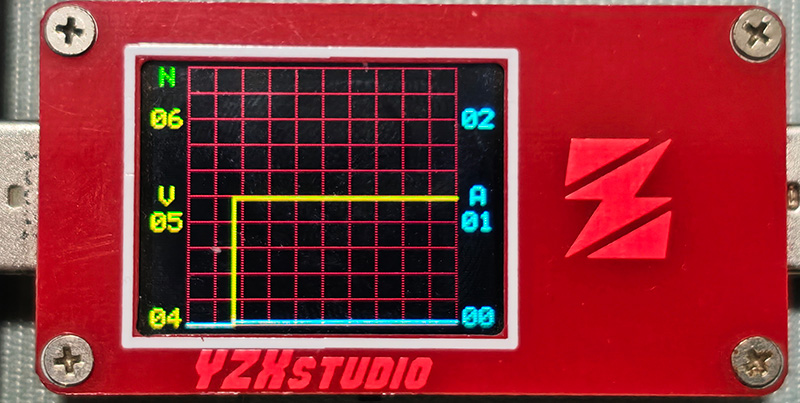
Function 5 display screen of the YZXstudio ZY1271 USB voltage-current-capacity meter
System Settings: Hold down the button and power on to enter system settings, as shown below.
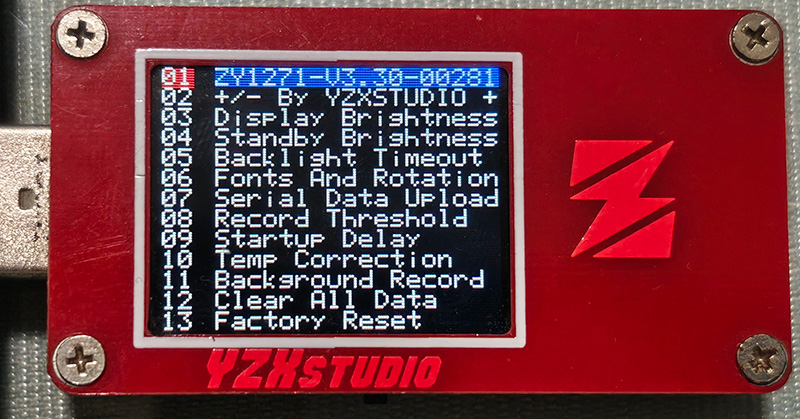
System settings screen of the YZXstudio ZY1271 USB voltage-current-capacity meter
After entering settings, short press to switch setting items, long press to enter a setting item, short press to fine-tune parameters, and long press to save after setting.
01: Long press to exit settings.
02: Parameter increase/decrease, parameter increases or decreases with each button press when setting items.
03: Screen display brightness.
04: Timeout standby screen display brightness, 0 for turning off the screen in standby.
05: No operation standby delay time, 0 for no standby.
06: Large number font; rotate display direction.
07: Serial upload period; format, 0 to turn off serial upload function.
08: Trickle shield; recording threshold, stops recording when actual current is less than this value.
09: Boot screen delay, 0 to turn off boot screen.
10: Temperature calibration, adjust until the displayed temperature matches room temperature.
11: Background recording period; offline curve period, 0 to turn off background recording.
12: Clear all recorded data.
13: Restore calibrated factory settings.
14-19: ZY1272 protection function settings, other models automatically skip.
20: 10V voltage reference, input precise 10V and select this item for calibration.
21: 2A current reference, output precise 2A and select this item for calibration.
22: Backup factory settings, do not back up arbitrarily to avoid overwriting factory calibration.
23: Restore uncalibrated initial settings.
24: Restore calibrated factory settings.
Reading Measurement Data
- Voltage value: Read directly from the top large numbers, accurate to 0.0001V
- Current value: Read from the second row of large numbers, accurate to 0.0001A
- Power value: Short press to switch to function 2, read from the third row, unit is W
- Accumulated capacity: Stay in function 1, read Ah and Wh values from the third and fourth rows
Capturing Transient Data
- Motor start-up current peak: Use function 5 curve drawing
- Long press to enter curve drawing, select "Fast voltage-current curve"
- Observe the curve at the moment of motor start-up, record the peak value
Notes
- Ensure readings are stable before each measurement (wait approximately 2-3 seconds)
- Use the curve function to capture rapidly changing values
- Set the trickle shield value to a low value (<10mA) to ensure small current changes are captured
- When measuring start-up current peaks, the tester's screenshot function can be used (long press and select screenshot)
Part One: Measuring XIAO ESP32C3 Development Board LED Power Consumption
Development Board LED Layout Introduction
The custom XIAO ESP32C3 development board has 6 LEDs (D0-D5), all connected to ESP32C3 GPIO pins through appropriate current-limiting resistors. According to the schematic, each LED's circuit structure is as follows:
Vcc (3.3V) --- LED --- Current-limiting resistor(220Ω) --- GPIO pinExperimental Setup
- Hardware Connection
- Connect the YZXstudio ZY1271 USB voltage-current-capacity meter in series between the power supply and the XIAO ESP32C3 development board
- Connect the development board to the computer using a USB data cable
- Upload the test program to the development board
- Test Program
I wrote a test program and added button prompts for the YZXstudio ZY1271 USB voltage-current-capacity meter, making it easy to follow the instructions in the serial monitor during the recording process.
// LED pin definitions
const int LED_PINS[] = {D0, D1, D2, D3, D4, D5};
const int LED_COUNT = 6;

// Test state marker
int testPhase = 0;

void setup() {
  Serial.begin(115200);

  // Wait for serial connection
  delay(2000);

  Serial.println("\n===== XIAO ESP32C3 LED and Fan Power Consumption Test =====");
  Serial.println("Before starting the test, please set up the power tester according to the following steps:");
  Serial.println("1. Short press the tester button to switch to function 2 interface (showing voltage, current, power, and equivalent resistance)");
  Serial.println("2. Long press to reset Ah/Wh accumulated values (hold the button for 3-5 seconds until reset)");
  Serial.println("3. Prepare to record initial baseline power consumption");
  Serial.println("\nPress Enter in Arduino IDE to start testing...");
}

void loop() {
  // Wait for user input to start test
  if (testPhase == 0) {
    if (Serial.available() > 0) {
      Serial.read(); // Clear input buffer

      // Baseline power measurement
      Serial.println("\n----- Baseline Power Measurement -----");
      Serial.println("All LEDs are in the OFF state");
      Serial.println("[Operation Prompt] Please record the current voltage, current, and power values");
      Serial.println("[Operation Prompt] Press Enter to continue after measurement...");

      // Turn off all LEDs to ensure baseline state
      for (int i = 0; i < LED_COUNT; i++) {
        pinMode(LED_PINS[i], OUTPUT);
        digitalWrite(LED_PINS[i], LOW);
      }

      testPhase = 1;
    }
    return;
  }

  // Single LED test
  else if (testPhase == 1) {
    if (Serial.available() > 0) {
      Serial.read(); // Clear input buffer

      Serial.println("\n----- Test 1: Single LED Power Consumption Measurement -----");
      Serial.println("Each LED will be lit for 5 seconds in sequence");
      Serial.println("[Operation Prompt] Please record the voltage, current, and power values when each LED is on");
      Serial.println("Test starts automatically...\n");

      delay(2000);

      // Light up LEDs in sequence
      for (int i = 0; i < LED_COUNT; i++) {
        // First turn off all LEDs
        for (int j = 0; j < LED_COUNT; j++) {
          digitalWrite(LED_PINS[j], LOW);
        }

        // Light up the currently tested LED
        digitalWrite(LED_PINS[i], HIGH);

        Serial.print("LED ");
        Serial.print(i);
        Serial.println(" is ON - Record measurement values");

        // Wait for measurement
        delay(5000);
      }

      // Turn off all LEDs
      for (int i = 0; i < LED_COUNT; i++) {
        digitalWrite(LED_PINS[i], LOW);
      }

      Serial.println("\nSingle LED test completed");
      Serial.println("[Operation Prompt] Press Enter to continue the PWM brightness test...");

      testPhase = 2;
    }
    return;
  }

  // PWM brightness test
  else if (testPhase == 2) {
    if (Serial.available() > 0) {
      Serial.read(); // Clear input buffer

      Serial.println("\n----- Test 2: PWM Brightness Control and Power Consumption -----");
      Serial.println("LED 0 will be lit with different duty cycles");
      Serial.println("[Operation Prompt] Please record the voltage, current, and power values at different brightness levels");
      Serial.println("Test starts automatically...\n");

      delay(2000);

      // Various duty cycle tests
      int pwmValues[] = {64, 128, 192, 255};
      for (int i = 0; i < 4; i++) {
        analogWrite(LED_PINS[0], pwmValues[i]);

        Serial.print("LED 0 PWM duty cycle: ");
        Serial.print((pwmValues[i] / 255.0) * 100);
        Serial.println("% - Record measurement values");

        // Wait for measurement
        delay(5000);
      }

      // Turn off LED
      digitalWrite(LED_PINS[0], LOW);

      Serial.println("\nPWM brightness test completed");
      Serial.println("[Operation Prompt] Press Enter to continue all LED test...");

      testPhase = 3;
    }
    return;
  }

  // All LEDs simultaneously on test
  else if (testPhase == 3) {
    if (Serial.available() > 0) {
      Serial.read(); // Clear input buffer

      Serial.println("\n----- Test 3: All LEDs Simultaneously On -----");
      Serial.println("All LEDs will be lit simultaneously");
      Serial.println("[Operation Prompt] Please record the total voltage, current, and power values");
      Serial.println("Test starts automatically...\n");

      delay(2000);

      // Light up all LEDs
      for (int i = 0; i < LED_COUNT; i++) {
        digitalWrite(LED_PINS[i], HIGH);
      }

      Serial.println("All LEDs are ON - Record measurement values");

      // Wait for measurement
      delay(10000);

      // Turn off all LEDs
      for (int i = 0; i < LED_COUNT; i++) {
        digitalWrite(LED_PINS[i], LOW);
      }

      Serial.println("\nAll LED test completed");
      Serial.println("[Operation Prompt] Press Enter to start curve recording test...");

      testPhase = 4;
    }
    return;
  }

  // Curve recording test prompt
  else if (testPhase == 4) {
    if (Serial.available() > 0) {
      Serial.read(); // Clear input buffer

      Serial.println("\n----- Test 4: Curve Recording Test -----");
      Serial.println("[Operation Prompt] Short press multiple times to switch to function 5 (curve interface)");
      Serial.println("[Operation Prompt] Prepare to record LED flashing current changes");
      Serial.println("[Operation Prompt] Press Enter to start LED flashing...");

      testPhase = 5;
    }
    return;
  }

  // LED flashing test
  else if (testPhase == 5) {
    if (Serial.available() > 0) {
      Serial.read(); // Clear input buffer

      Serial.println("\nStarting LED flashing test - Observe curve changes");

      // Quickly flash all LEDs
      for (int cycle = 0; cycle < 5; cycle++) {
        // Turn on all LEDs
        for (int i = 0; i < LED_COUNT; i++) {
          digitalWrite(LED_PINS[i], HIGH);
        }
        Serial.println("All LEDs ON");
        delay(1000);

        // Turn off all LEDs
        for (int i = 0; i < LED_COUNT; i++) {
          digitalWrite(LED_PINS[i], LOW);
        }
        Serial.println("All LEDs OFF");
        delay(1000);
      }

      Serial.println("\nLED flashing test completed");
      Serial.println("[Operation Prompt] Short press to return to function 2 for the next round of testing");
      Serial.println("\n===== All testing procedures completed =====");
      Serial.println("Press Enter to restart the testing process...");

      testPhase = 0;
    }
    return;
  }
}PWM in the program is Pulse Width Modulation.
After uploading the program, open the serial monitor and follow the prompts. I recorded the screen prompts and YZXstudio ZY1271 USB voltage-current-capacity meter readings with a camera, as shown below.
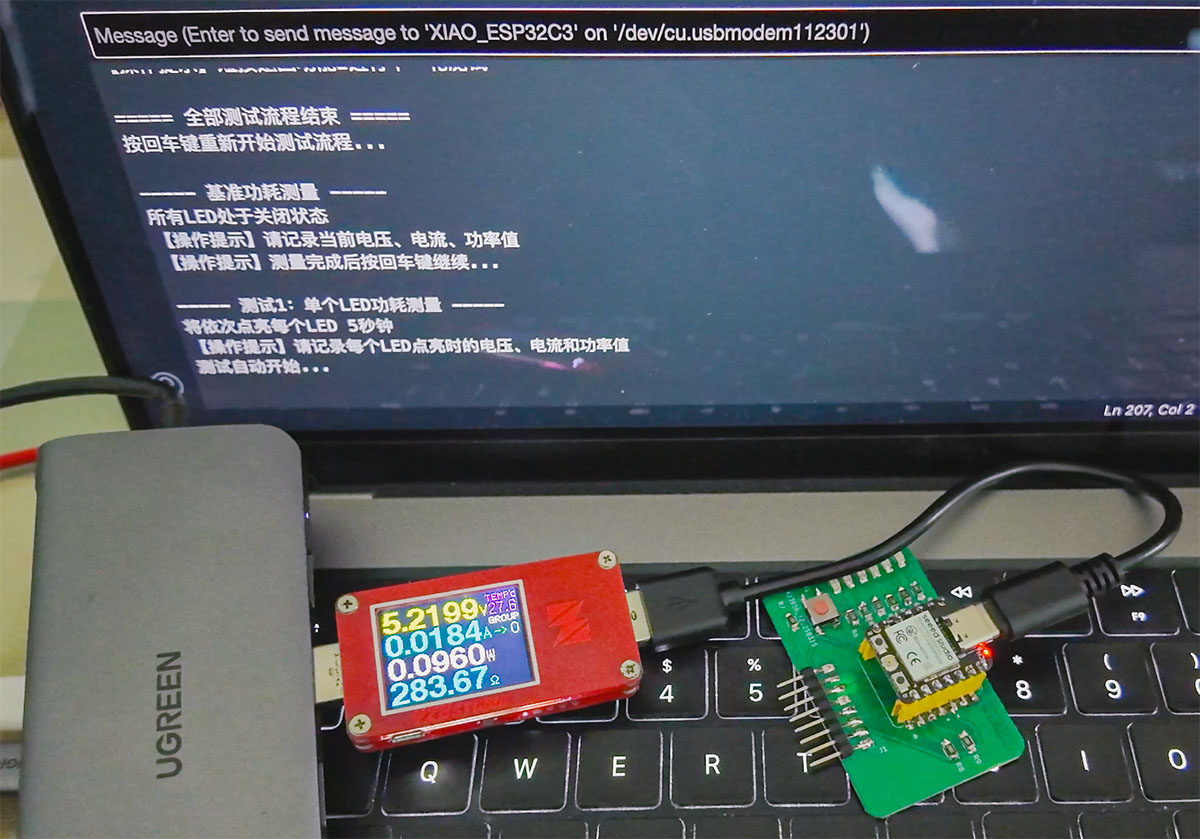
After uploading the program, open the serial monitor and follow the prompts
Measurement Results and Analysis
1. Baseline Power Consumption (All LEDs Off)
| Parameter | Measured Value |
|---|---|
| Voltage | 5.2199 V |
| Current | 0.0184 A |
| Power | 0.096 W |
This represents the basic power consumption of the development board, including the static power consumption of the ESP32C3 chip and other peripherals on the board.
2. Single LED Power Consumption Measurement
| LED Number | Voltage (V) | Current (A) | Power (W) | Incremental Current (mA) | Incremental Power (mW) |
|---|---|---|---|---|---|
| D0 | 5.2195 | 0.0208 | 0.1085 | 2.40 | 12.5 |
| D1 | 5.2194 | 0.021 | 0.1096 | 2.60 | 13.6 |
| D2 | 5.2193 | 0.0208 | 0.1085 | 2.40 | 12.5 |
| D3 | 5.2195 | 0.0208 | 0.1085 | 2.40 | 12.5 |
| D4 | 5.2194 | 0.021 | 0.1096 | 2.60 | 13.6 |
| D5 | 5.2194 | 0.0212 | 0.1106 | 2.80 | 14.6 |
From the measurement results, each LED adds approximately 2.4-2.8mA of current consumption.
3. PWM Brightness Control Power Consumption (D0 LED)
| PWM Duty Cycle (%) | Voltage (V) | Current (A) | Power (W) | Incremental Current Relative to Baseline (mA) |
|---|---|---|---|---|
| 25% (64/255) | 5.2196 | 0.0190 | 0.0991 | 0.6 |
| 50% (128/255) | 5.2196 | 0.0195 | 0.1017 | 1.1 |
| 75% (192/255) | 5.2194 | 0.0202 | 0.1054 | 1.8 |
| 100% (255/255) | 5.2194 | 0.0208 | 0.1085 | 2.4 |
The PWM control results show that the LED's power consumption is proportional to the duty cycle, confirming the working principle of PWM dimming: adjusting brightness by changing the proportion of LED on-time, rather than changing the voltage across the LED.
4. All LEDs Simultaneously On
| Parameter | Measured Value |
|---|---|
| Voltage | 5.2180 V |
| Current | 0.0339 A |
| Power | 0.1768 W |
| Increment Relative to Baseline | 15.5 mA / 80.8 mW |
When all LEDs are on simultaneously, the total incremental current is approximately 15.5mA, slightly higher than the sum of individual LED incremental currents (about 15.2mA), as shown below. This may be due to slight efficiency changes caused by power supply voltage drop.
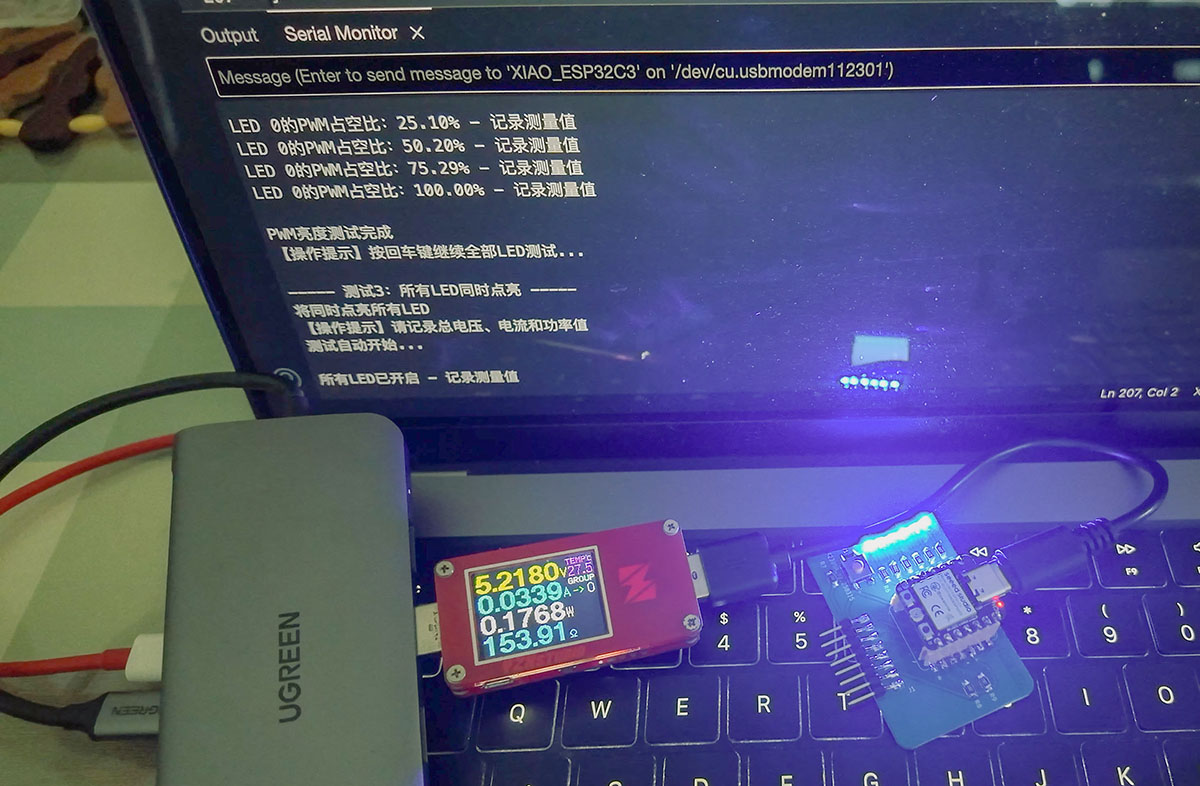
Reading when all LEDs are lit
LED Power Consumption Test Conclusions
- Single LED Power Consumption: Each LED consumes approximately 2.4-2.8mA of current at full brightness, with a power consumption of about 12.5-14.6mW.
- PWM Dimming Efficiency: Under PWM dimming, power consumption is linearly related to the duty cycle, confirming the high efficiency of digital PWM dimming.
- Overall Efficiency: The total power consumption increase when all six LEDs are lit is about 15.5mW, averaging about 2.6mW per LED.
- Uniform Current Distribution: The current consumption of the six LEDs is basically consistent, indicating balanced circuit design.
Part Two: Grove Mini Fan Power Consumption Measurement
Grove Mini Fan Introduction
The Grove Mini Fan is a small DC fan module with a standard Grove interface design that can be connected to microcontrollers without soldering. The fan is driven by a DC motor and can be controlled by a digital pin for on/off or by a PWM signal to adjust speed.
Basic Specifications:
- Operating voltage: 3.3V-5V
- Interface type: Digital
- Rated current: Approximately 130mA (5V power supply)
- With an AVR Atmega168 microcontroller-based DC motor driver
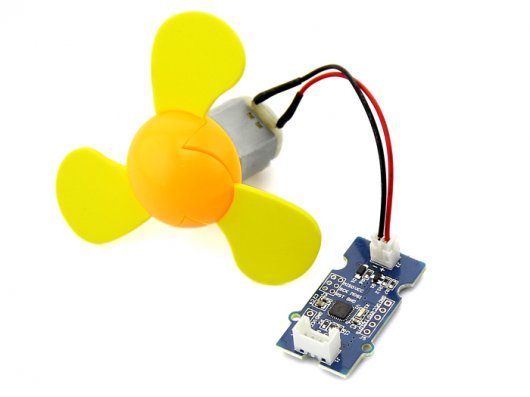
Grove - Mini Fan module is based on an AVR Atmega168 microcontroller DC motor driver
Experimental Setup
- Hardware Connection
- Connect the A5 of the Grove Mini Fan driver (most Grove sensor modules use A5 as the main signal line, so it's recommended to prioritize connecting A5 to D6) to the D6 pin of the XIAO ESP32C3 development board; connect the GND pin of the driver to the GND pin of the XIAO; connect the VCC pin of the driver to the 3V3 pin of the XIAO, as shown below.
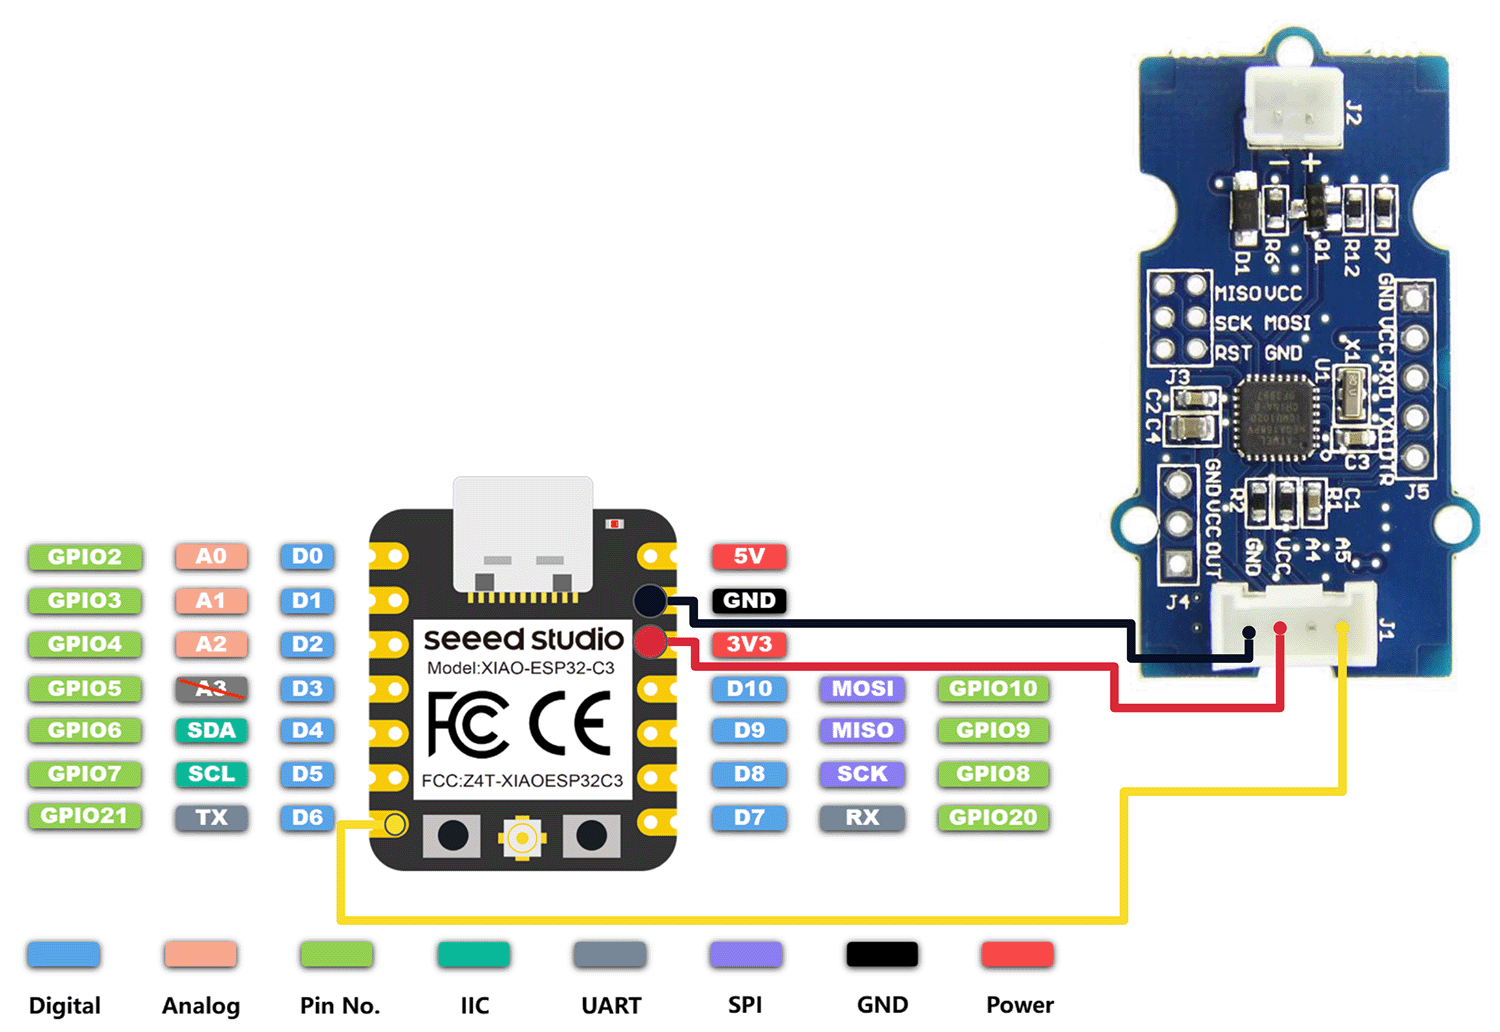
Wiring diagram of the Grove Mini Fan driver and XIAO ESP32C3
- Connect the YZXstudio ZY1271 USB voltage-current-capacity meter in series between the power supply and the development board.
- Connect the development board to the computer using a USB data cable.
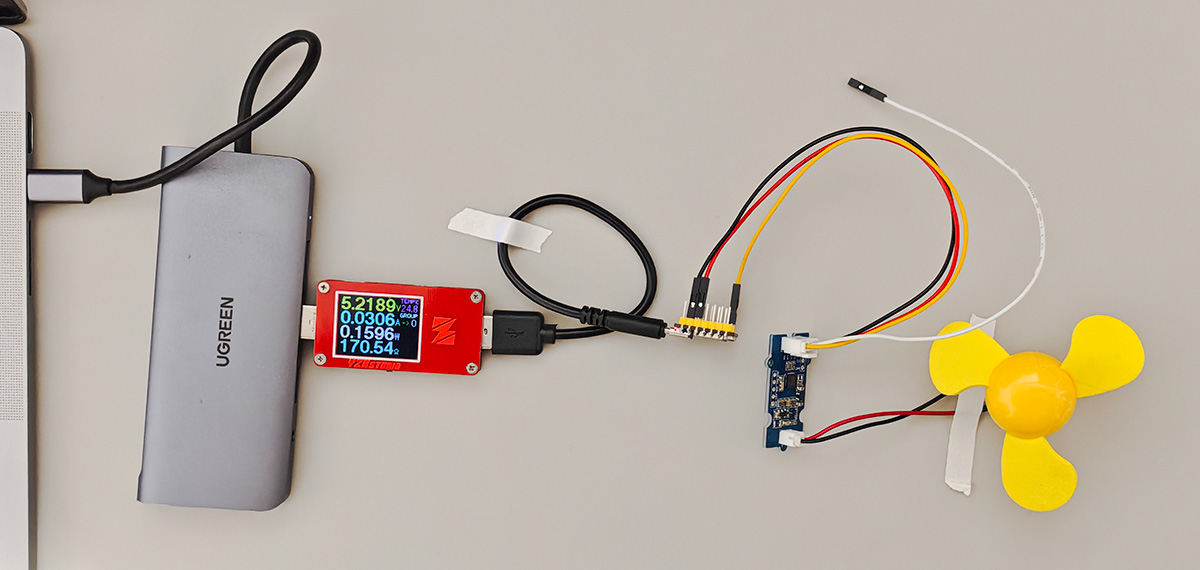
Physical connection diagram
- Test Program
// Grove Mini Fan Basic Test - Avoid instability caused by PWM
#define FAN_PIN D6  // Connect the fan to digital pin D6

// Test state marker
int testPhase = 0;

void setup() {
  Serial.begin(115200);

  // Wait for serial connection
  delay(2000);

  Serial.println("\n===== XIAO ESP32C3 Grove Mini Fan Basic Test =====");
  Serial.println("This is a simplified test program that only tests the fan's on/off state");
  Serial.println("to avoid connection instability issues caused by PWM control");
  Serial.println("\nPress Enter in Arduino IDE to start testing...");

  pinMode(FAN_PIN, OUTPUT);
  digitalWrite(FAN_PIN, LOW); // Fan off at start
}

void loop() {
  // Wait for user input to start test
  if (testPhase == 0) {
    if (Serial.available() > 0) {
      Serial.read(); // Clear input buffer

      // Baseline power measurement
      Serial.println("\n----- Baseline Power Measurement -----");
      Serial.println("Fan is in the OFF state");
      Serial.println("[Operation Prompt] Please record the current voltage, current, and power values as a baseline");
      Serial.println("[Operation Prompt] Press Enter to start the fan after completion...");

      digitalWrite(FAN_PIN, LOW); // Ensure fan is off

      testPhase = 1;
    }
    return;
  }

  // Fan full speed test
  else if (testPhase == 1) {
    if (Serial.available() > 0) {
      Serial.read(); // Clear input buffer

      Serial.println("\n----- Test: Fan Full Speed Running Power Consumption -----");
      Serial.println("Fan will start running");

      // Directly turn on the fan, not using PWM
      digitalWrite(FAN_PIN, HIGH);

      Serial.println("Fan is ON - Running at full speed");
      Serial.println("[Operation Prompt] Please record voltage, current, and power values");
      Serial.println("[Operation Prompt] Press Enter to turn off the fan after recording...");

      testPhase = 2;
    }
    return;
  }

  // Turn off fan
  else if (testPhase == 2) {
    if (Serial.available() > 0) {
      Serial.read(); // Clear input buffer

      Serial.println("\n----- Test End -----");
      Serial.println("Turning off the fan");

      // Turn off fan
      digitalWrite(FAN_PIN, LOW);

      Serial.println("Fan is OFF");
      Serial.println("[Operation Prompt] Long press the meter to reset accumulated data (Ah/Wh)");
      Serial.println("\n===== Testing process completed =====");
      Serial.println("Press Enter to restart the testing process...");

      testPhase = 0;
    }
    return;
  }
}Upload the program to the XIAO ESP32C3, open the serial monitor, and record according to the prompts.
Measurement Results and Analysis
Due to the large start-up current of the motor causing development board connection instability, we used a simplified test program, mainly measuring power consumption in fan off and full-speed running states. During the test, the YZXstudio ZY1271's curve recording function was used to capture the start-up current characteristics.
1. Fan Start-up Characteristics Measurement
Video recording of YZXstudio ZY1271 capturing fan start-up current characteristics:
| State | Voltage (V) | Current (A) | Power (W) | Notes |
|---|---|---|---|---|
| Stationary state | 5.2179 | 0.0308 | 0.1607 | Baseline power |
| Start-up peak | 5.1964 | 0.2019 | 1.0491 | At the moment of start-up |
| Stable running | 5.2032 | 0.1499 | 0.7799 | 1 second after start-up |
The fan shows a significant current peak during start-up, which is due to the DC motor needing to overcome static friction and rotor inertia, thus requiring a larger starting torque, corresponding to a larger starting current. This start-up current peak even caused momentary disconnection of the development board, confirming the high current demand of DC motor start-up characteristics.
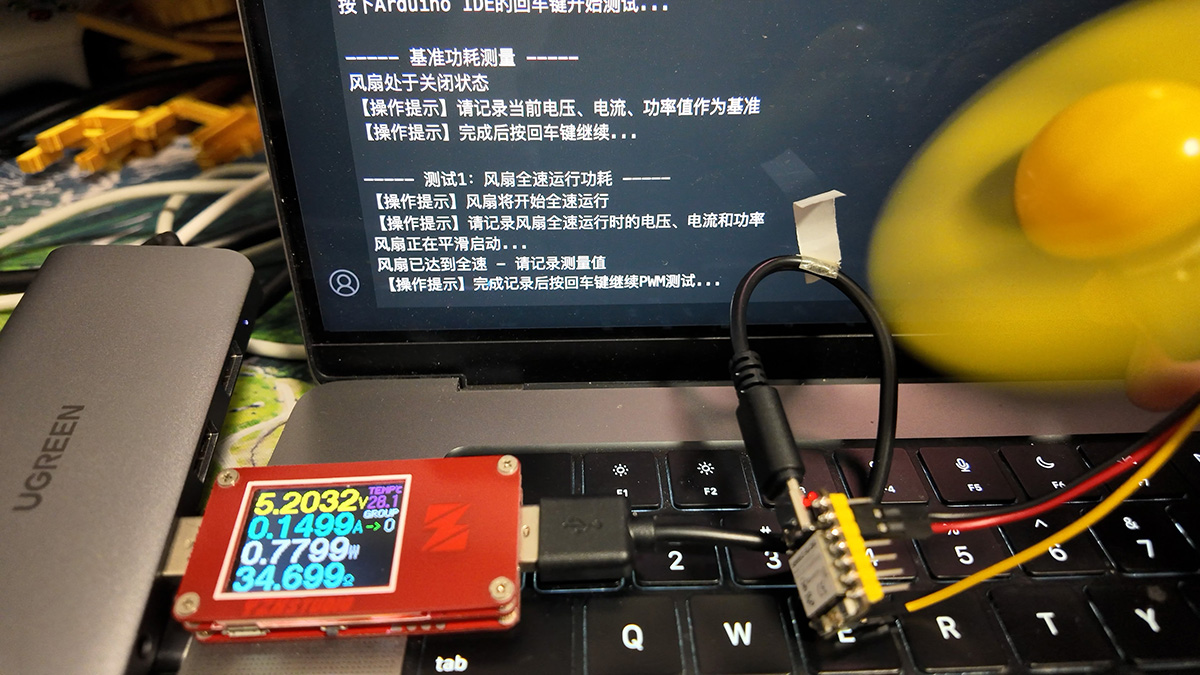
Reading when the motor is running stably at full speed
2. Load Test
Testing the effect of load changes on power consumption by slightly obstructing the fan blades:
| Load State | Voltage (V) | Current (A) | Power (W) | Notes |
|---|---|---|---|---|
| No load | 5.2041 | 0.1484 | 0.7722 | Free rotation |
| Slight obstruction | 5.2026 | 0.1610 | 0.8376 | Finger lightly touching fan housing |
| Heavy obstruction | 5.1928 | 0.2425 | 1.2592 | Near stall state |
When the fan load increases, the current also increases accordingly, which conforms to the working characteristics of DC motors. It's worth noting that the current value in the heavy obstruction state is close to the start-up peak current, indicating that the motor needs to produce a larger torque in both these states.
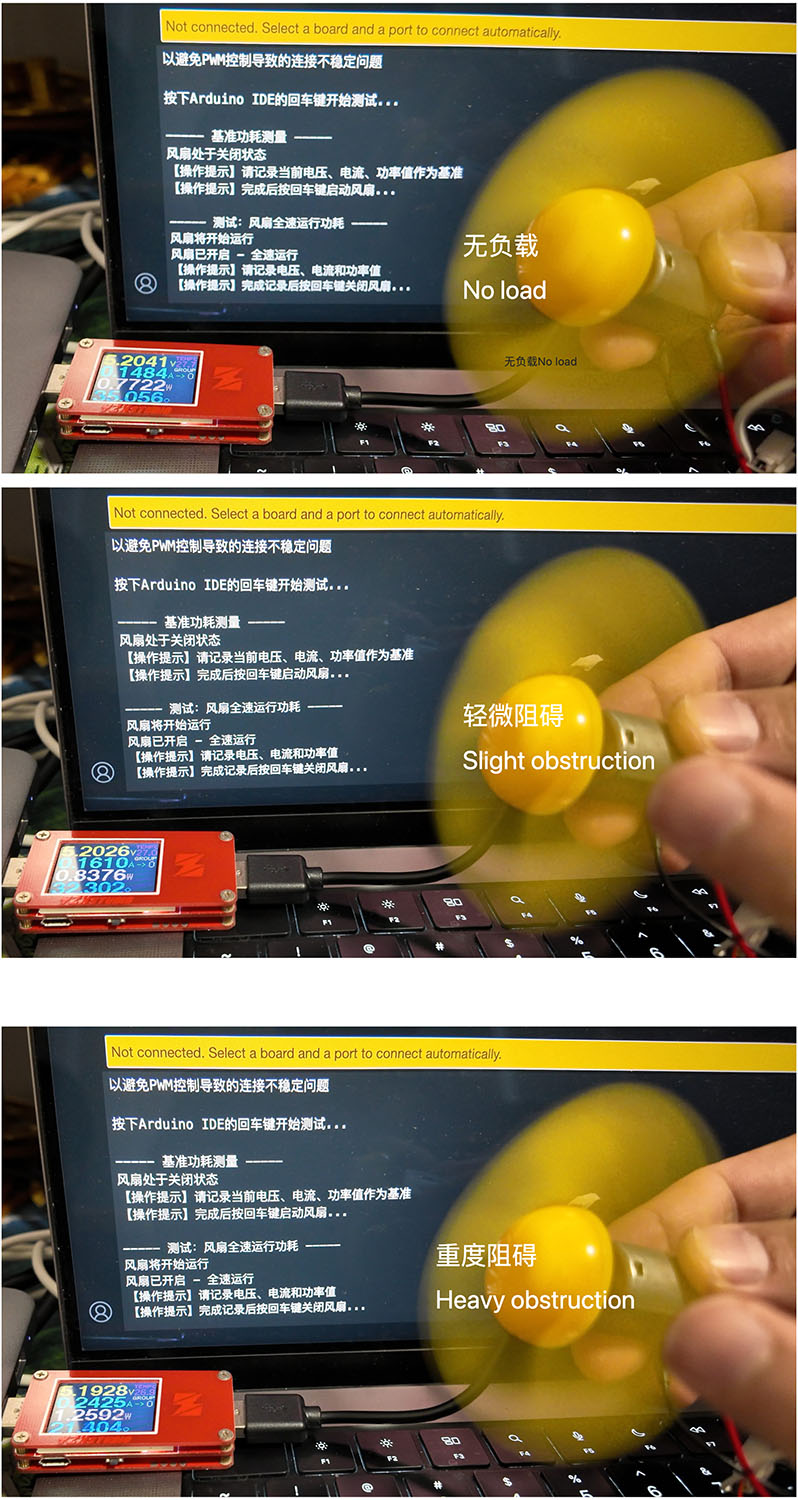
Readings for no load, slight obstruction, and heavy obstruction states
Grove Mini Fan Test Conclusions
- Start-up Characteristics: The fan has a significant current peak during start-up (about 202mA), about 35% higher than the stable running current (about 150mA), which is enough to cause power instability in the development board.
- Load Response: Increased load leads to increased current, as the motor attempts to maintain speed by increasing torque.
- Hardware Design Considerations: DC motor applications need to consider the impact of start-up current on the power supply system, and may require buffer measures such as adding filtering capacitors.
Part Three: GC9107 0.85" LCD Power Consumption Measurement
Linear Power Supply Introduction
Emkia 850 Linear Power Analyzer
Main Specifications:
| Parameter | Specification |
|---|---|
| Voltage Range | 0-12V DC |
| Current Range | 0-2A |
| Sampling Rate | 100KS/s |
| Measurement Accuracy | ±0.5% + 2mV |
| Waveform Analysis | True RMS & Transient Capture |
| Interface | USB-B |
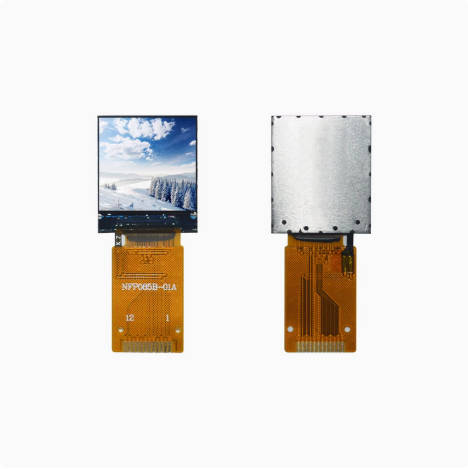
GC9107 0.85" LCD Introduction
GC9107 is a 0.85-inch LCD screen mainly used for low-power display applications.
Experimental Setup
- Expose XIAO ESP32S3 VBAT for power measurement
- Simulate 3.7V battery power to ensure experimental conditions are close to actual applications
- Measure no-load power consumption and power consumption with LCD connected
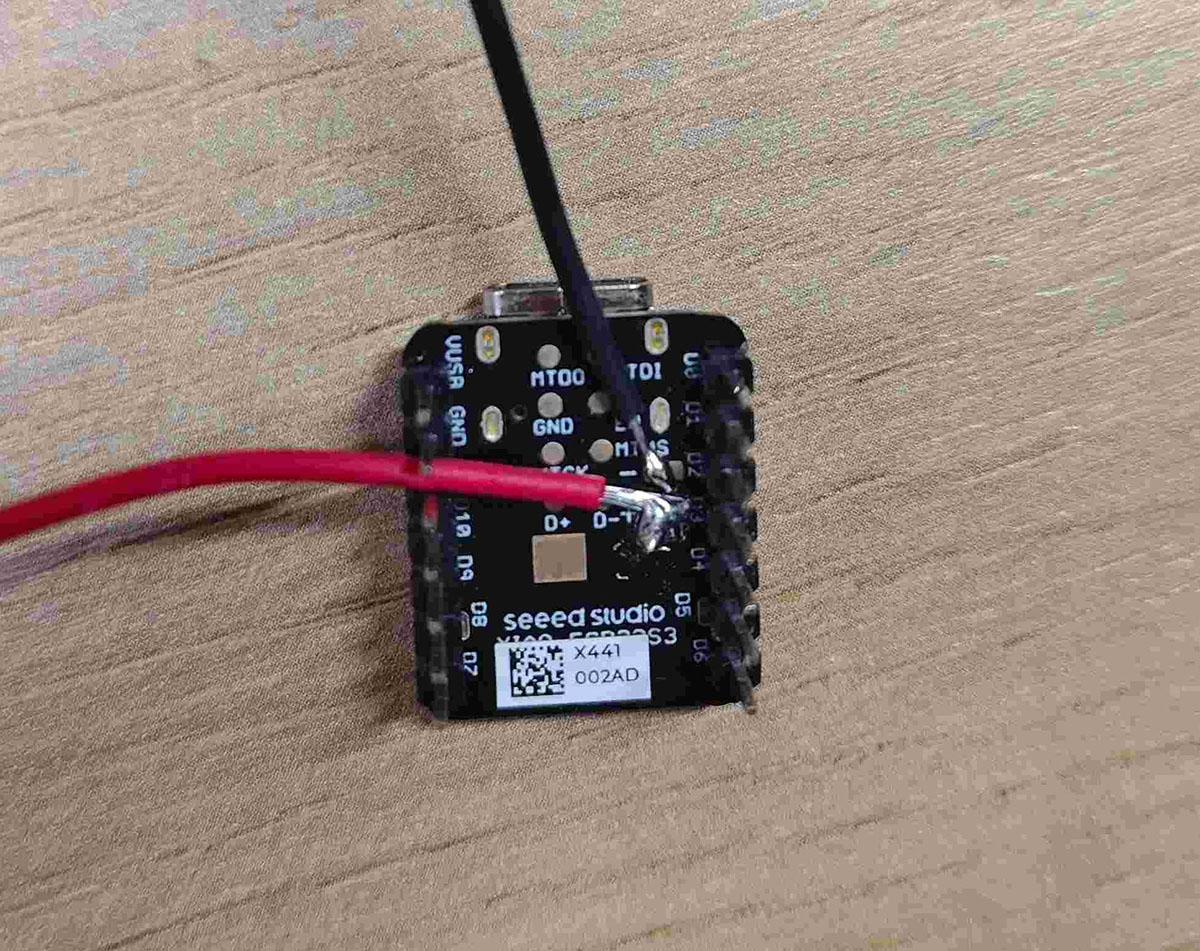
| XIAO ESP32S3 | Emkia Analyzer |
|---|---|
| BAT+ (3.7V) | Red terminal |
| BAT- (GND) | Black terminal |
Key Modifications:
- Remove the battery connector from the XIAO development board
- Install 2.54mm headers to facilitate power input
- Make a test fixture with shunt resistor
Measurement Results and Analysis
No-load Power Consumption (without LCD)
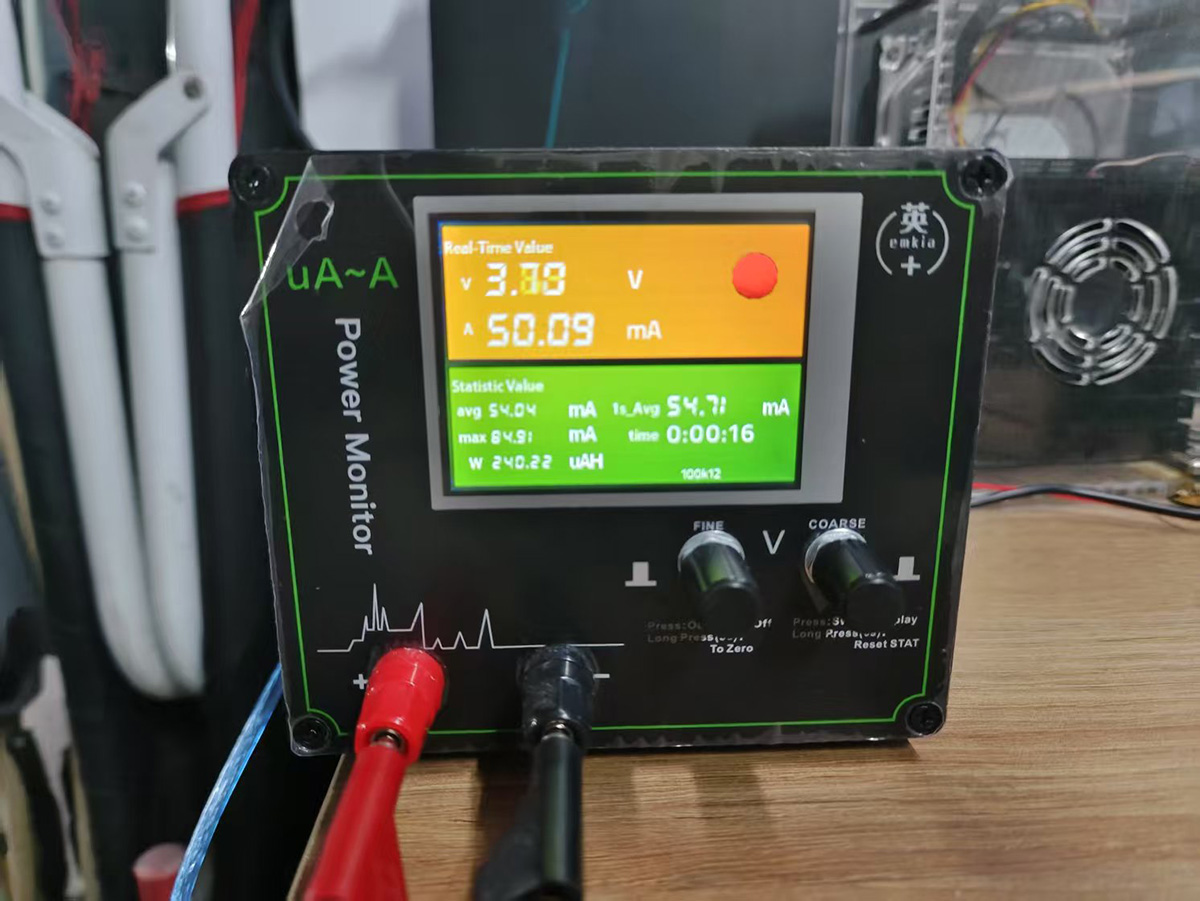
| Parameter | Value |
|---|---|
| Average Voltage | 3.70V |
| Average Current | 54.71mA |
| Power Consumption | 206.0mW |
Load Power Consumption (with LCD)
Uploading the test program, details can be seen at
1. Output Devices | Hongtai's Fab Academy Journal
#include "esp_err.h"
#include "esp_log.h"
#include "esp_check.h"

#include "openGlasses.h"

#include "lv_demos.h"

static const char *TAG = "app_main";

static lv_disp_t *lvgl_disp = NULL;

void app_main(void)
{
    lvgl_disp = bsp_lvgl_init();
    assert(lvgl_disp != NULL);

    // Lock the mutex due to the LVGL APIs are not thread-safe
    if (lvgl_port_lock(0))
    {
        lv_demo_benchmark();    /* A demo to measure the performance of LVGL or to compare different settings. */
        lvgl_port_unlock();
    }

    while (1)
    {
        printf("free_heap_size = %ld\n", esp_get_free_heap_size());
        vTaskDelay(1000 / portTICK_PERIOD_MS);
    }
}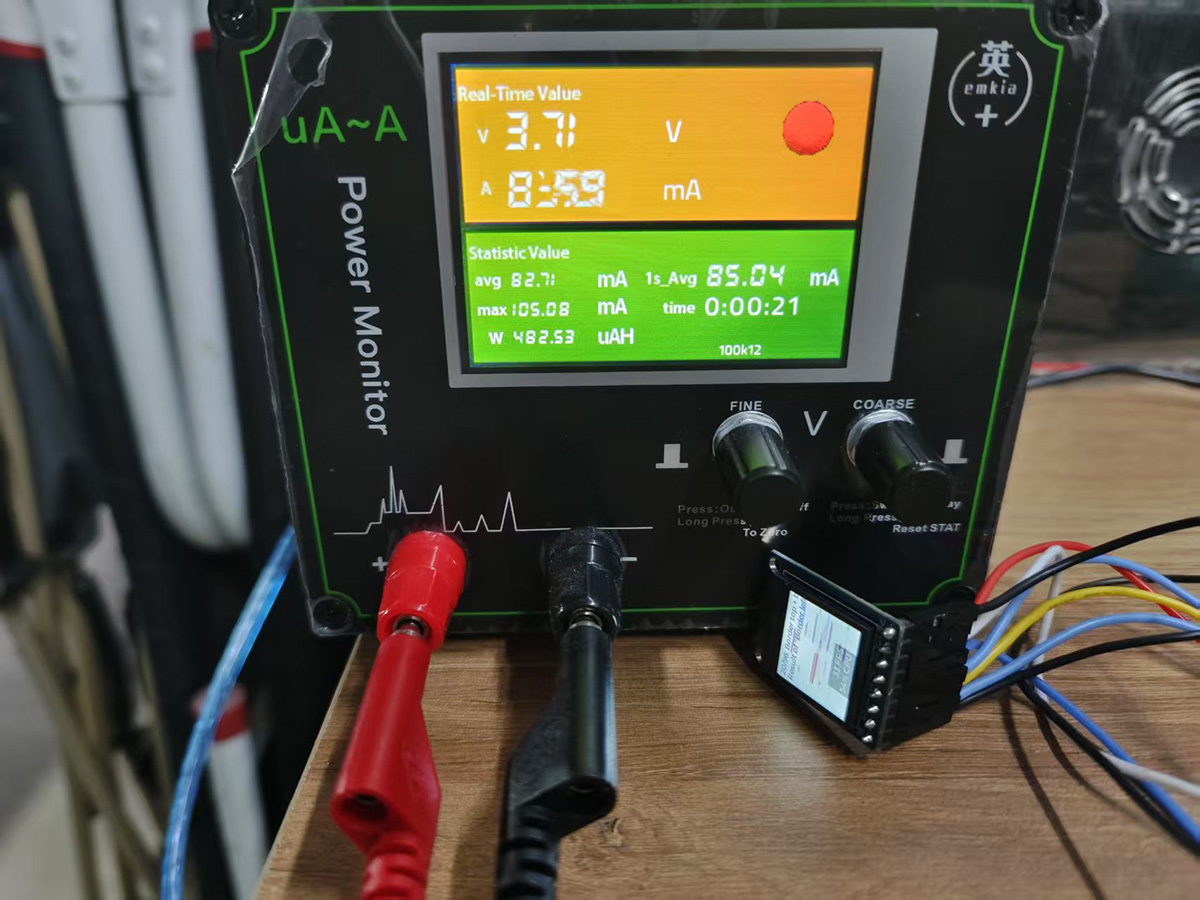
| Parameter | Value |
|---|---|
| Average Voltage | 3.70V |
| Average Current | 85.0mA |
| Power Consumption | 304.0mW |
Conclusion
The power consumption of the GC9107 0.85" LCD is approximately 96.0mW, 30% higher than the no-load power consumption. This power consumption level is within an acceptable range, but optimization strategies still need to be considered in low-power applications.
References
- Grove Mini Fan Official Wiki
- YZXstudio ZY1271 USB Voltage-Current-Capacity Meter User Manual
- Seeed Studio XIAO ESP32C3 Official Documentation
- Week 10 Syllabus
 Lei Feng Fab Academy 2025