Week 14 . Interface and application programming
Group Assignment
During the Group Assignment, Gevorg Malkhasyan and I explored and compared different tools that can be used to create user interfaces and establish Serial communication with a microcontroller. For the comparison, we selected three different environments: Processing + G4P, Python + Tkinter, and Node-RED.
To make the comparison as fair as possible, we implemented the same task in all three environments: controlling the LED of a XIAO RP2040 board through Serial communication. We first created firmware that could receive the commands LED_ON and LED_OFF and return information about the current LED state. After that, we built a simple user interface in each environment that connected to the board and allowed the LED to be controlled from the computer.
| Tool | Processing + G4P | Python + Tkinter | Node-RED |
|---|---|---|---|
| Language | Java-like | Python | Visual + JavaScript |
| Interface Type | Desktop GUI | Desktop GUI | Browser Dashboard |
| Serial Communication | Built-in Serial library | pyserial | Serial nodes |
| Difficulty Level | Medium | Medium | Easy |
| Time to Working Result | ~30 min | ~25 min | ~15 min |
For Processing, we used the G4P library to create buttons and a status display area. In Python, we implemented the same task using Tkinter and the pyserial library, while in Node-RED we built a dashboard using ready-made nodes. Although each tool used a different approach, the final result was the same: all three solutions successfully communicated with the XIAO RP2040 board and were able to control the LED.
During the process, we compared the installation procedure, the workflow for building interfaces, the implementation of Serial communication, and the overall development experience. Processing felt familiar because of its similarity to the Arduino IDE, Python provided greater flexibility and programming possibilities, and Node-RED allowed us to achieve a working result very quickly through a visual programming approach.
Reflection
This assignment helped me better understand how different software environments communicate with microcontrollers and how the same task can be implemented using different technologies. It was interesting to see that although all three tools achieved the same goal, the development process and workflow were quite different.
For me, Processing was the easiest environment to understand because its structure is very similar to the Arduino IDE, making the Serial communication process more transparent and easier to follow. Python + Tkinter demonstrated how more flexible desktop applications can be created, while Node-RED showed how quickly a functional interface can be built using visual tools and preconfigured components.
Overall, this comparison helped me evaluate the strengths and limitations of each tool and gain a better understanding of which environments may be more suitable for different types of projects. Implementing the same task in multiple environments was a valuable learning experience and provided a broader perspective on GUI development and Serial communication.
The complete documentation of the Group Assignment can be found here: Group Assignment Page
Individual assignment
Introduction to Processing
For this assignment, I used Processing as the main development environment for creating a graphical user interface and establishing Serial communication with my Arduino-based system.
Processing is an open-source programming environment and language designed for creating visual applications, interactive graphics, and digital projects. It is based on Java and provides a simple structure that makes it easier to work with graphics, animations, user interactions, and external devices.
One of the advantages of Processing is its ability to communicate with hardware devices through libraries such as processing.serial, which allows data exchange between a computer and microcontrollers like Arduino. This makes Processing a useful tool for developing graphical interfaces that can display real-time sensor data and control embedded systems.
For this project, Processing was used together with the G4P library to create a graphical user interface that receives data from sensors connected to the microcontroller and displays the information in a clear and interactive way.
The official Processing website can be found here: Processing
Installing and Setting Up the G4P Library and GUI Builder
For my project, I needed to create a convenient and visually clear graphical user interface through which it would be possible to control the system and display data. For this purpose, I downloaded the G4P library in the Processing environment.
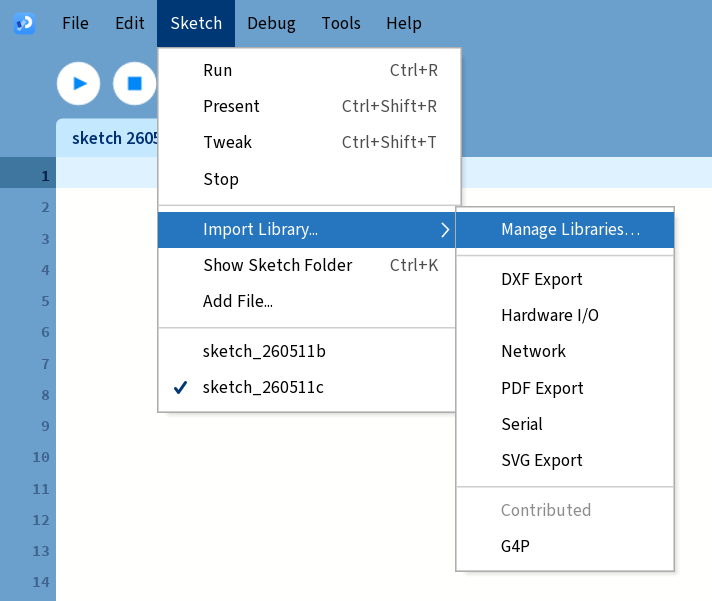
First, I opened Sketch → Import Library → Manage Libraries… in Processing to access the Library Manager.
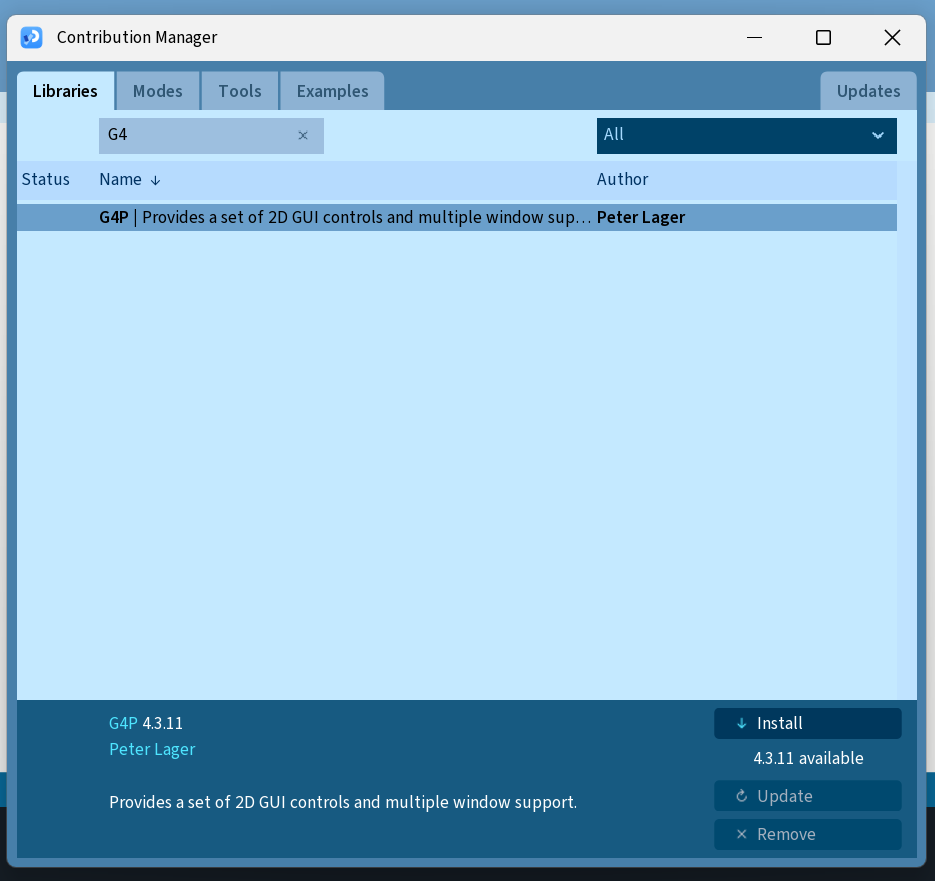
Then, in the opened Contribution Manager window, I typed G4P in the search field, selected the G4P library, and clicked Install.
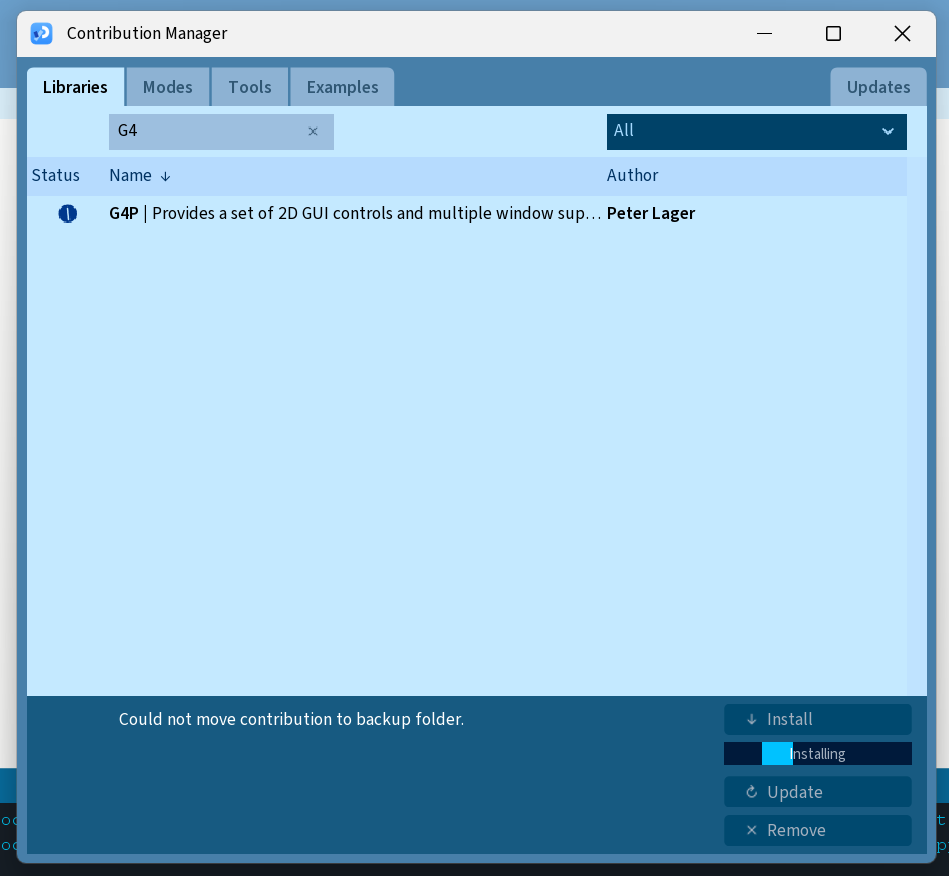
After the installation was completed, the G4P library was successfully installed and ready to be used in my program.
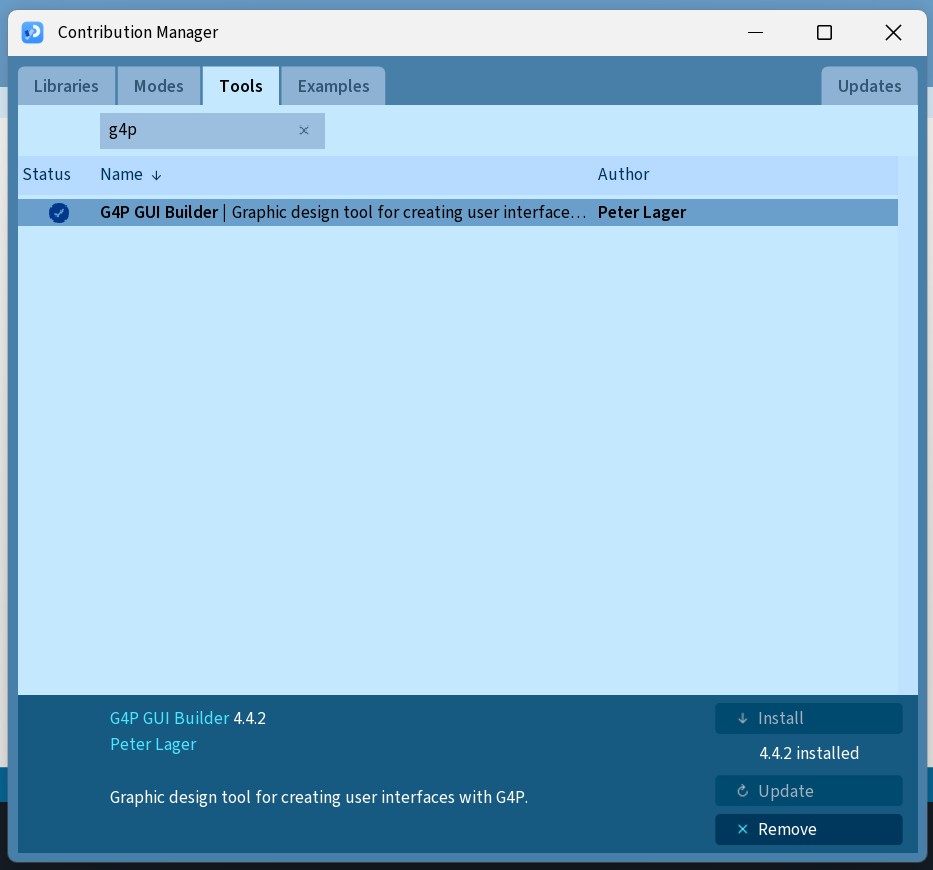
The G4P library also includes the G4P GUI Builder tool, which allows the interface to be created visually. With it, different elements such as buttons, text fields, and sliders can be easily added, while the program automatically generates the corresponding code. This makes the GUI creation process faster and more convenient, which is why I also installed G4P GUI Builder from the Tools section of the Contribution Manager.
After installing the G4P library and the G4P GUI Builder tool, I proceeded with the work and started developing the graphical user interface and implementing the main part of the project.
Board Setup
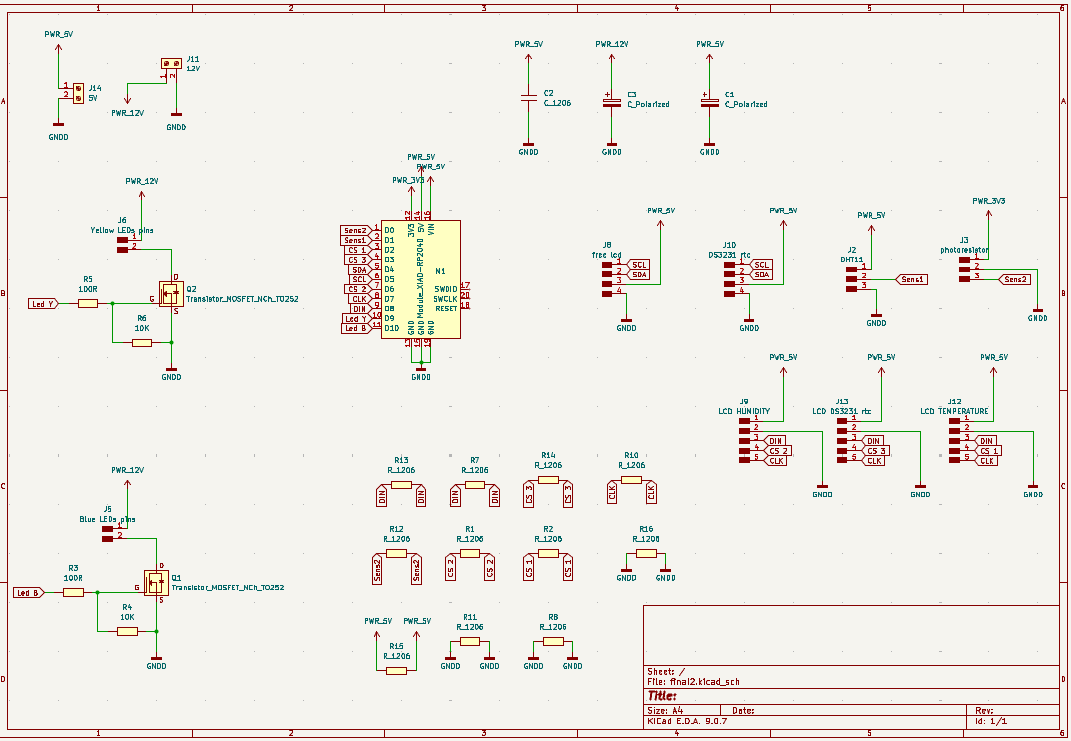
In this project, I used my embedded board that I had designed and prepared during the previous weeks. The required sensors were already connected to the board, including the DHT11 temperature and humidity sensor, the DS3231 RTC (Real-Time Clock) module, and the LDR light sensor.
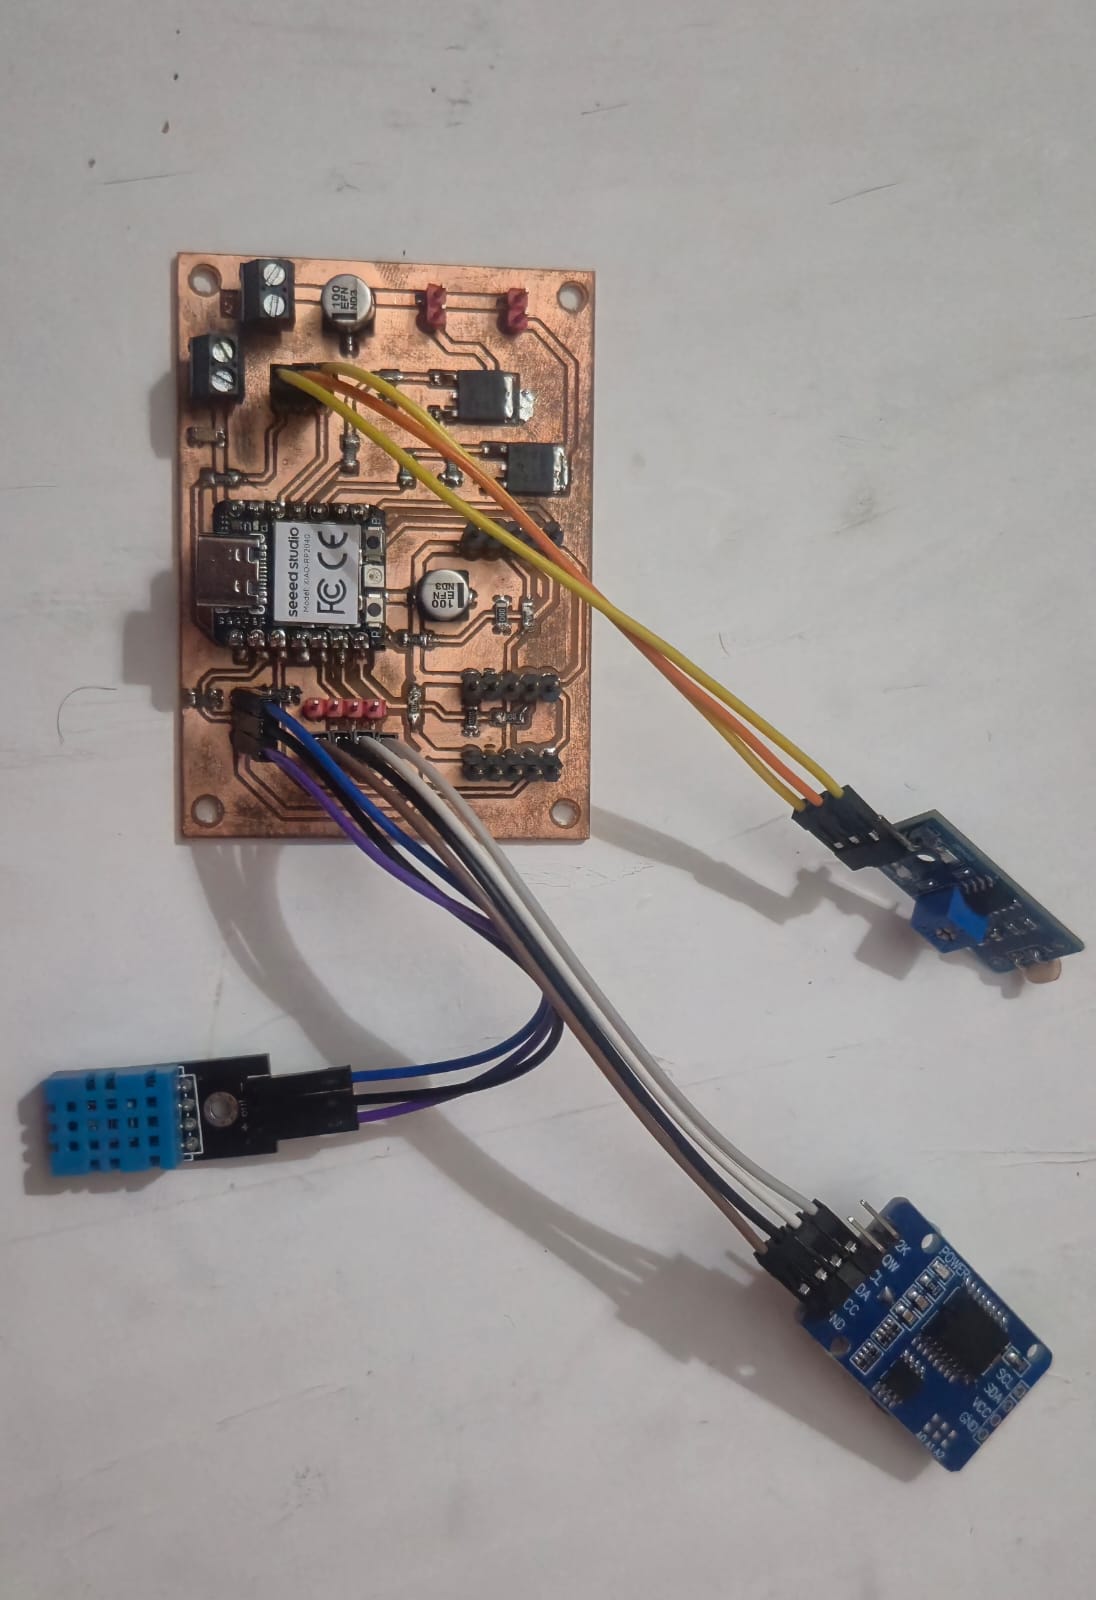
The schematic design, PCB design, and fabrication process of the board were completed during Week 9. Then, during Week 10, I tested all the sensors connected to the board to verify their correct operation.
Hardware Troubleshooting
The assignment was to write a program for my embedded board that would connect the user with the input and/or output devices of the system.
However, during the process, a problem occurred when I connected the DS3231 sensor to my board. The power LED on the module did not turn on, which indicated that the sensor was not receiving power.
Because of that, I started checking all the connections to make sure that VCC and GND were correctly connected.
Later, I connected the DS3231 module separately on a breadboard, and it worked properly—the power LED turned on. This confirmed that the sensor itself was functioning correctly.
Therefore, I concluded that the issue was related to the connections on my designed board. Most likely, during soldering, some of the pins were accidentally shorted, which prevented proper power delivery to the sensor.
Arduino Communication with the RTC module
After solving the issue related to the DS3231 module and checking all the connections, I moved on to the software implementation stage. At this stage, I wrote code in the Arduino IDE environment to establish communication between the computer and the RTC (Real Time Clock) module using Serial communication.
First, the necessary libraries were included in the program: Wire.h and RTClib.h. The Wire.h library is used for I2C communication, while RTClib.h makes it easier to work with the DS3231 module and retrieve or modify the current time.
#include <Wire.h>
#include "RTClib.h"

RTC_DS3231 rtc;

void setup () {
  Serial.begin(9600);

  if (!rtc.begin()) {
    Serial.println("Couldn't find RTC");
    while (1);
  }

  // If RTC lost power, set it to compile time
  if (rtc.lostPower()) {
    rtc.adjust(DateTime(F(__DATE__), F(__TIME__)));
  }
}

void loop () {

  DateTime now = rtc.now();

  Serial.print(now.year(), DEC);
  Serial.print('/');
  Serial.print(now.month(), DEC);
  Serial.print('/');
  Serial.print(now.day(), DEC);
  Serial.print(" ");

  Serial.print(now.hour(), DEC);
  Serial.print(':');

  Serial.print(now.minute(), DEC);
  Serial.print(':');

  Serial.print(now.second(), DEC);

  Serial.println();

  delay(1000);
}
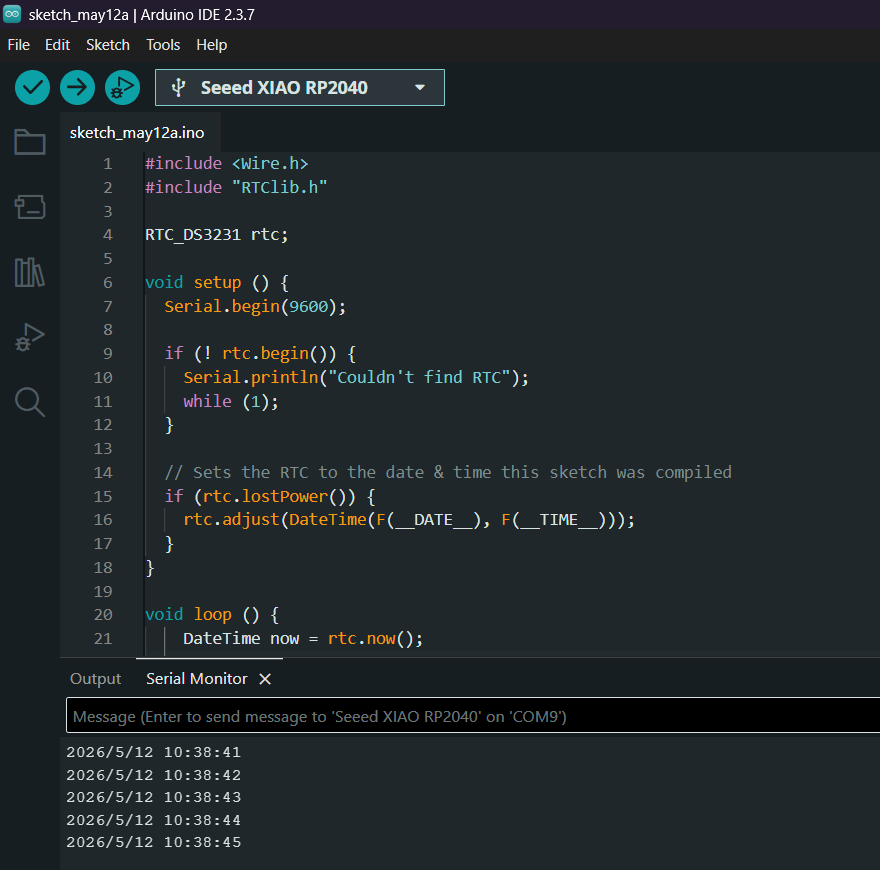
Write an Arduino program for a microcontroller that communicates with a DS3231 Real-Time Clock (RTC) module using I2C communication. The program should check whether the RTC module is connected correctly, detect if the RTC has lost power, set the time automatically using the compilation time, and continuously read and send the current date and time through the Serial Monitor every second.
The Arduino code retrieved the current time from the DS3231 module and sent it through the Serial port.
Creating the First Processing Interface
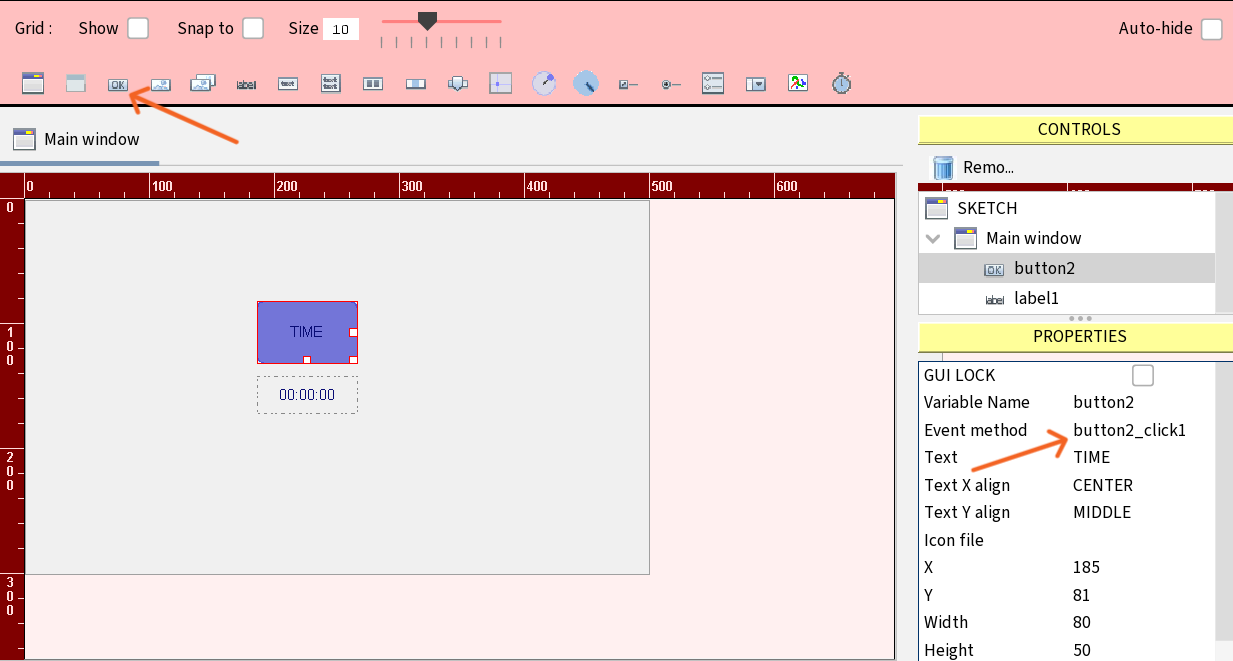
After that, I created a new sketch in the Processing environment, opened the G4P GUI Builder, and created a button named TIME. The button was designed so that when pressed, the current time would be displayed in the program. Then, I included the necessary libraries in Processing: G4P controls and the SimpleDateFormat and Date classes used for handling time and date.
Next, Serial communication was implemented between Processing and Arduino. For this purpose, the processing.serial.* library was included, making it possible to read the data sent from Arduino. The program continuously received text data through the Serial port and stored it in a variable so it could later be displayed in the graphical interface.
import g4p_controls.*;
import java.text.SimpleDateFormat;
import java.util.Date;

GButton btn;

String currentTime = "";

void setup() {

  size(500, 300, JAVA2D);

  // TIME Button
  btn = new GButton(this, 180, 70, 140, 40);
  btn.setText("TIME");

  textAlign(CENTER, CENTER);
  textSize(32);
}

void draw() {

  background(220);

  fill(0);

  // Show Time
  text(currentTime, width/2, 180);
}

// Button event
void handleButtonEvents(GButton button, GEvent event) {

  if (button == btn && event == GEvent.CLICKED) {

    currentTime =
      new SimpleDateFormat("HH:mm:ss").format(new Date());
  }
}
Create a Processing graphical interface using the G4P library that includes a button for displaying the current time. When the button is pressed, the program should capture the current system time using Java date functions and display it on the screen. The interface should contain a simple layout with a clear text display area for showing the time.
Then, an event handler was added for the created TIME button, making it possible to display the current time from the RTC module on the screen whenever the button was pressed.
public void button2_click1(GButton source, GEvent event) {

  String now =
    new SimpleDateFormat("dd/MM/yyyy   HH:mm:ss")
    .format(new Date());

  label1.setText(now);
}
Integrating Multiple Sensors
Since my Final Project includes three different sensors—the DHT11 temperature and humidity sensor, the DS3231 RTC real-time clock module, and an LDR light sensor—it was necessary to create a program that can read data from all sensors simultaneously and send it to the computer.
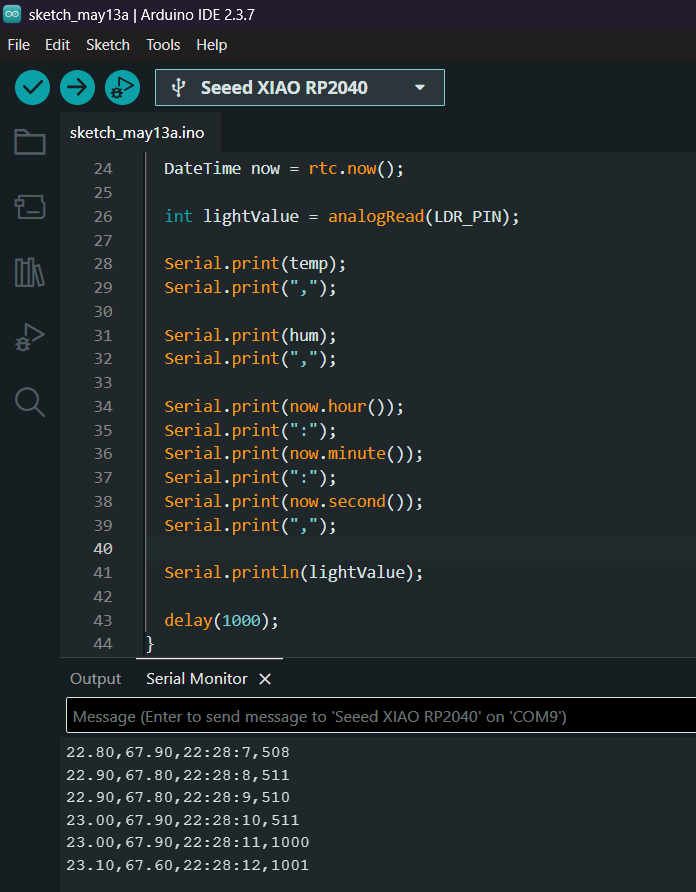
For this purpose, the following code was written in the Arduino IDE, which sends the data collected from each sensor to the Serial Monitor.
The program first includes the required libraries (Wire.h, RTClib.h, and DHT.h) and then defines the pin connections for the sensors. In the setup() function, Serial communication and the initial configuration of the sensors are initialized, while in the loop() function, the temperature, humidity, time, and light values are continuously read.
The collected data is then sent via Serial as a single line in a comma-separated format, so that it can be easily processed later in the Processing environment.
#include <Wire.h>
#include "RTClib.h"
#include "DHT.h"

#define DHTPIN 27
#define DHTTYPE DHT11
#define LDR_PIN 26

DHT dht(DHTPIN, DHTTYPE);
RTC_DS3231 rtc;

void setup() {
  Serial.begin(9600);

  dht.begin();
  rtc.begin();
}

void loop() {

  float temp = dht.readTemperature();
  float hum = dht.readHumidity();

  DateTime now = rtc.now();

  int lightValue = analogRead(LDR_PIN);

  Serial.print(temp);
  Serial.print(",");

  Serial.print(hum);
  Serial.print(",");

  Serial.print(now.hour());
  Serial.print(":");
  Serial.print(now.minute());
  Serial.print(":");
  Serial.print(now.second());
  Serial.print(",");

  Serial.println(lightValue);

  delay(1000);
}
Write an Arduino program for a microcontroller that reads data from multiple sensors: a DHT11 temperature and humidity sensor, a DS3231 Real-Time Clock module, and an LDR light sensor. The program should initialize all sensors, collect temperature, humidity, current time, and light intensity values, and send the collected data through Serial communication in a comma-separated format every second so it can be received and visualized in a graphical interface.
Developing the Processing GUI
Now let’s move on to the Processing program.
At the beginning of the program, I imported the required libraries: g4p_controls for creating graphical interface elements, processing.serial for establishing serial communication with Arduino, and java.awt.Font for modifying the size and appearance of text.
import g4p_controls.*;

import g4p_controls.*;
import processing.serial.*;
import java.awt.Font;
Then I created variables to store the data coming from Arduino: temperature (temp), humidity (hum), time (tim), and light sensor value (light). The initial values were set to "---" so that the interface would not show empty fields before receiving any data․
String temp = "---";
String hum = "---";
String tim = "---";
String light = "---";
In the setup() function, I created the main program window (500×300). Then I added four buttons:
TIME — for displaying time data,
TEMPERATURE — for temperature values,
HUMIDITY — for humidity values,
PHOTORESISTOR — for light sensor data.
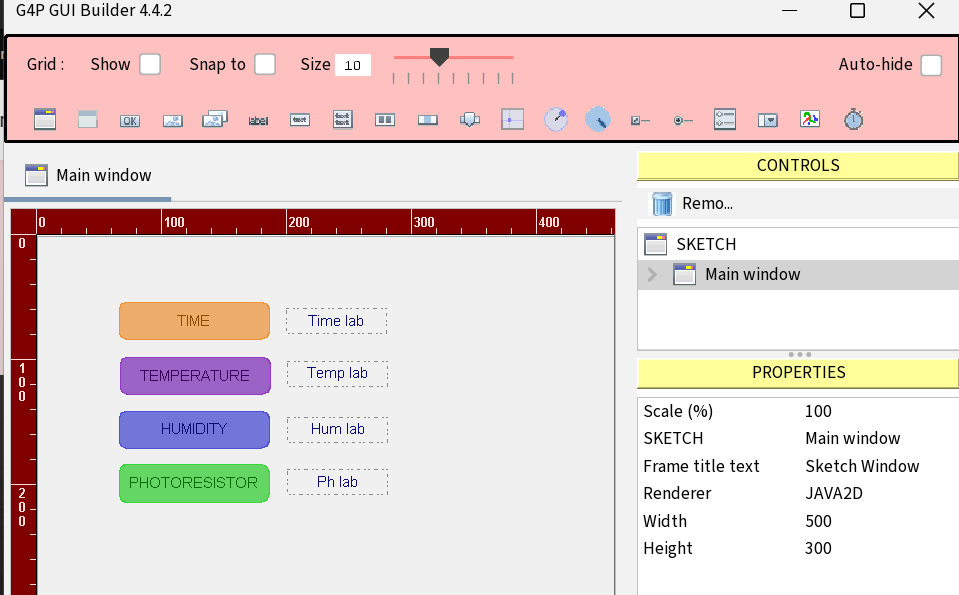
For each button, I created a corresponding label, where the sensor data would be displayed. I also changed the label font to a larger and bold style (Arial Bold, 20) to make the values easier to read.
Different color schemes were applied to the buttons, which made the interface more visual and user-friendly.
To establish communication with Arduino, I used serial communication:
myPort = new Serial(this, Serial.list()[0], 9600);
Here, the program connects to the first available COM port and runs at a 9600 baud rate.
The serialEvent() function receives the incoming data from Arduino, splits it into separate parts, and stores them in the corresponding variables: temperature, humidity, time, and light level.
void serialEvent(Serial myPort) {

  String data = myPort.readStringUntil('\n');

  if (data == null) return;

  data = trim(data);

  String[] parts = split(data, ',');

  if (parts.length == 4) {

    temp = parts[0];
    hum = parts[1];
    tim = parts[2];
    light = parts[3];
  }
}
The handleButtonEvents() function controls the button interactions. Each time a button is pressed, it displays the corresponding sensor value.
void handleButtonEvents(GButton button, GEvent event) {

  if (button == b1) {
    timeLab.setText(tim);
  }

  if (button == b2) {
    tempLab.setText(temp);
  }

  if (button == b3) {
    humLab.setText(hum);
  }

  if (button == b4) {
    lightLab.setText(light);
  }
}
Final Result
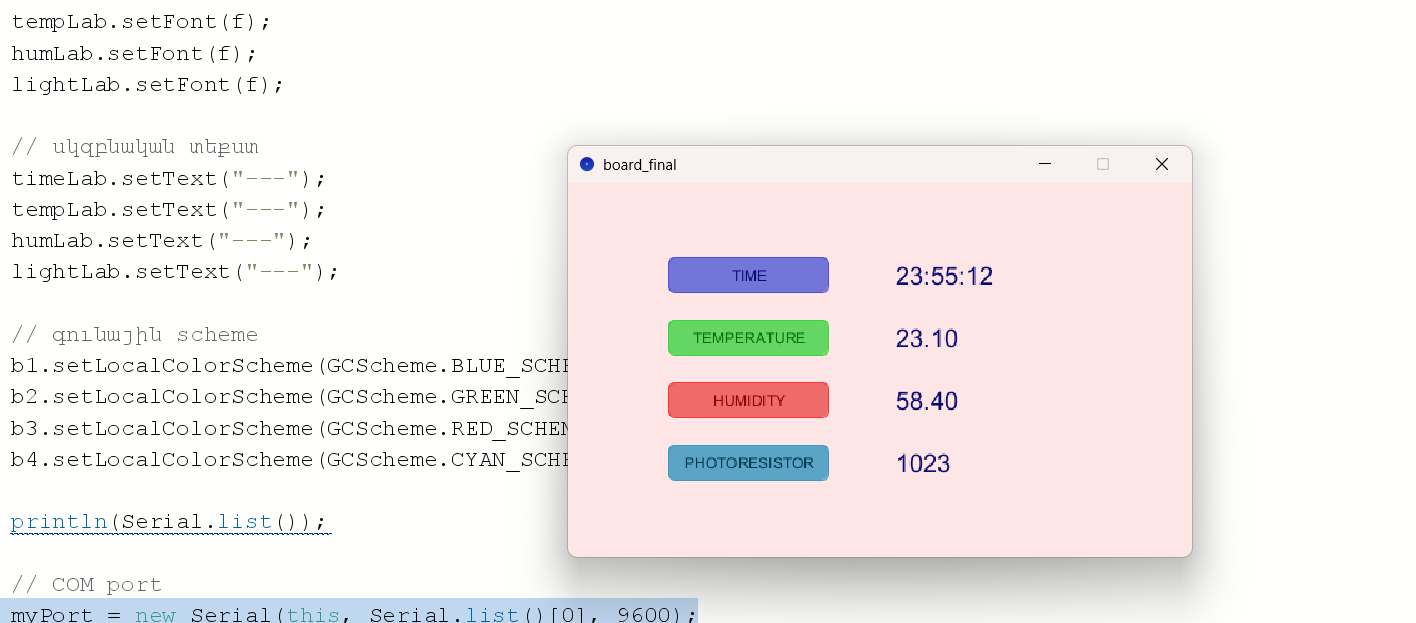
Thus, a simple graphical system was created, allowing separate visualization of different data received from Arduino.
Below is the complete sketch code:
import g4p_controls.*;
import processing.serial.*;
import java.awt.Font;

Serial myPort;

// data
String temp = "---";
String hum = "---";
String tim = "---";
String light = "---";

// labels
GLabel tempLab, humLab, timeLab, lightLab;

// buttons
GButton b1, b2, b3, b4;

void setup() {

  size(500, 300);

  // background
  background(255, 230, 230);

  // buttons
  b1 = new GButton(this, 80, 60, 130, 30, "TIME");
  b2 = new GButton(this, 80, 110, 130, 30, "TEMPERATURE");
  b3 = new GButton(this, 80, 160, 130, 30, "HUMIDITY");
  b4 = new GButton(this, 80, 210, 130, 30, "PHOTORESISTOR");

  // labels
  timeLab = new GLabel(this, 260, 60, 180, 30);
  tempLab = new GLabel(this, 260, 110, 180, 30);
  humLab = new GLabel(this, 260, 160, 180, 30);
  lightLab = new GLabel(this, 260, 210, 180, 30);

  // font
  Font f = new Font("Arial", Font.BOLD, 20);

  timeLab.setFont(f);
  tempLab.setFont(f);
  humLab.setFont(f);
  lightLab.setFont(f);

  // default text
  timeLab.setText("---");
  tempLab.setText("---");
  humLab.setText("---");
  lightLab.setText("---");

  // color schemes
  b1.setLocalColorScheme(GCScheme.BLUE_SCHEME);
  b2.setLocalColorScheme(GCScheme.GREEN_SCHEME);
  b3.setLocalColorScheme(GCScheme.RED_SCHEME);
  b4.setLocalColorScheme(GCScheme.CYAN_SCHEME);

  println(Serial.list());

  // COM port
  myPort = new Serial(this, Serial.list()[0], 9600);
  myPort.bufferUntil('\n');
}

void draw() {

  background(255, 230, 230);
}

// SERIAL
void serialEvent(Serial myPort) {

  String data = myPort.readStringUntil('\n');

  if (data == null) return;

  data = trim(data);

  String[] parts = split(data, ',');

  if (parts.length == 4) {

    temp = parts[0];
    hum = parts[1];
    tim = parts[2];
    light = parts[3];
  }
}

// BUTTONS
void handleButtonEvents(GButton button, GEvent event) {

  if (button == b1) {
    timeLab.setText(tim);
  }

  if (button == b2) {
    tempLab.setText(temp);
  }

  if (button == b3) {
    humLab.setText(hum);
  }

  if (button == b4) {
    lightLab.setText(light);
  }
}
Create a Processing graphical user interface using the G4P library that communicates with an Arduino board through the Serial port. The program should receive sensor data sent from Arduino in a comma-separated format and separate it into temperature, humidity, time, and light values. The interface should include buttons for each parameter and display the selected sensor data using labels. Use clear text formatting and different button color schemes to create a simple and user-friendly visualization system.
This interface successfully displayed the data received from the Arduino. As the next step, I decided to extend its functionality by adding a graphical visualization of the collected data.
In addition to the main assignment, I carried out an extra experiment. I created a graph that displays temperature changes on the screen in real time. The data is updated every second, making it possible to continuously monitor temperature fluctuations.
import processing.serial.*;

Serial myPort;

// Current values
float temperature = 0;
float humidity = 0;
int light = 0;
String clock = "--:--:--";

// Graph
int graphWidth = 600;
float[] graph = new float[graphWidth];

PFont fontBig;
PFont fontSmall;

void setup() {

  size(900, 500);

  fontBig = createFont("Arial Bold", 28);
  fontSmall = createFont("Arial", 16);

  background(20);

  println(Serial.list());


  myPort = new Serial(this, Serial.list()[0], 9600);
  myPort.bufferUntil('\n');

  for (int i = 0; i < graph.length; i++) {
    graph[i] = 20;
  }
}

void draw() {

  background(20);

  fill(255);
  textFont(fontBig);
  text("TEMPERATURE MONITOR", 30, 40);

  textFont(fontSmall);

  fill(255, 80, 80);
  text("Temperature : " + nf(temperature, 0, 1) + " °C", 30, 90);

  fill(80, 180, 255);
  text("Humidity    : " + nf(humidity, 0, 1) + " %", 30, 120);

  fill(255, 220, 0);
  text("Light       : " + light, 30, 150);

  fill(200);
  text("Time        : " + clock, 30, 180);

  // Graph frame
  stroke(180);
  noFill();
  rect(260, 60, 600, 360);

  // Y labels
  fill(180);
  text("35°C", 215, 70);
  text("30°C", 215, 150);
  text("25°C", 215, 240);
  text("20°C", 215, 330);
  text("15°C", 215, 420);

  // Draw graph
  stroke(255, 60, 60);
  strokeWeight(2);
  noFill();

  beginShape();

  for (int i = 0; i < graph.length; i++) {

    float x = map(i, 0, graph.length - 1, 260, 860);
    float y = map(graph[i], 15, 35, 420, 60);

    vertex(x, y);
  }

  endShape();
}
// =====================================================
// SERIAL DATA
// Format:
// Temperature,Humidity,Time,Light
// Example:
// 24.3,53.6,18:07:33,258
// =====================================================

void serialEvent(Serial p) {

  String data = p.readStringUntil('\n');

  if (data == null) return;

  data = trim(data);

  String[] parts = split(data, ',');

  if (parts.length == 4) {

    try {

      temperature = float(parts[0]);
      humidity    = float(parts[1]);
      clock       = parts[2];
      light       = int(parts[3]);

      // Shift graph left
      for (int i = 0; i < graph.length - 1; i++) {
        graph[i] = graph[i + 1];
      }

      // Add newest temperature
      graph[graph.length - 1] = temperature;

    }
    catch(Exception e) {
      println("Bad data: " + data);
    }
  }
}

// =====================================================
// Keyboard shortcuts
// =====================================================

void keyPressed() {

  if (key == 'c' || key == 'C') {

    // Clear graph
    for (int i = 0; i < graph.length; i++) {
      graph[i] = temperature;
    }

    println("Graph cleared");
  }

}
Write a Processing program that receives data from Arduino through the Serial port and displays it in real time. The program should update every second and show the current time, the photoresistor (light sensor) value, temperature, and humidity on the screen. In addition, create a real-time line graph that continuously visualizes the temperature changes over time. Use a dark background, clear labels, and different colors for each parameter. The graph should automatically scroll as new temperature values are received, keeping previous measurements visible.
During the experiment, I first directed hot air from a hair dryer onto the sensor. As shown in the image, the graph line began to rise as the temperature gradually increased. I then switched the hair dryer to the cold air setting and directed it at the sensor again. As a result, the graph line gradually decreased, reflecting the drop in temperature. This experiment demonstrated that the system responds correctly to temperature changes and accurately visualizes them on the graph in real time.
Conclusion
This week, I explored different tools (Processing, Python, and Node-RED) and their use for creating user interfaces and communicating with microcontrollers.
In my individual work, I used Processing + G4P to develop a graphical interface that allows real-time visualization and interaction with sensor data coming from Arduino.
The technical issues I encountered during the process helped me better understand how to identify and debug problems on both the hardware and software sides.
Overall, this assignment strengthened my understanding of serial communication, data transfer, and interface development for embedded systems.