Week 10. Output devices
Group Assignment
Although the main requirement of this week’s group assignment was simply to measure the power consumption of an output device, our work went beyond that. We not only measured the current consumption of a 12V LED strip, but also analyzed how this data could be used to determine the safe and reliable operating limits of my final project.
Since my final project uses 12V LED strips, we decided to use this output device as a practical example. My custom board is powered by a 12V DC power supply because the LED strip requires 12V to operate. At the same time, the voltage regulator on the board steps the 12V down to 5V to power the microcontroller and sensors. The LED strip is controlled through a MOSFET, specifically the 50N03 transistor, which acts as a switching component.
First, we studied the datasheet of the 50N03 MOSFET. According to the datasheet, the transistor can theoretically operate at up to 50A continuous drain current. However, this value assumes ideal thermal conditions with sufficient cooling or a heatsink. Since no heatsink is used in my project, it was necessary to evaluate the thermal limitations under real operating conditions, such as PCB heating, ambient temperature, and heat accumulation during long-term operation.
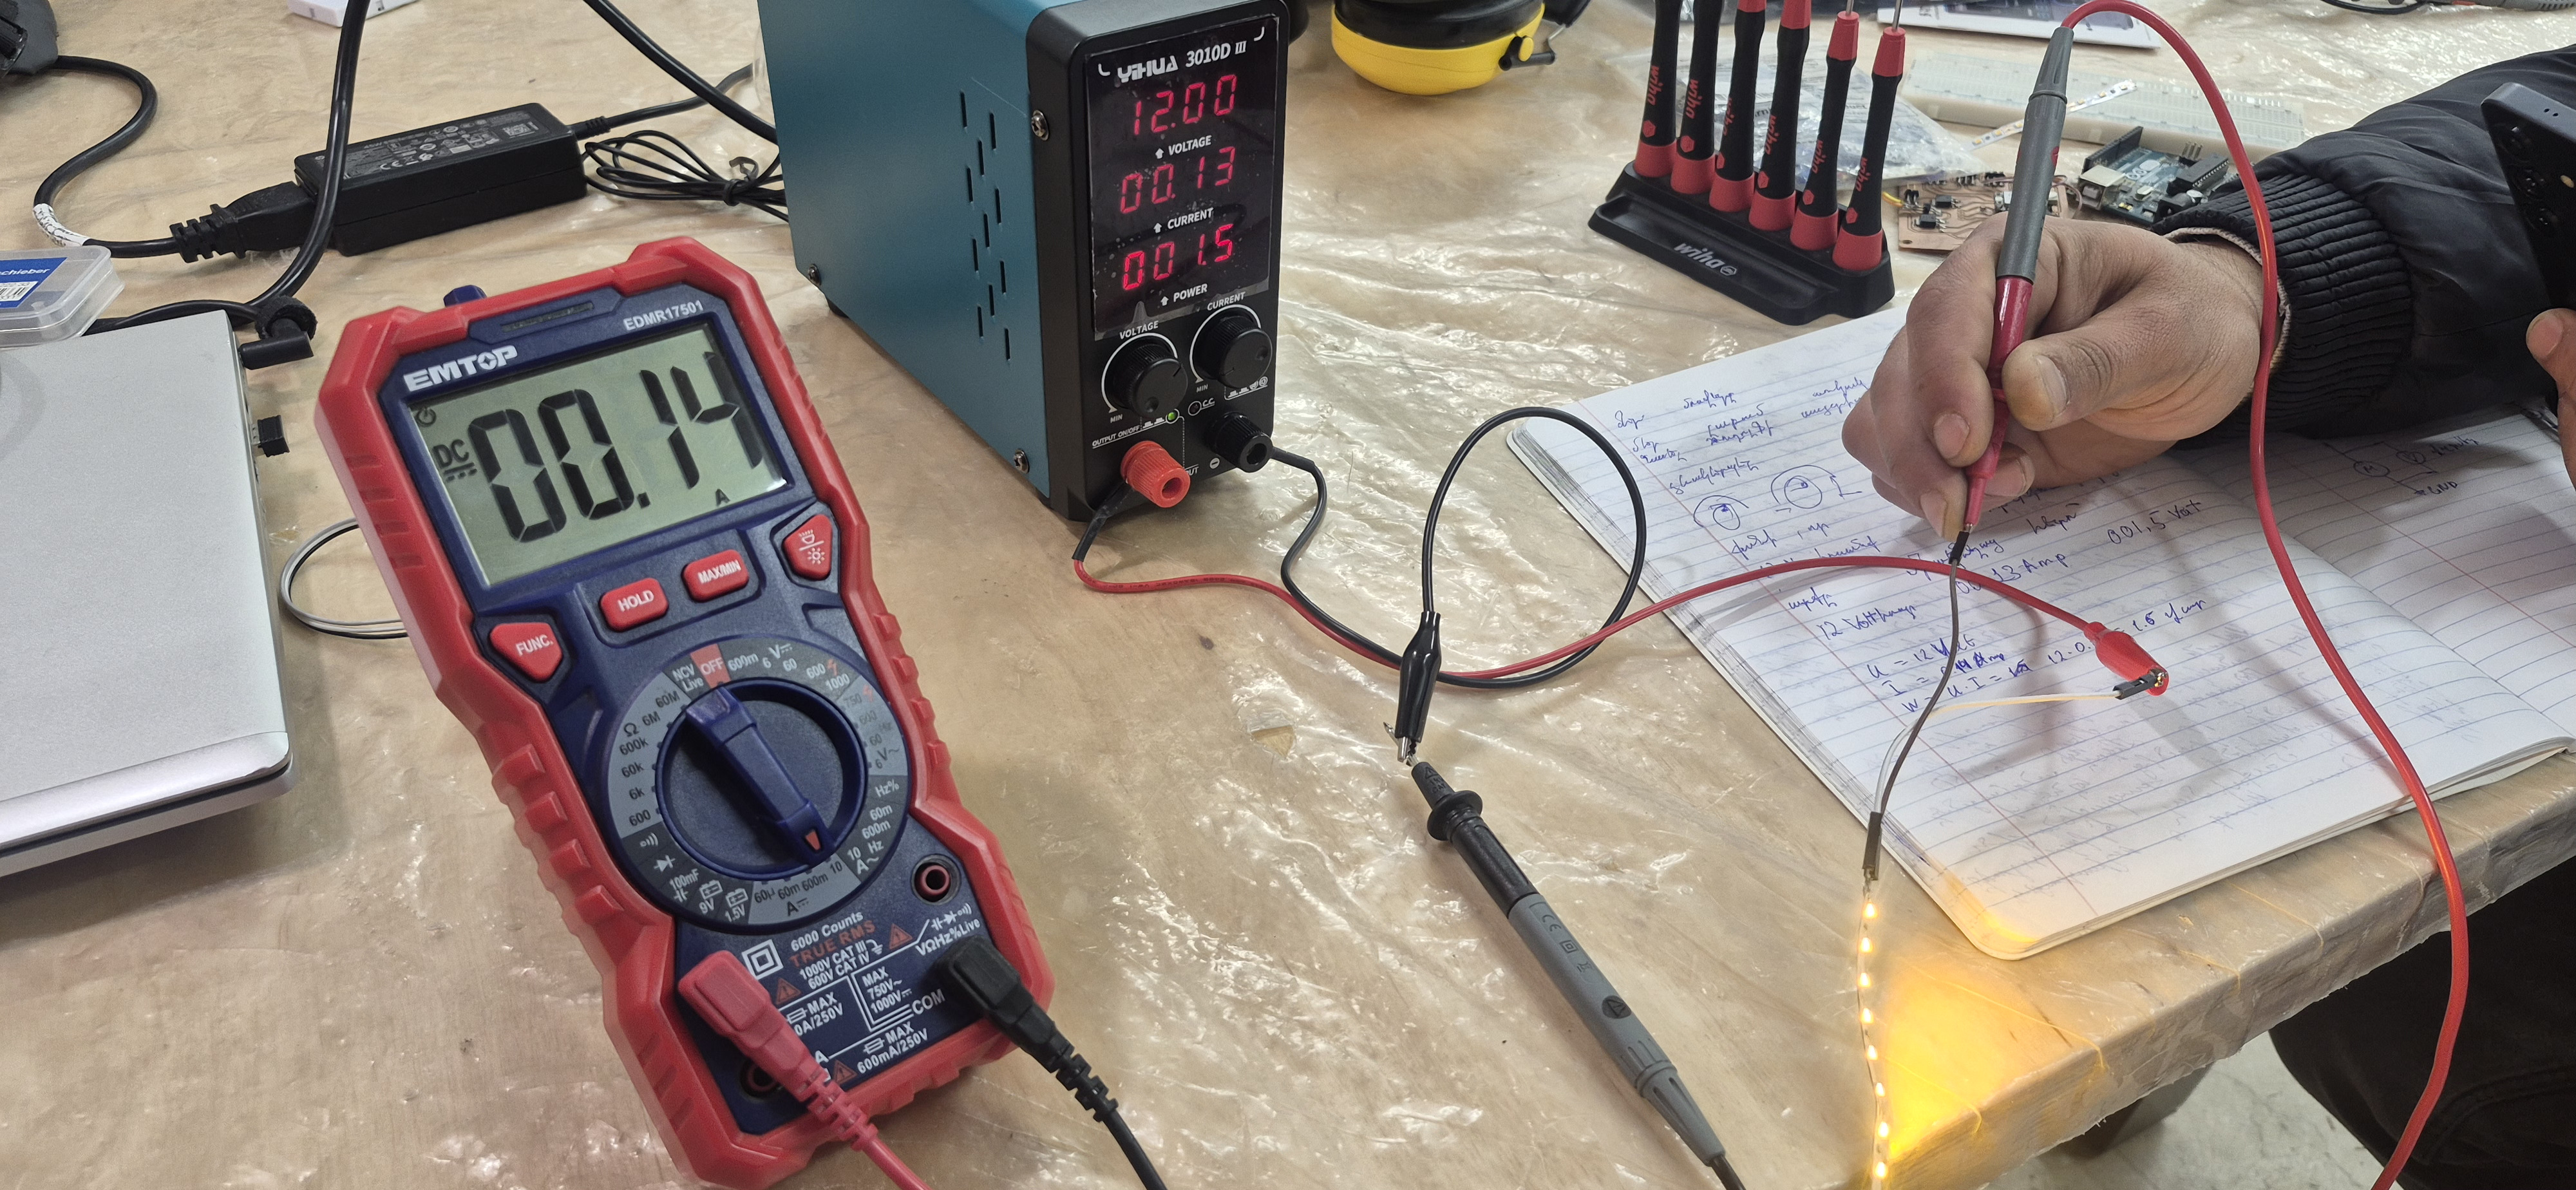
For practical measurements, we used a 12V LED strip in the lab consisting of 5 sections, each section measuring 25 mm in length. First, we connected the LED strip to a bench power supply and set the output voltage to 12V. The power supply provided an approximate current reading, but for more accurate measurements we used a multimeter.
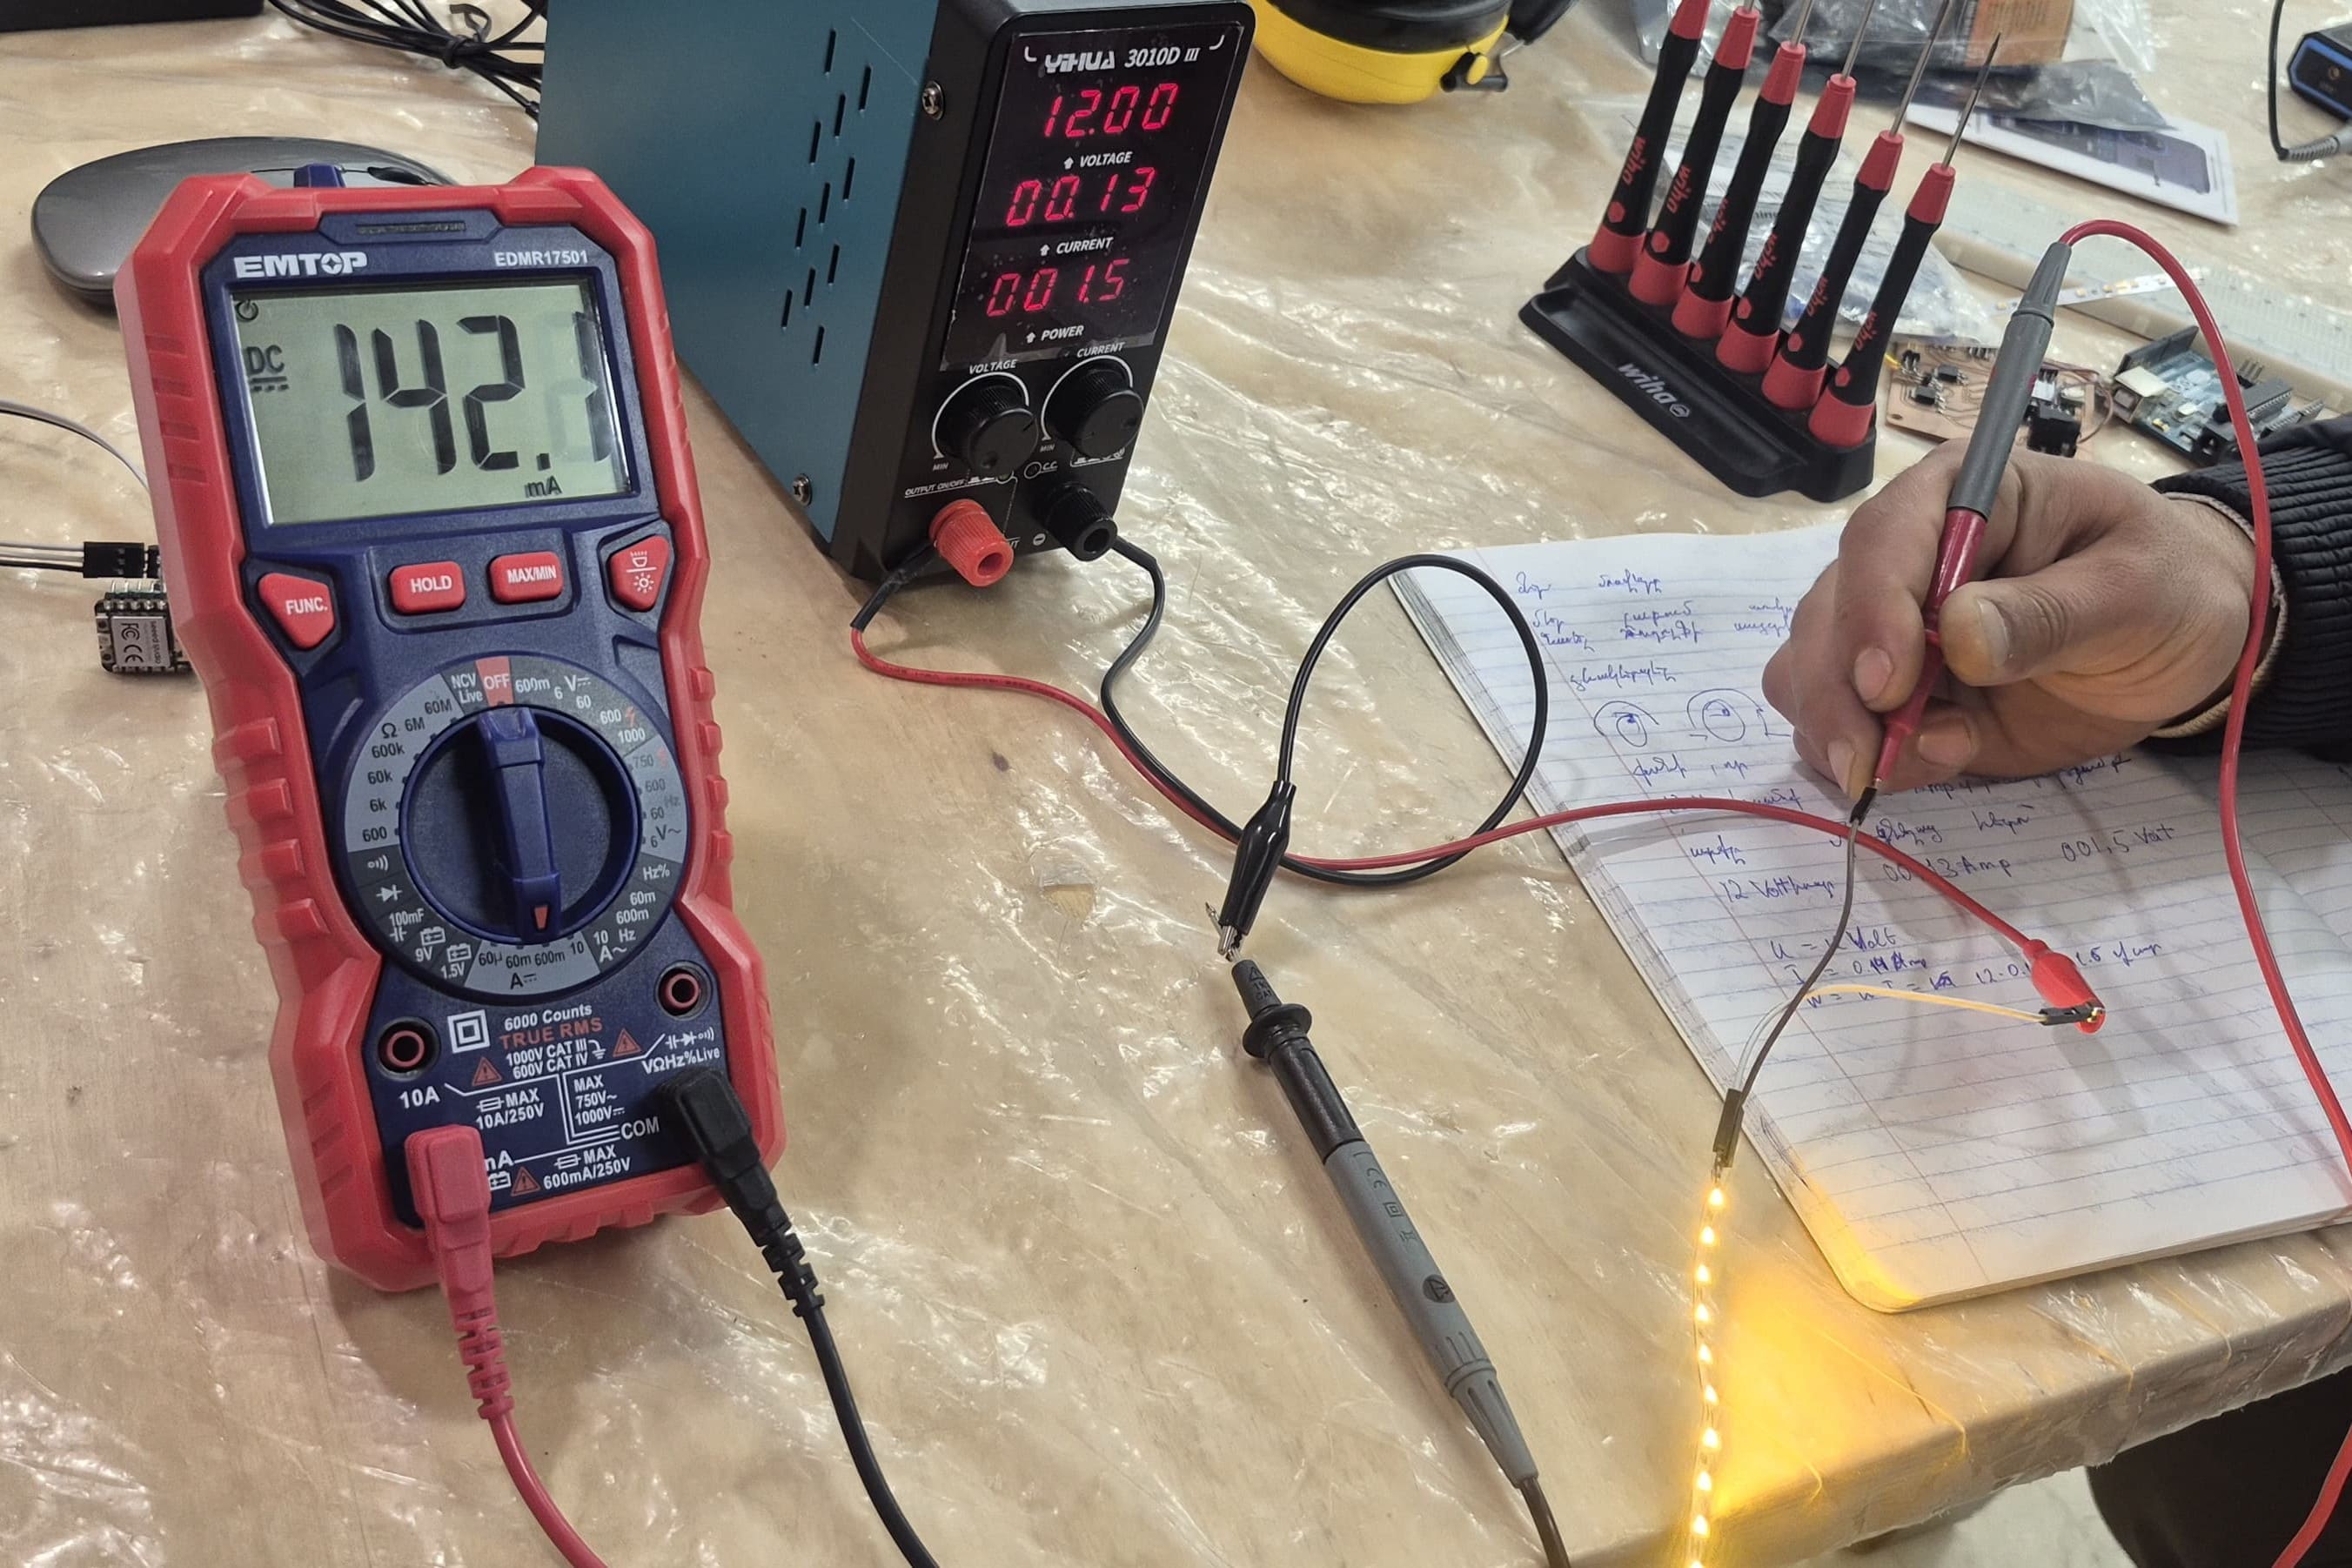
To measure current, we connected the multimeter in series with the circuit, since current measurement requires the entire current to pass through the measuring device. The measured value was:
$$ I = 142.1\ \text{mA} = 0.1421\ \text{A} $$
Next, we calculated the total power consumption of the LED strip. Power is calculated using the following formula:
$$ P = V \times I $$
where: P — power (W) V — voltage (V) I — current (A)
In our case:
$$ P = 12 \times 0.1421 = 1.7052\ \text{W} $$
This means the full 5-section LED strip consumes approximately 1.7 W.
Then, we calculated the current consumption of a single section:
$$ I_{section} = \frac{142.1}{5} = 28.42\ \text{mA} $$
Similarly, we calculated the power consumption per section:
$$ P_{section} = \frac{1.7052}{5} = 0.341\ \text{W} $$
These values helped us understand how much load each LED strip section adds to the system.
In the next step, we evaluated the safe operating limit of the MOSFET. Although the current limit specified in the datasheet is very high, without a heatsink we decided to use 5A as a practical maximum current. However, in engineering practice, components are usually not operated at their absolute maximum limits, so we applied a 30% safety derating.
We calculated the safe current limit as:
$$ I_{safe} = 5A \times 0.7 = 3.5A = 3500\ \text{mA} $$
At this point, we could calculate the maximum number of LED sections that could safely operate:
$$ \text{Number of sections} = \frac{3500}{28.42} = 123.15 $$
This means we can safely use approximately 123 sections.
Since each section is 25 mm long, the total strip length becomes:
$$ \text{Length} = 123 \times 25 = 3075\ \text{mm} \approx 3.08\ \text{m} $$
This means that in my final project, I can safely use approximately 3.08 meters of this type of LED strip without risking MOSFET overheating.
This assignment helped me understand that when designing an electronic system, it is not enough to simply ensure that the circuit works. It is also necessary to understand how much current the system consumes, how components operate within their limits, and how heat dissipation affects overall system performance. One of the most important lessons for me was realizing that the maximum values listed in a datasheet do not always represent real operating conditions. In real-world design, it is essential to consider thermal constraints, safety margins, and long-term reliability.
Individual Assignment
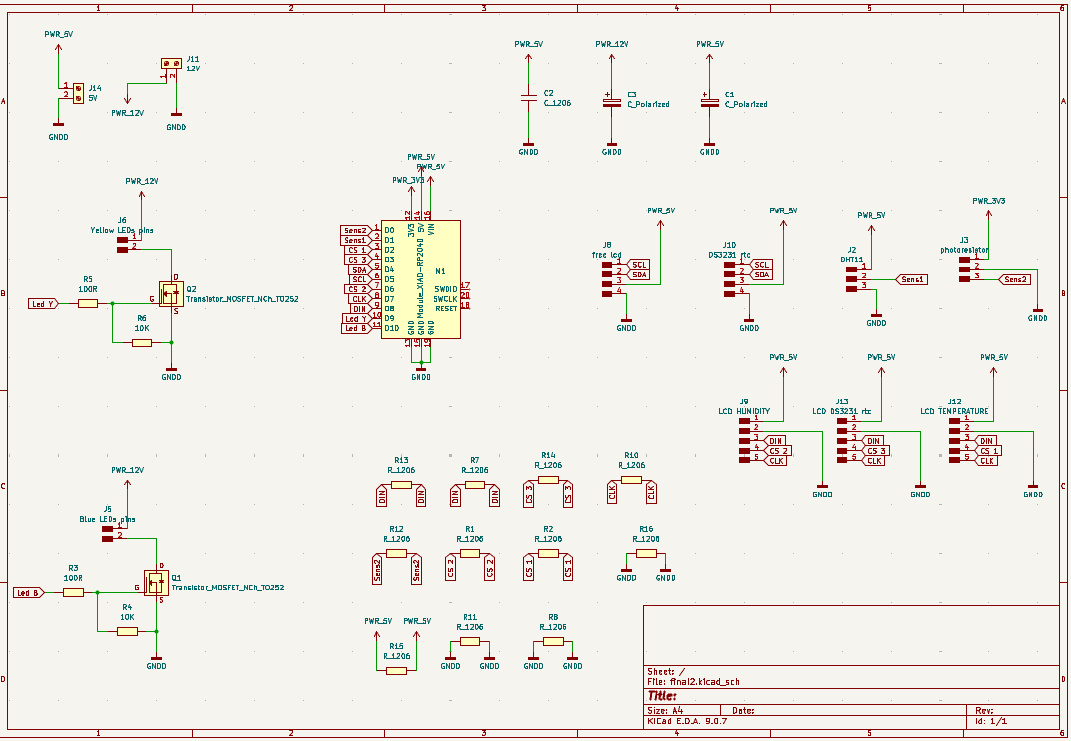
During this week’s assignment, I used the custom PCB that I designed and fabricated during Week 9 to test its overall functionality. The schematic shown above is also the schematic of the same PCB that was designed during Week 9.
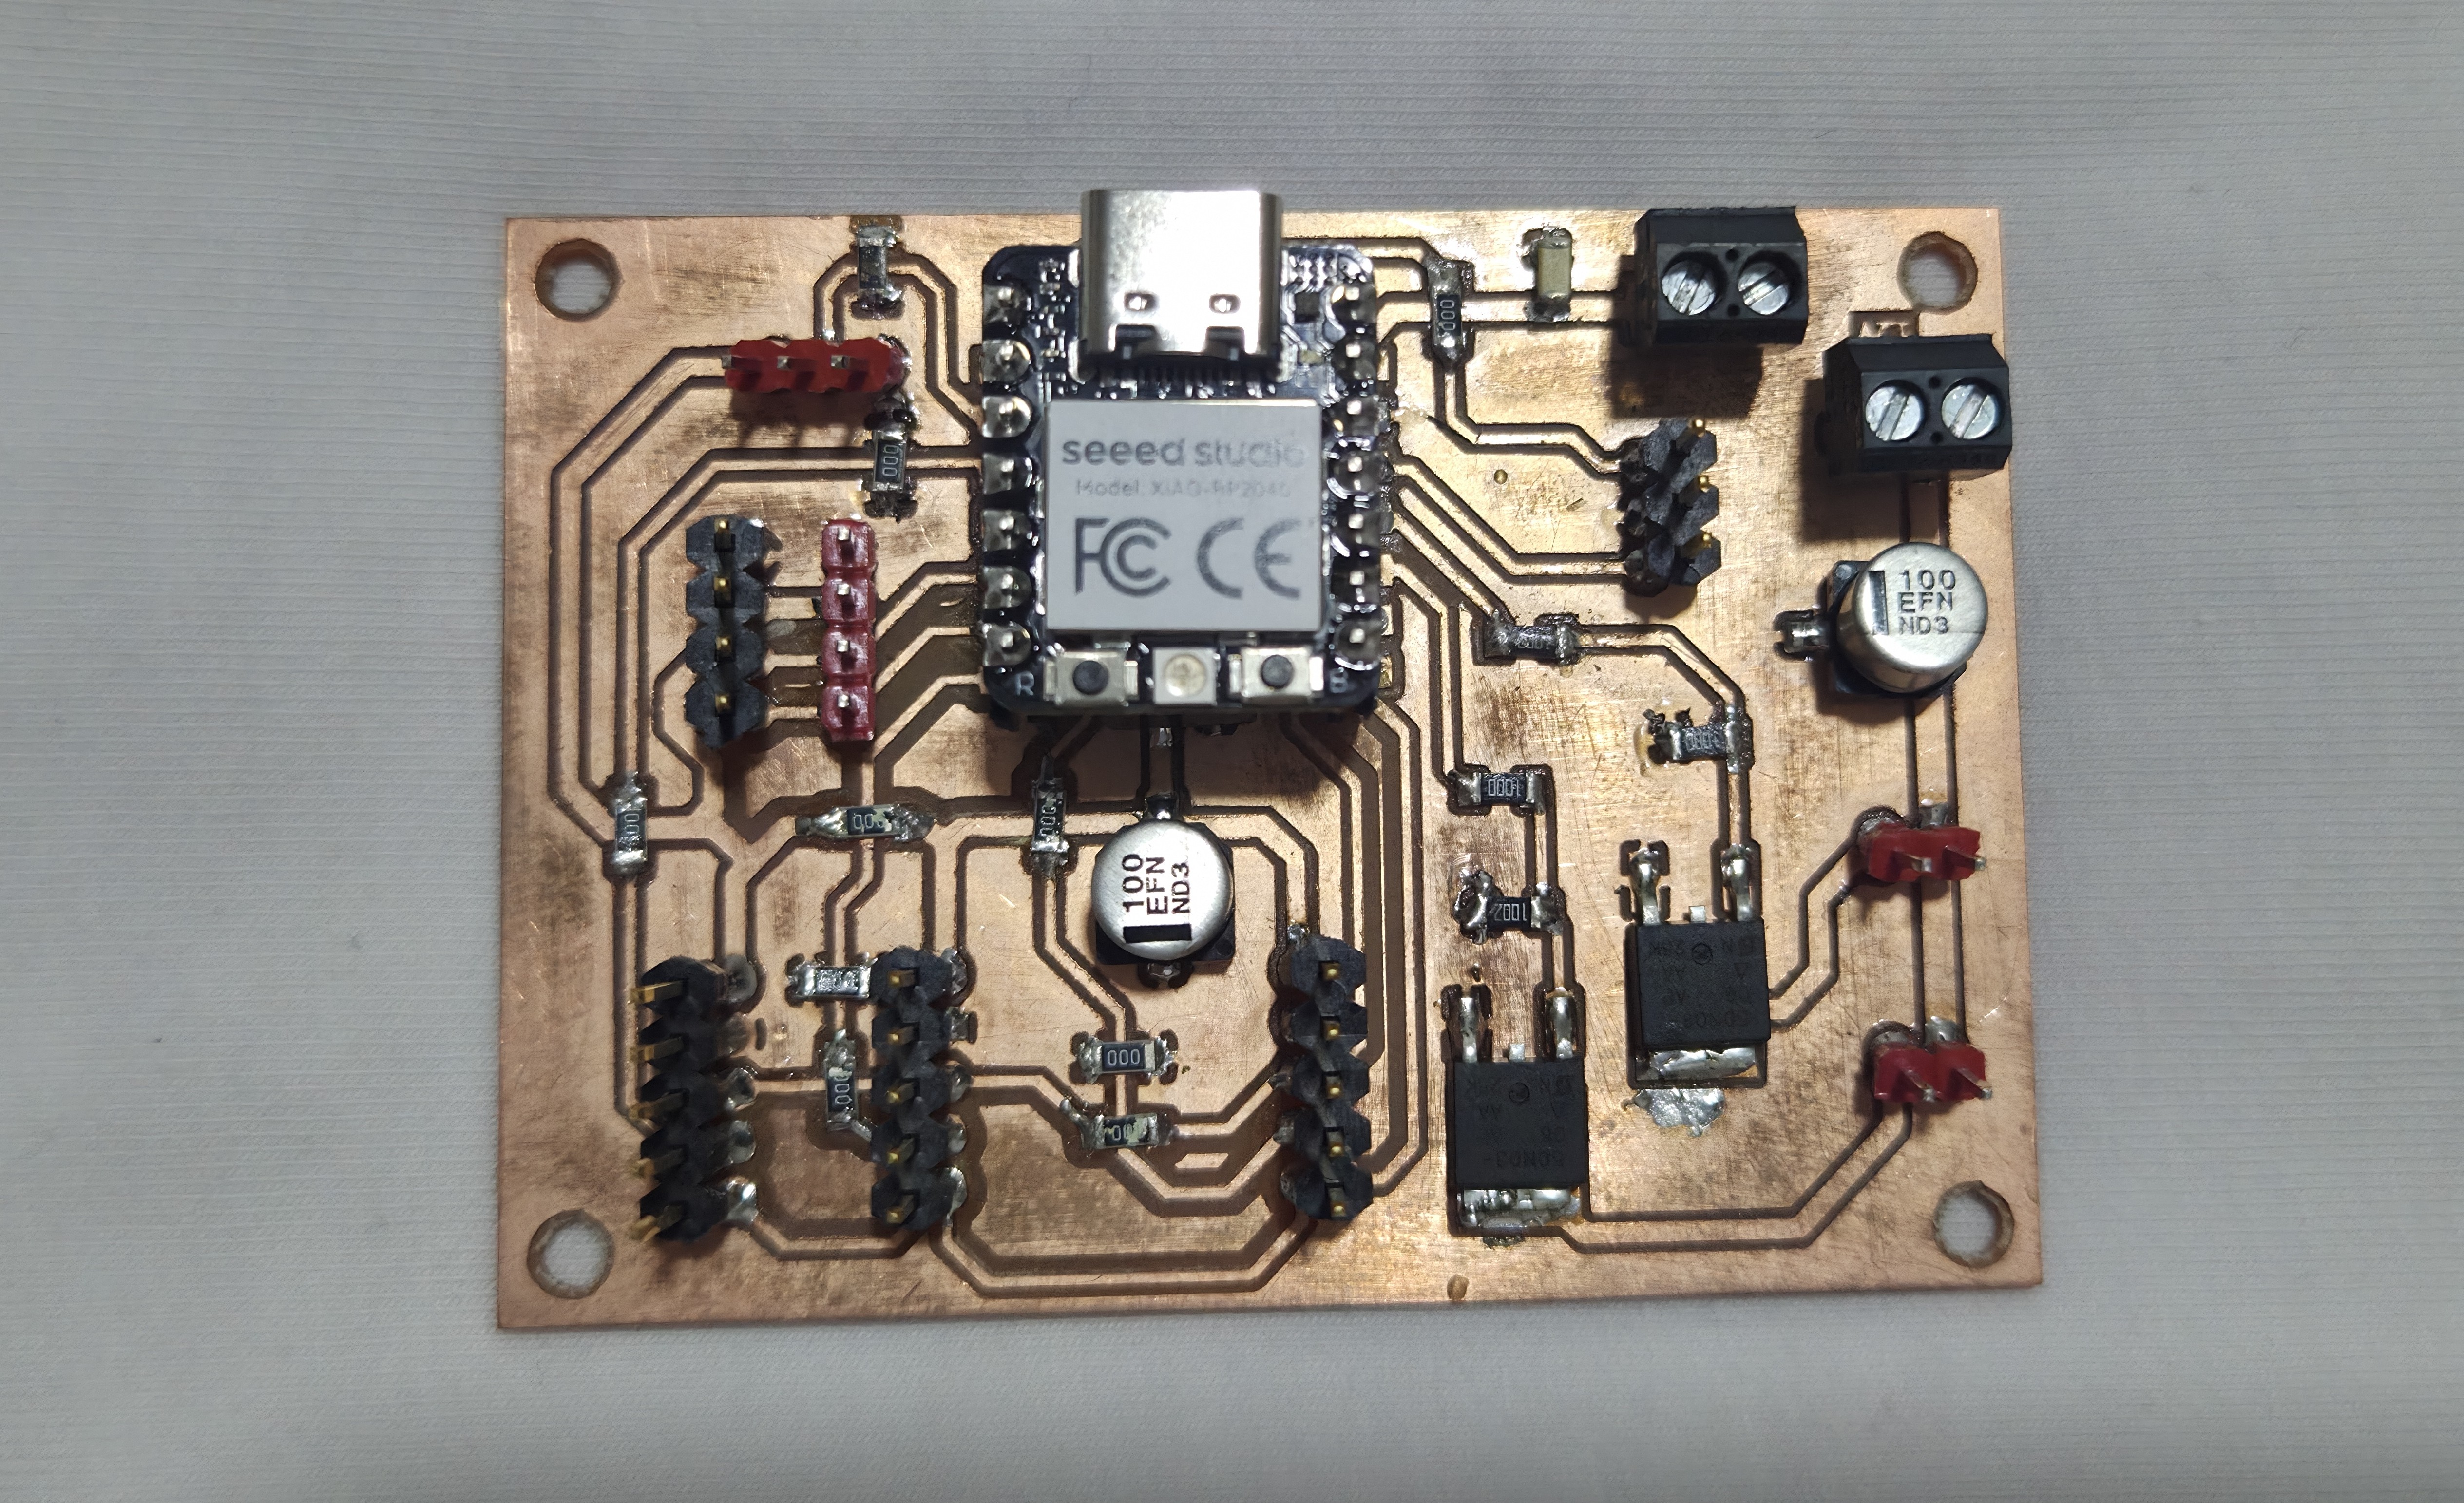
The main goal was to evaluate how the input and output systems work together as one integrated system. This allowed me to verify not only the operation of the individual components but also the stability of the complete system.
An output device is an electronic component that receives signals from a microcontroller and converts them into a physical result, such as light, sound, movement, or another visible response. Output devices enable an embedded system to interact with its environment and perform the actions defined by the program.
For this assignment, I used a 12V LED strip as the output device. Since it requires more current than the microcontroller can safely provide, the LED strip is controlled through an N-channel MOSFET connected to my custom Seeed Studio XIAO RP2040 board. This configuration allows the microcontroller to safely switch the 12V load while the LED strip is powered by an external power supply.
The same output device will also be used in my final project, where the LED strip automatically turns on when the ambient light level becomes low, providing the main visual response of the system.
Output Devices and System Components Working Principle
The output devices used in my project operate based on different principles depending on their structure and purpose. They allow the system to present processed information to the user or control external devices. In my system, the main output devices are the 12V LED strip and MAX7219 LED Matrix Display. The DHT11 and DS3231 modules are input devices that provide the data, which is later processed and displayed through the output devices.
12V LED Strip
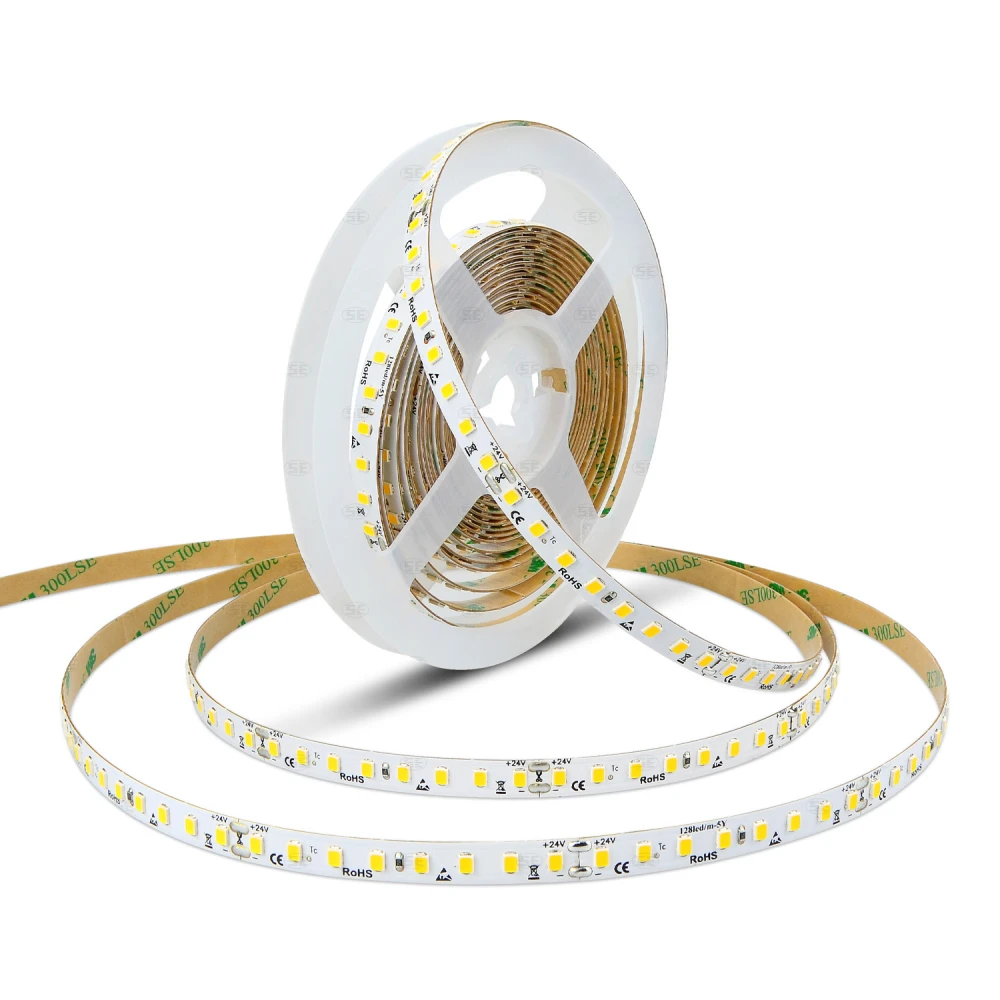
Image source: SE.Lighting – 2835 24V/12V LED Strip Lights for Room Manufacturer
A 12V LED strip operates using Light Emitting Diodes (LEDs), which convert electrical energy into light energy. The LEDs are mounted on a flexible PCB and are designed to operate using a 12V DC power supply.
Since the LED strip requires a higher current than a microcontroller output pin can provide, it is controlled using a MOSFET switching circuit. The microcontroller sends a low-power control signal to the MOSFET gate, and the MOSFET works as an electronic switch that controls the connection between the 12V power supply and the LED strip.
This method allows a high-power lighting device to be safely controlled without damaging the microcontroller. The MOSFET control also makes it possible to use PWM signals in the future to adjust the brightness of the LED strip.
In my project, the LED strip is used as an external lighting system and is controlled through my custom-designed PCB.
Purchased from: OUR LAB
MAX7219 LED Matrix Display
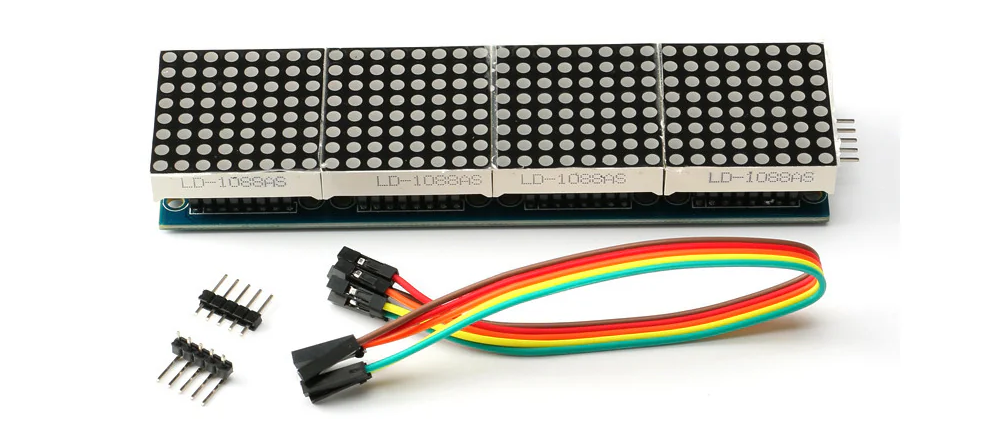
Image source: KitsGuru – MAX7219 Microcontroller 4-in-1 Display with 5P Line Dot Matrix Module
The MAX7219 LED Matrix Display works using an LED matrix controlled by a dedicated driver IC. The module consists of multiple LEDs arranged in rows and columns. Instead of controlling each LED individually, the MAX7219 driver uses a multiplexing method to control the entire matrix efficiently.
The microcontroller communicates with the MAX7219 module using the SPI communication interface. Based on the received commands, the MAX7219 determines which LEDs should be turned on and controls their brightness level.
In my project, two MAX7219 display modules are used. The first display shows the current time obtained from the DS3231 RTC module, while the second display shows temperature and humidity data received from the DHT11 sensor.
Datasheet: MAX7219 Datasheet
Purchased from: Temu

DHT11 Temperature and Humidity Sensor
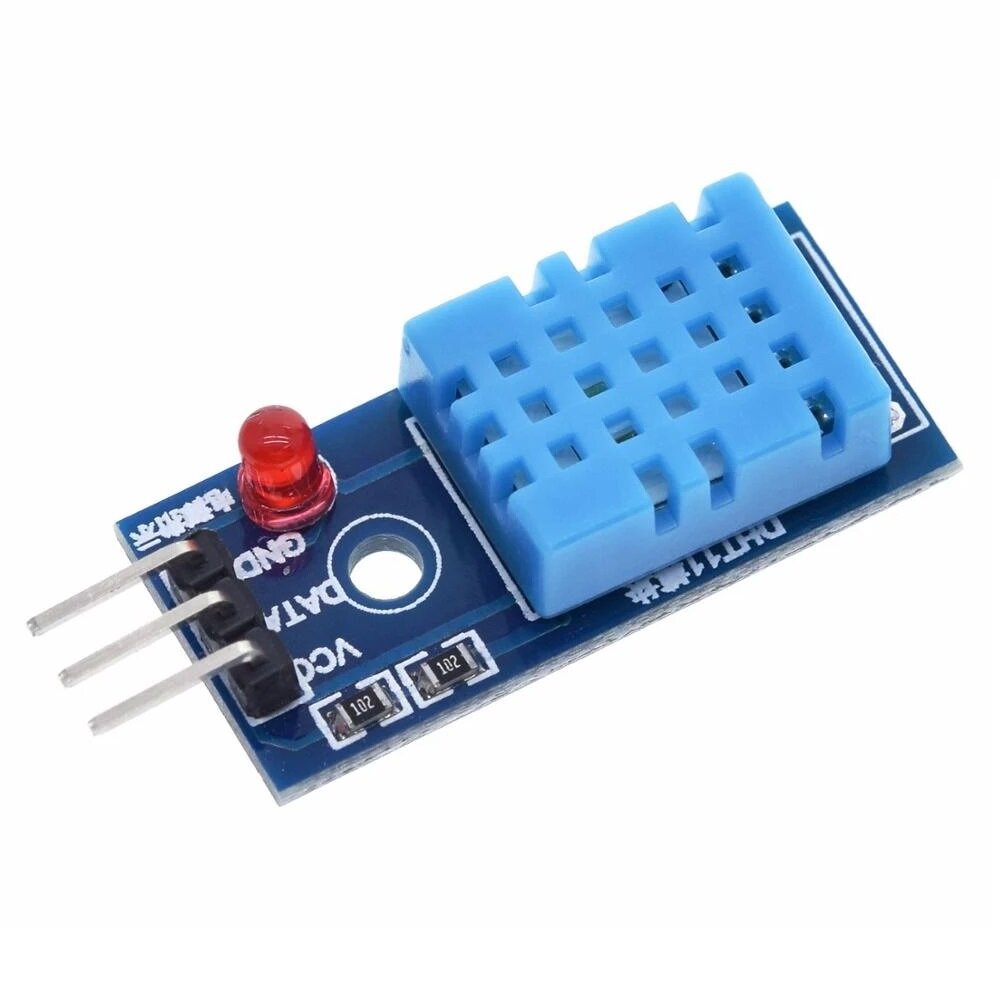
The DHT11 operates as a digital measurement sensor that includes temperature and humidity sensing elements. Inside the sensor, the measured analog signals are processed and converted into digital data.
The microcontroller sends a request to the DHT11 sensor, after which the sensor transmits the measured temperature and humidity values through a single digital communication line. The received data is processed by the microcontroller and then sent to the MAX7219 display for visualization.
In my system, the DHT11 works as a data acquisition module, while the final information is presented to the user through the MAX7219 LED Matrix Display.
Datasheet: DHT11 Datasheet
Purchased from: Temu

DS3231 RTC Module
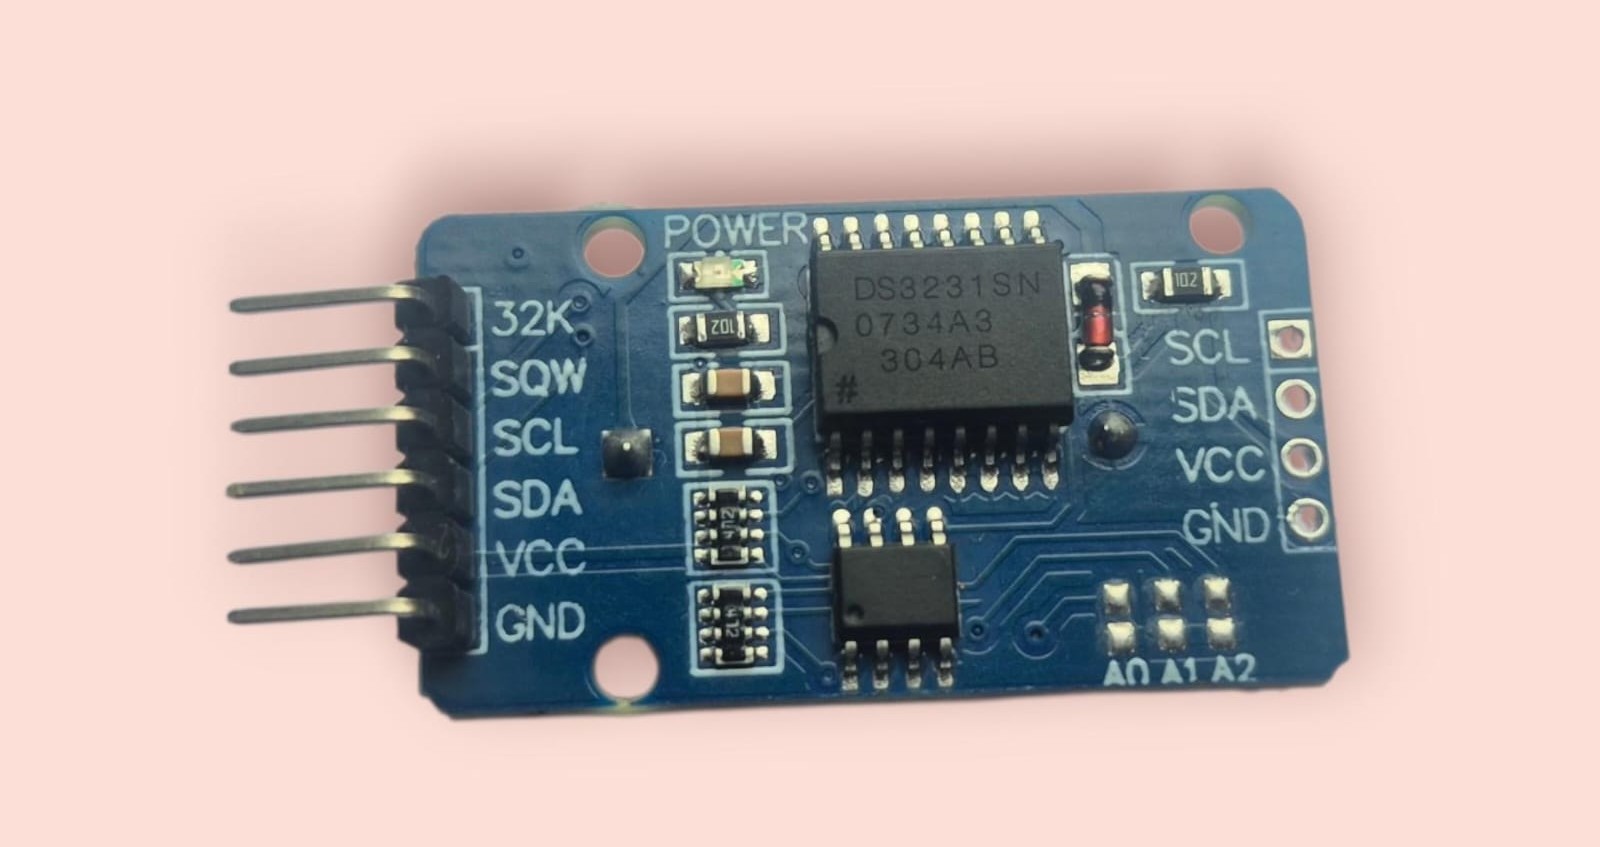
The DS3231 is a Real-Time Clock (RTC) module designed to maintain accurate time and date information. It uses an internal oscillator and clock calculation system to keep track of time continuously.
The module communicates with the microcontroller using the I2C communication protocol. The microcontroller sends a request to the DS3231, and the module returns the current time information, including hours, minutes, seconds, and date.
In my project, the DS3231 is not a direct output device, but it provides the time data that is later displayed through the MAX7219 LED Matrix Display.
Datasheet: DS3231 Datasheet
Purchased from: Temu

LED Control Test (Photoresistor)
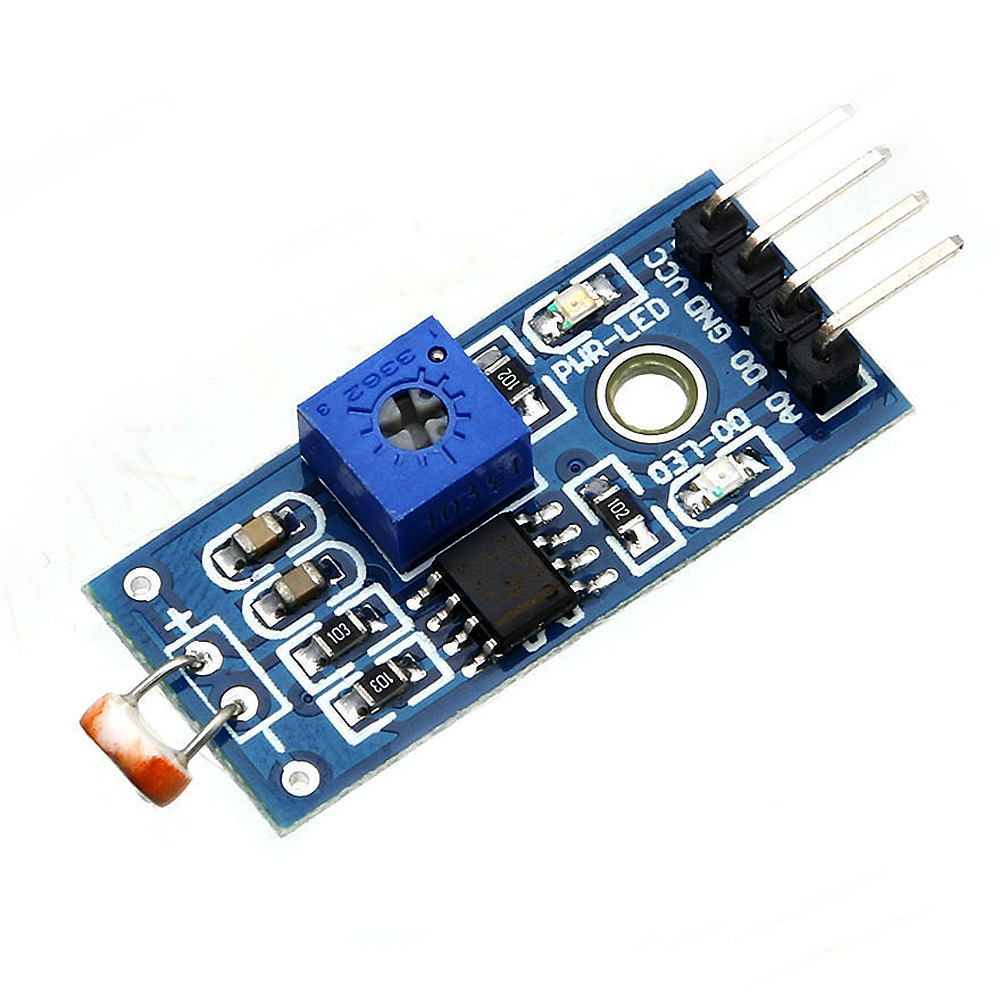
The purpose of this test was to evaluate the basic input/output functionality of my PCB using a photoresistor as an input device and an LED as an output device.
The photoresistor was connected to the A0 analog pin, while the LED was connected to the D9 digital output pin. The system reads the light level and turns the LED on or off depending on the surrounding light conditions. In dark environments, the LED automatically turns on, and in bright conditions, it turns off.
#define LDR_PIN A0
#define LED_PIN D9

#define THRESHOLD 500

void setup() {
  pinMode(LED_PIN, OUTPUT);
}

void loop() {
  int lightValue = analogRead(LDR_PIN);

  if (lightValue < THRESHOLD) {
    digitalWrite(LED_PIN, HIGH);
  } else {
    digitalWrite(LED_PIN, LOW);
  }

  delay(50);
}
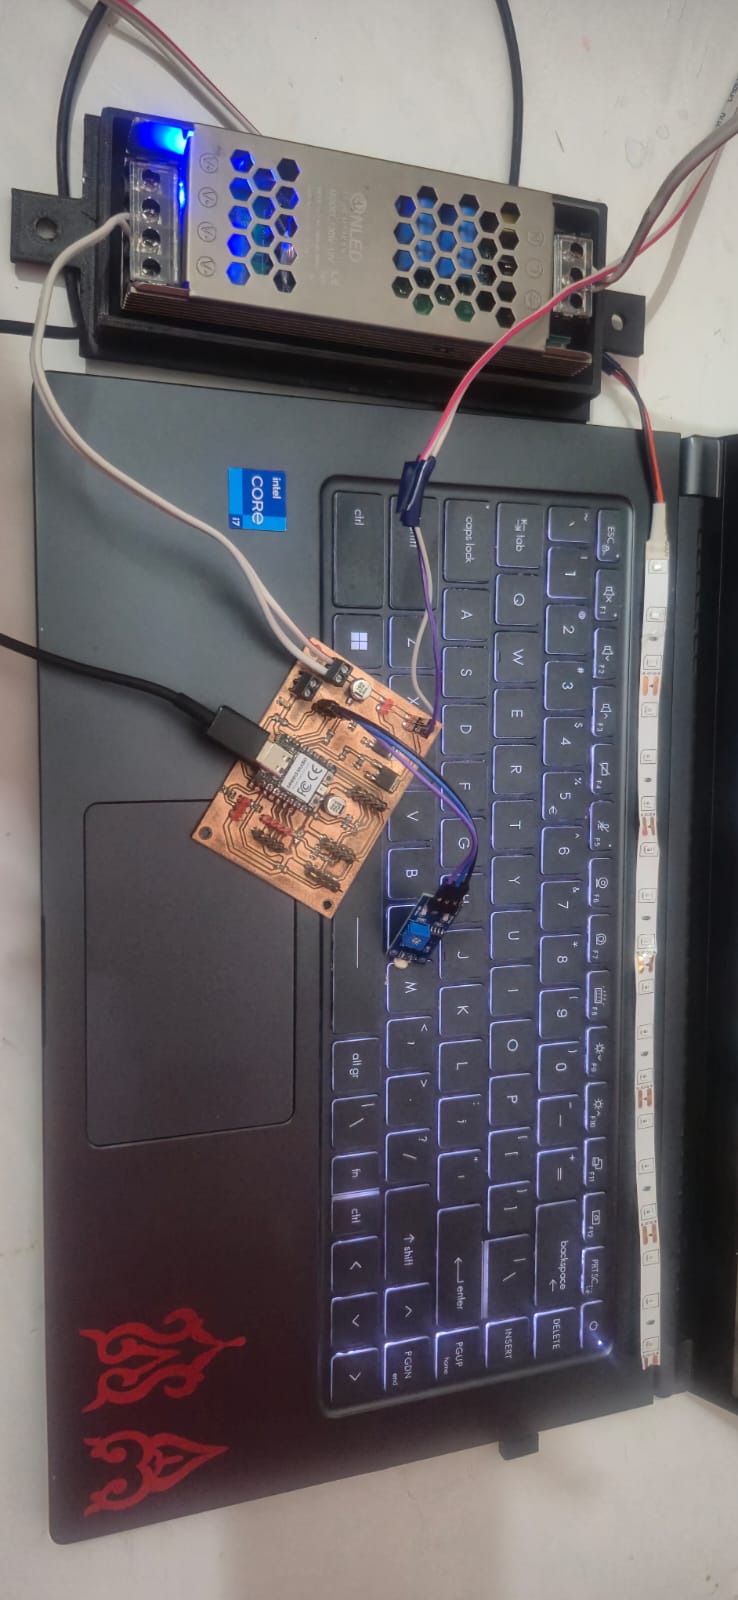
This test confirmed that both analog input reading and digital output control are working correctly on my PCB.
Full System Test (DHT11 + DS3231 + MAX7219)
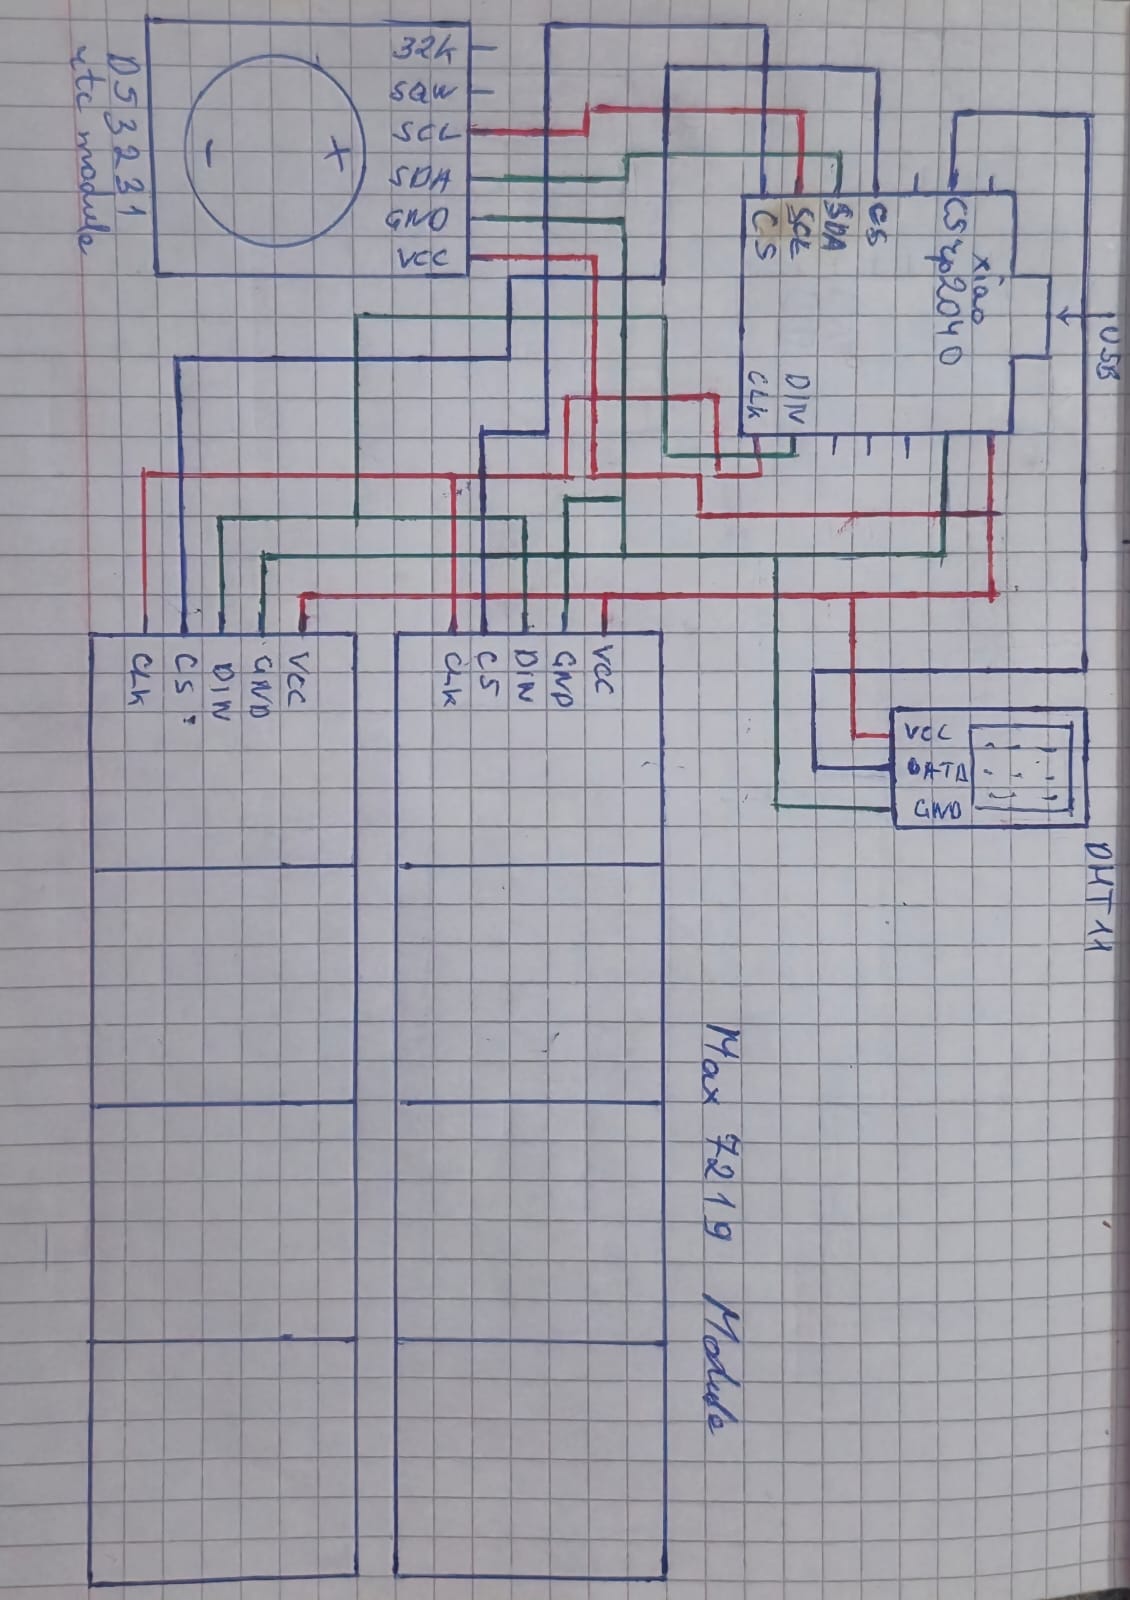
After that, I carried out a full system integration test of my PCB, including input sensors, a real-time clock module, and display units.
The system uses a DHT11 sensor (temperature and humidity) and a DS3231 real-time clock module, both of which were previously tested during the Input Devices week. In this stage, they were integrated into a single system to evaluate full functionality.
The collected data is displayed using MAX7219 LED matrix displays controlled with the MD_Parola library.
During this testing phase, I observed that data visualization needed to be adapted to hardware limitations. Although my final project includes three separate displays for different functions, only two MAX7219 displays were available during this week. Therefore, the temperature and humidity values from the DHT11 sensor were shown on the same display by alternating between them.
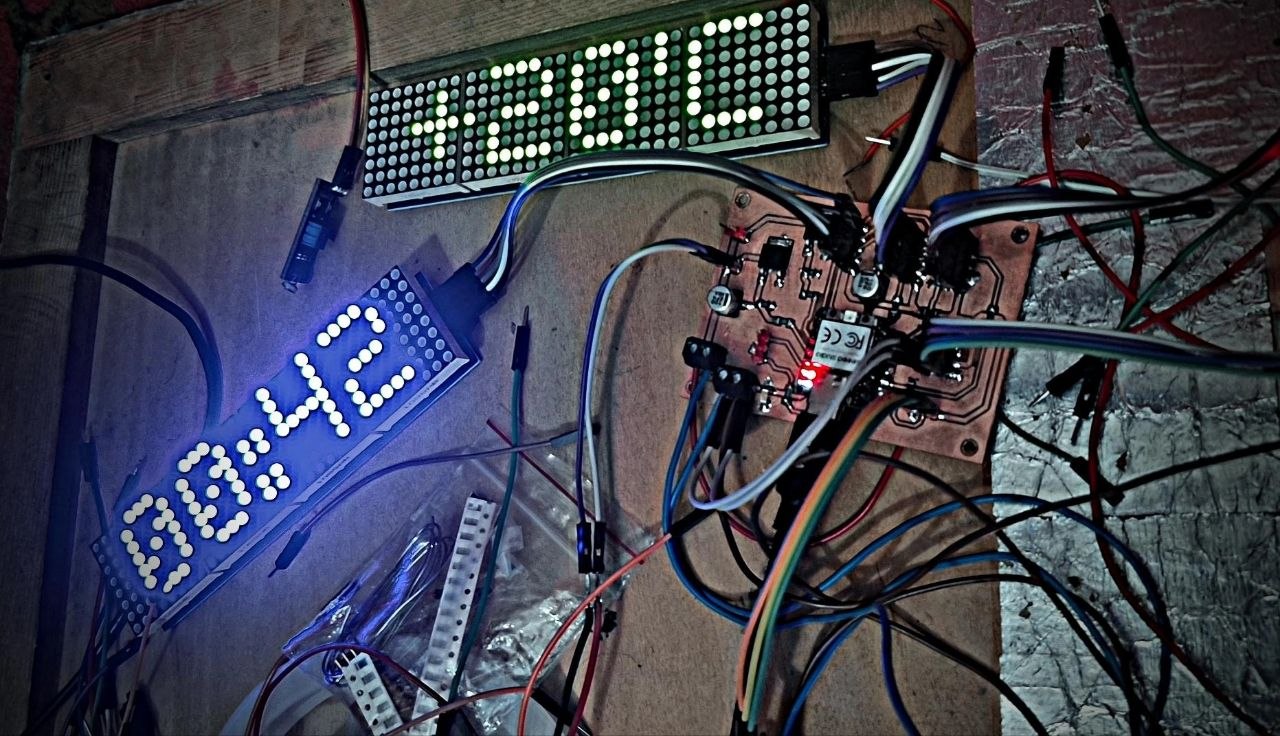
The display automatically switches every 15 seconds, first showing temperature and then humidity. Meanwhile, the second display shows real-time data from the DS3231 module. This approach allowed me to test the full system under limited hardware conditions and confirmed that data acquisition, processing, and visualization all work reliably and correctly.
#include <MD_Parola.h>
#include <MD_MAX72XX.h>
#include <SPI.h>

#include <Wire.h>
#include "RTClib.h"
#include <DHT.h>

#define HARDWARE_TYPE MD_MAX72XX::FC16_HW

#define DATA_PIN 2
#define CLK_PIN  1

#define CS_RTC 29
#define CS_DHT 28

#define DHTPIN 27
#define DHTTYPE DHT11

#define MAX_DEVICES 4

MD_Parola displayRTC(HARDWARE_TYPE, DATA_PIN, CLK_PIN, CS_RTC, MAX_DEVICES);
MD_Parola displayDHT(HARDWARE_TYPE, DATA_PIN, CLK_PIN, CS_DHT, MAX_DEVICES);

RTC_DS3231 rtc;
DHT dht(DHTPIN, DHTTYPE);

unsigned long lastDHTRead = 0;
unsigned long lastDisplayChange = 0;

float temperature = 0;
float humidity = 0;

bool showTemperature = true;

void setup() {

  Serial.begin(115200);

  Wire.begin();
  dht.begin();

  if (!rtc.begin()) {
    Serial.println("RTC not found!");
    while (1);
  }

  if (rtc.lostPower()) {
    rtc.adjust(DateTime(F(__DATE__), F(__TIME__)));
  }

  displayRTC.begin();
  displayDHT.begin();

  displayRTC.setIntensity(1);
  displayDHT.setIntensity(1);

  displayRTC.displayClear();
  displayDHT.displayClear();
}


void loop() {

  // =====================
  // DS3231 TIME DISPLAY
  // =====================

  DateTime now = rtc.now();

  char timeBuf[10];
  sprintf(timeBuf, "%02d:%02d", now.hour(), now.minute());

  displayRTC.displayText(
    timeBuf,
    PA_CENTER,
    0,
    0,
    PA_PRINT,
    PA_NO_EFFECT
  );

  displayRTC.displayAnimate();


  // =====================
  // READ DHT11 SENSOR
  // =====================

  if (millis() - lastDHTRead >= 2000) {

    lastDHTRead = millis();

    float t = dht.readTemperature();
    float h = dht.readHumidity();

    if (!isnan(t) && !isnan(h)) {
      temperature = t;
      humidity = h;
    }
  }


  // =====================
  // CHANGE DHT DISPLAY EVERY 15s
  // =====================

  if (millis() - lastDisplayChange >= 15000) {

    lastDisplayChange = millis();

    showTemperature = !showTemperature;
  }


  char dhtBuf[20];

  if (isnan(temperature) || isnan(humidity)) {

    strcpy(dhtBuf, "ERR");

  } else {

    if (showTemperature) {
      sprintf(dhtBuf, "T %.0fC", temperature);
    }
    else {
      sprintf(dhtBuf, "H %d%%", (int)humidity);
    }
  }


  displayDHT.displayText(
    dhtBuf,
    PA_CENTER,
    0,
    0,
    PA_PRINT,
    PA_NO_EFFECT
  );

  displayDHT.displayAnimate();
}
Write Arduino code for my XIAO RP2040 custom PCB that reads temperature and humidity data from a DHT11 sensor and obtains the current time from a DS3231 RTC module. Display the time on one MAX7219 LED matrix display and display the DHT11 data on the second MAX7219 display, alternating between temperature and humidity every 15 seconds. If the sensor readings fail, display "ERR".
Conclusion
This week allowed me to evaluate the functionality of my custom PCB designed in Week 9 through practical testing of both output devices and complete system integration. The LED strip power analysis helped me understand the importance of current calculations, component limitations, thermal considerations, and safety margins when designing reliable electronic systems.
During the individual assignment, I verified that my PCB can successfully combine input and output components into one integrated system. The photoresistor test confirmed correct analog input reading and digital output control, while the full system test demonstrated stable communication between the DHT11 sensor, DS3231 RTC module, and MAX7219 displays.
Despite the limitation of having only two displays available during testing, the system was successfully adapted to present all required information. This process improved my understanding of embedded system development, debugging, and the importance of validating both hardware and software under real operating conditions.