Week 15: Interface and application programming
Assignement
- Individual assignment: write an application that interfaces a user with an input &/or output device that you made
- Group assignment: compare as many tool options as possible -> see group page
What I did
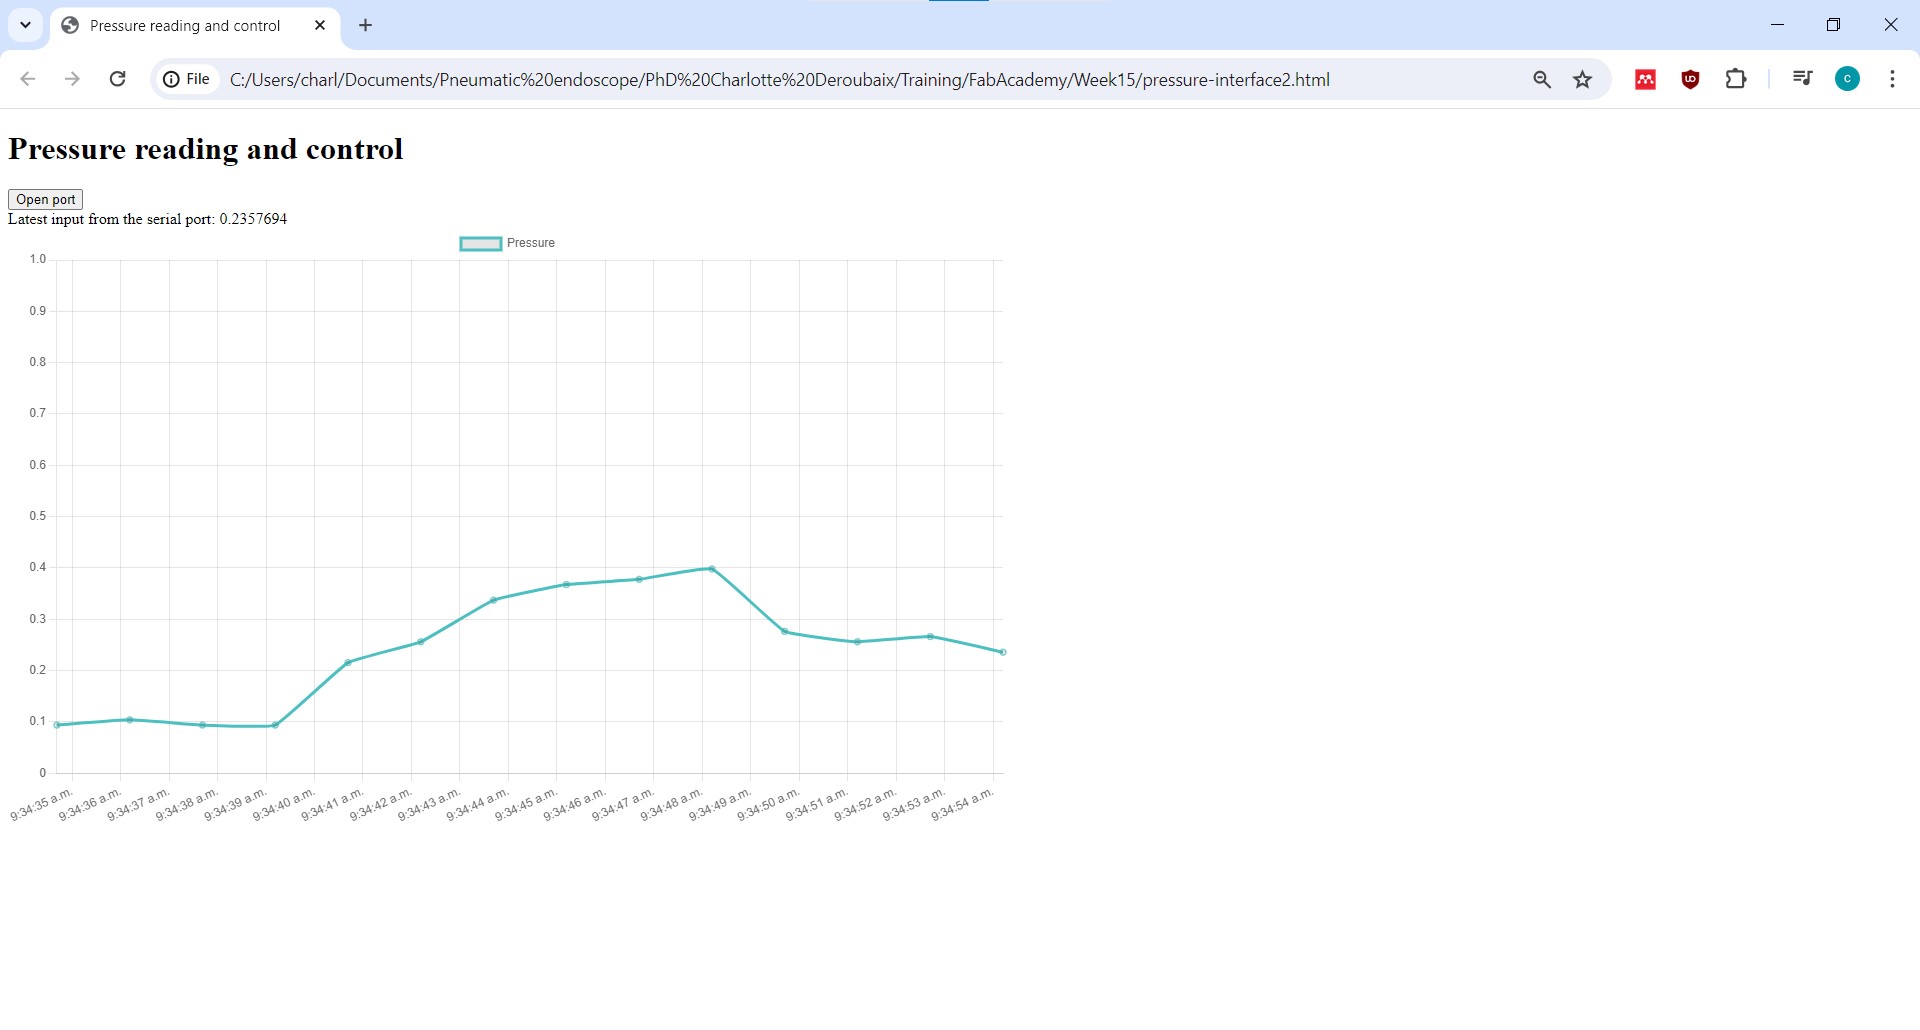
I programmed a web browser interface that displays data measured by a pressure sensor in real time. I will use it for my final project.
The interface can be used and tested here.
Interface programming
Goal of the interface
I want a interface that is able to display the pressure that I’m applying to the air chambers of my pneumatic actuator. Indeed, during week 8 and week 14 I worked on the control of the pressure applied to these chambers. Now I would like to display the pressure that I’m really applying and that I’m measuring with the sensor that I used during week 12. This interface will thus display in real time the data measured by an input device, a pressure sensor. If I have some more time this week, I also would like to add the possibility to change the pressure, i.e. send command to the pressure regulators, with this interface.
Interface choice
I will do a web browser user interface (UI), as adviced by my instructor Nicolas. Indeed, a browser UI will be compatible with a wide variety of operating systems and devices. For example, if I develop an interface using Python, other users will have to download on their computer exactly the same version of Python and the libraries I use, which is not practical at all. However, with a web serial interface, anyone with an internet connection and a web browser can access to the interface. This means people can use your software without needing to install anything special on their own computers.
Additionally, with the “web serial API”, it’s possible to communicate with a serial devoce such as a micrcontroller directly from a web browser. It provides a way for websites to read from and write to serial devices. These devices may be connected via a serial port, or be USB or Bluetooth devices that emulate a serial port. In this case, my microcontroller will be link to my computer by USB, and it will allow me to read the data from my pressure sensor on the web interface, as well as to control the pressure to be applied in the channel. That’s the goal, I started by reading the data, and I will add the control stuff if I have the time. Note: not all web browser can be used with the web serial API, because some web browsers does not allow it for security reason. There is a list of supported browser here.
For the code, the code, these documentations (link 1, link 2) are really good to understand how to read and write to a serial port from a web browser UI, and to have a good starting point for the code. I also used the documentation and example code that I found here, and I modified it for my own purpose.
Programming the interface
I used Visual studio code as usual: create a new “html” file and save it, then just double click on it to open it in your browser, it will display the web browser interface that you are programming in the html file.
HTML file
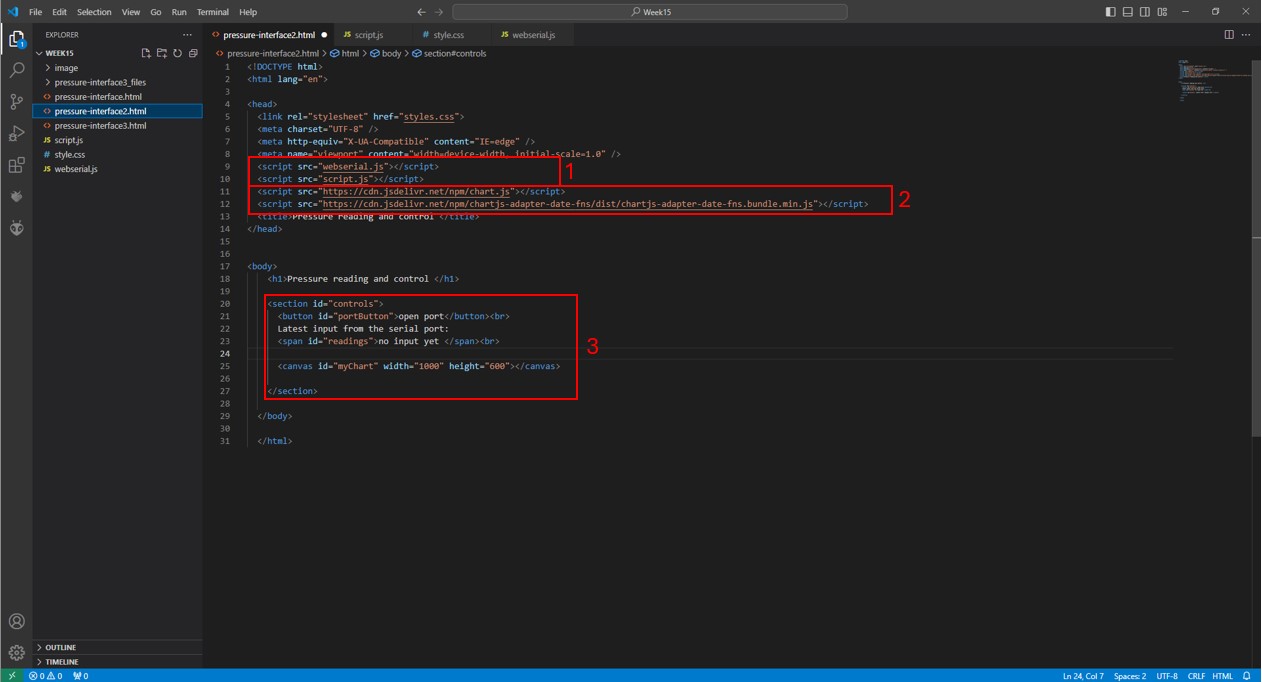
On the picture below, you can see how the html file is structured:
1) It will add the different java scripts to the html file, i.e. the actual scripts that will use the Serial Web API to read and write data to a serial port from a web page. It where all the function to communicate with the microcontroller connected via USB will be written. These parts of the code could be write directly in the html file in javascript as well, but for a better reading and structure of the code, it’s better to write them in separate files and add them as shown in 1.
2) It shows the javascript libraries used in the code. Note that they are not downloaded on the personnal computer, but used directly online.
3) The body of the interface, with the different sections, buttons, and graphics.
Displaying data on the interface
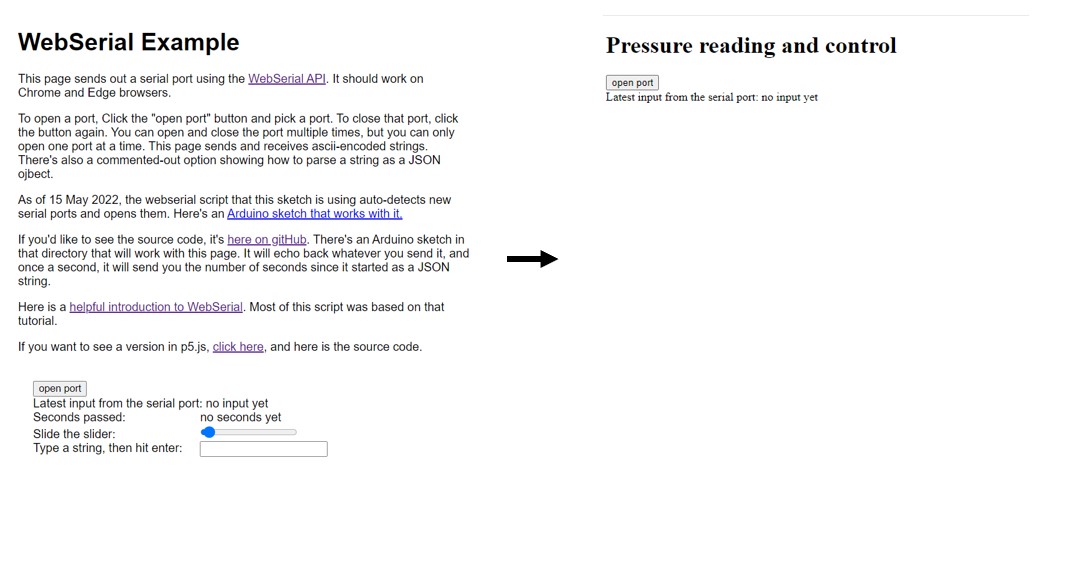
I first used the code of this page, without modifying anything to see if I was able to read data received on the port from my microcontroller and display them to the interface. Note I still use the code that I did in week 12 to read the pressure with a I2C sensor.
- I first had a problem: I was able to connect to the port but no data were displayed on the interface.
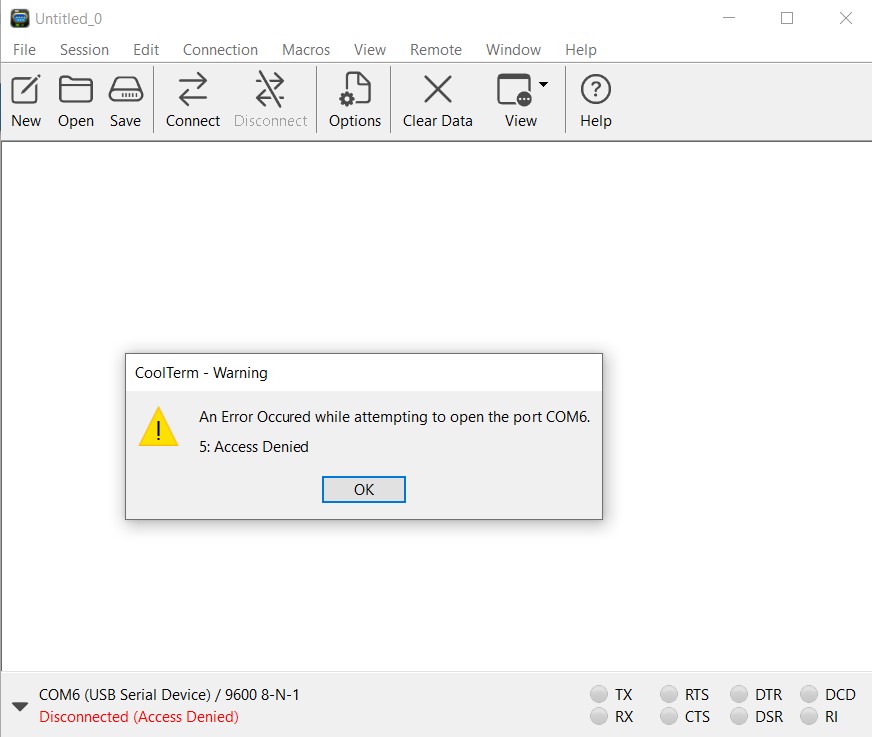
- I used “CoolTerm”, which is a software that acts as a serial port terminal, so I could see if my data were readible on the port or not.
-
I had an error message: the port could not be open -> that’s why no data were displayed on the web interface.
-
I found out on forums that it was because another program was using the port on the background -> I closed the window of visual studio code that was using the port to communicate with the microcontroller -> it worked.
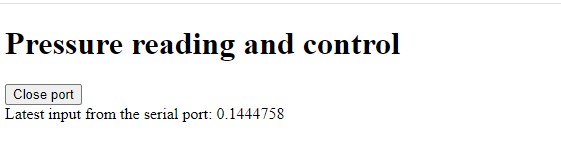
I was able to read the data on the interface, so I modified the initial code to my purpose, step by step. First, I deleted everything that I was not using, and I kept only the button to connect to the port, and the section to display my data.
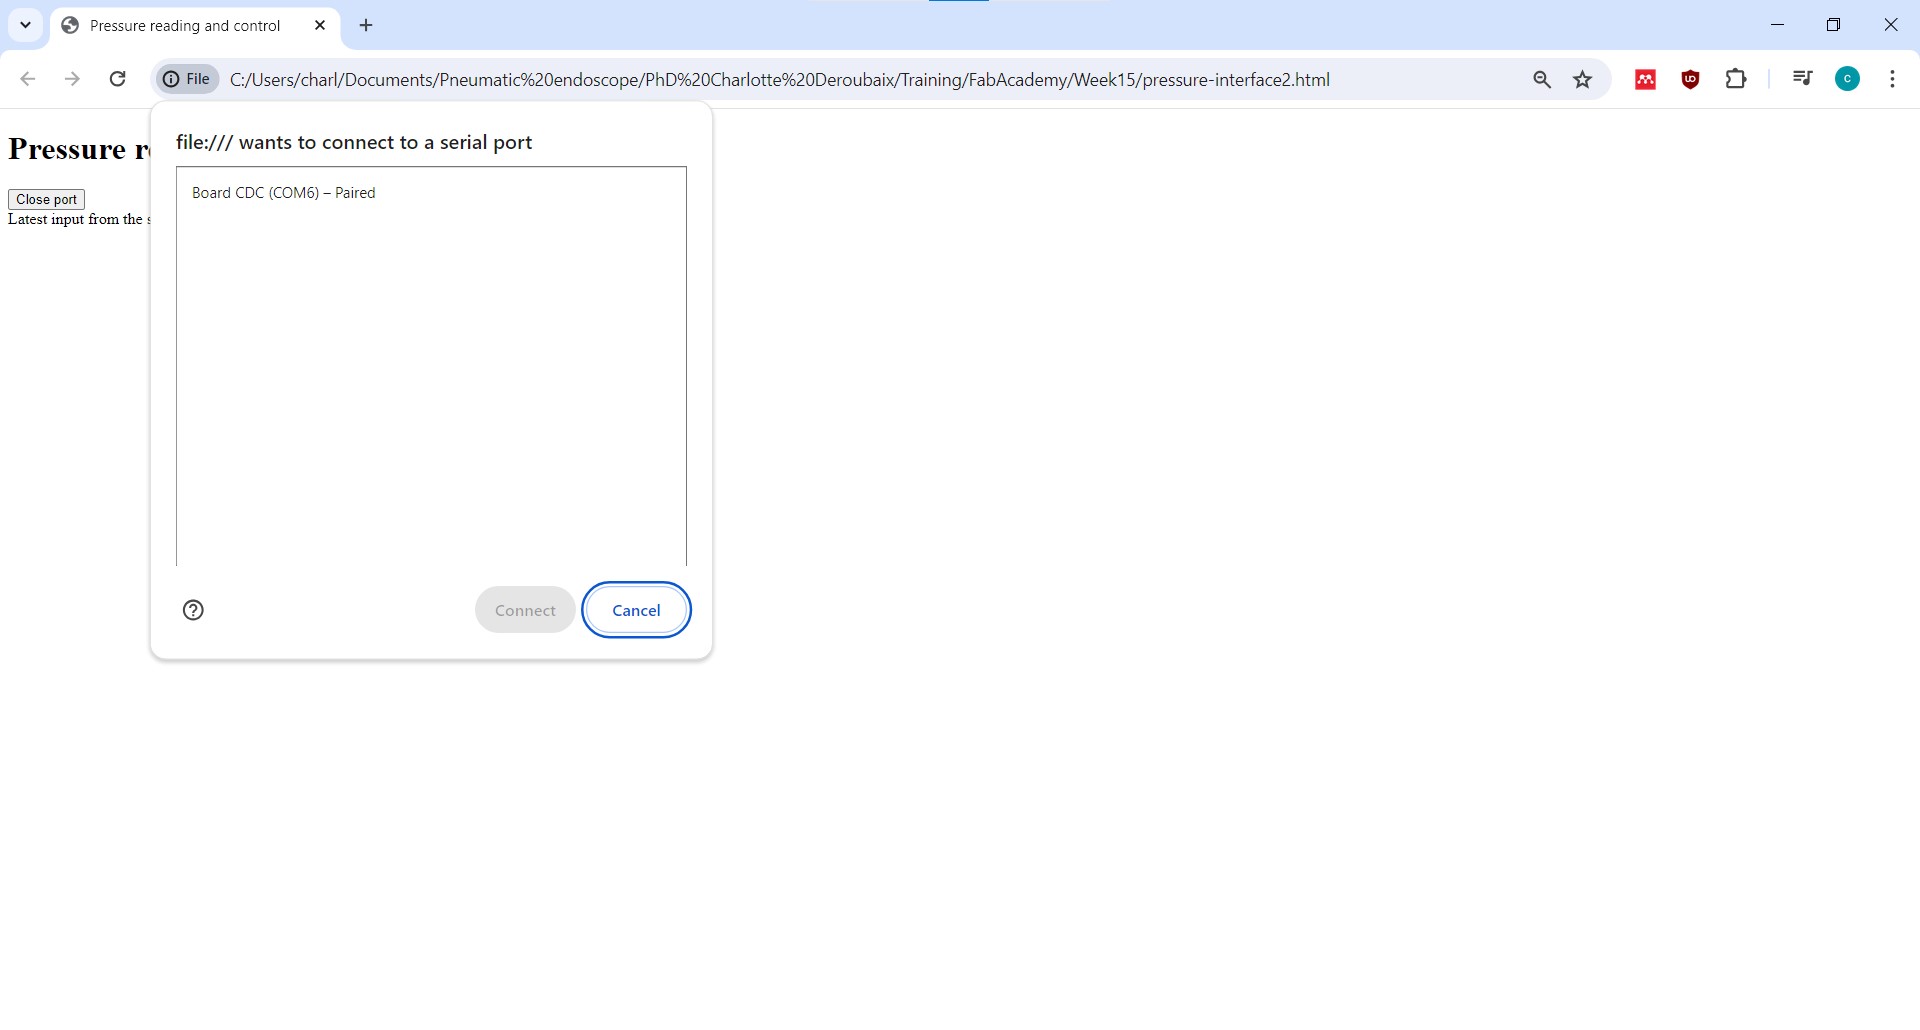
When clicking on the “open port” button, a window will pop pup with the port available -> you can select the port corresponding to the microcontroller and connect to it. When connected, the data will be displayed on the interface.
Code
In the script, we can have a look at the main functions that are used at this step:
To open the port
  async openPort(thisPort) {
    try {
      // if no port is passed to this function,
      if (thisPort == null) {
        // pop up window to select port:
        this.port = await navigator.serial.requestPort();
      } else {
        // open the port that was passed:
        this.port = thisPort;
      }
      // set port settings and open it:
      await this.port.open({ baudRate: 9600 });
      // start the listenForSerial function:
      this.serialReadPromise = this.listenForSerial();

    } catch (err) {
      // if there's an error opening the port:
      console.error("There was an error opening the serial port:", err);
    }
  }
To read the data coming from the microcontroller
async listenForSerial() {
    // if there's no serial port, return:
    if (!this.port) return;
    // while the port is open:
    while (this.port.readable) {
        // initialize the reader:
        this.reader = this.port.readable.getReader();
        try {
        // read incoming serial buffer:
        const { value, done } = await this.reader.read();
        if (value) {
            // convert the input to a text string:
            this.incoming.data = new TextDecoder().decode(value);

            // fire the event:
            parent.dispatchEvent(this.dataEvent);
        }
        if (done) {
            break;
        }
        } catch (error) {
        // if there's an error reading the port:
        console.log(error);
        } finally {
        this.reader.releaseLock();
        }
    }
}
To update the interface and display the received value
function serialRead(event) {
  readingsSpan.innerHTML = event.detail.data
  ;
}
Display data on a graphic
For the moment, the code just allow to print the value on the interface, but I would like to display the value in a graphic, and to update the graphic in real time everytime a new value is received on the port. I thus modified the code to do it. I used the“chart.js” library, which is a popular charting library for javascript.
I add a chart set up in the script:
//add by Charlotte Deroubaix
function setupChart() {
  const ctx = document.getElementById('myChart').getContext('2d');
  myChart = new Chart(ctx, {
    type: 'line',
    data: {
      labels: [], // Add received data labels here
      datasets: [{
        label: 'Pressure',
        data: [], // Add received data values here
        borderColor: 'rgb(75, 192, 192)',
        tension: 0.1
      }]
    },
    options: {
      scales: {
        x: {
          type: 'time', // Use 'time' for time scale
          time: {
            unit: 'second' // Adjust the time scale unit as needed
          }
        },
        y: {
          min:0,
          max:1 // Adjust the range of y axis based on the pressure data received (between 0 and 1 bar)
        }
      },
      responsive: false,
      maintainAspectRatio: false
    }
  });
}
And a function that will update the chart when I receive new data:
function updateChart(data) {
  if (data !== 0) {
    // Update chart data with the received data
    myChart.data.labels.push(new Date());
    myChart.data.datasets[0].data.push(data);
    myChart.update();
  }
}
I finally modified the previous SerialRead function that will update the data on the graph by calling the function updateChart(), in addition to the still print the data on the interface. I changed the way the data format in the function: previously, data were received and display in the interface as a string, now I use the “parseFloat” function to obtain a float and being able to plot it in the graphic.
function serialRead(event) {
  // Parse the received data as a float to be able to plot it in the graph
  const data = parseFloat(event.detail.data);

  // Check if the parsed data is a valid number
  if (!isNaN(data)) {
    // If valid, update the readingsSpan with the received data
    readingsSpan.innerHTML = data;
    // Update the chart with the received data
    updateChart(data);

  } else {
    // If NaN, display a message indicating invalid data
    readingsSpan.innerHTML = "Invalid data";

  }
}
Results
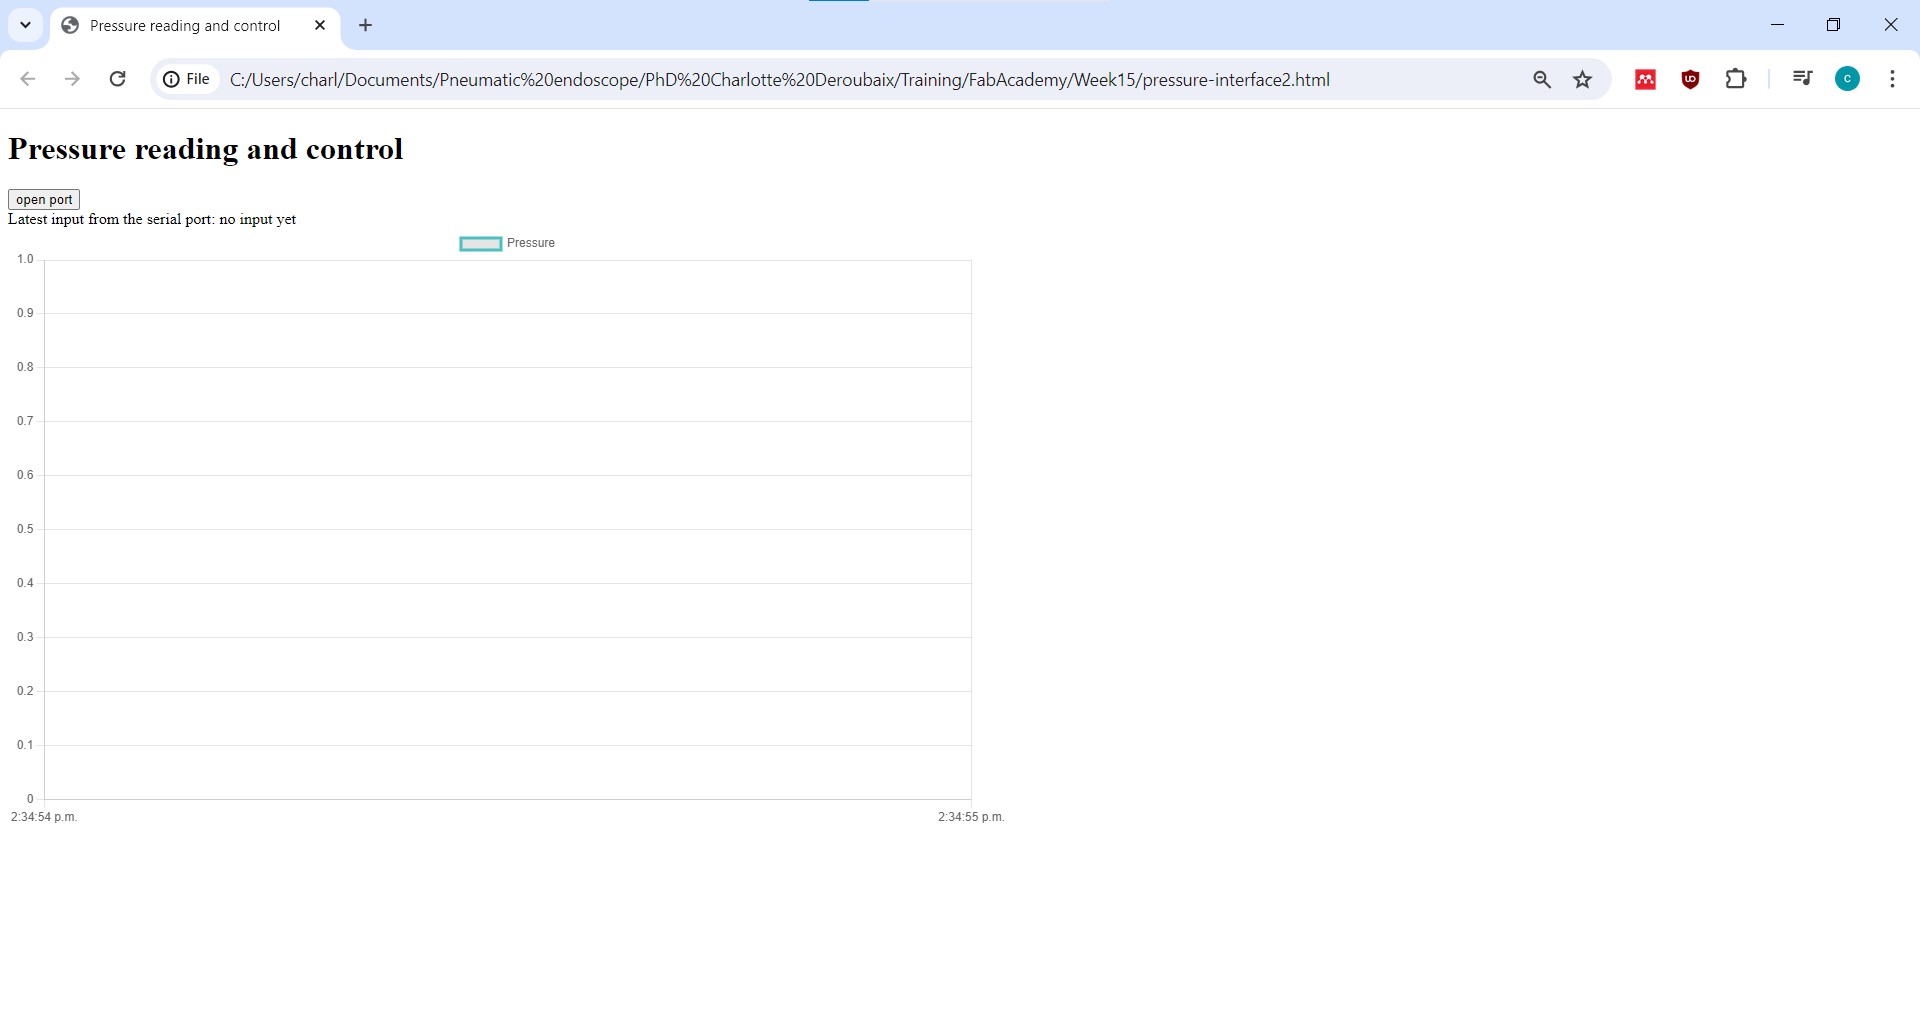
Interface with the graphic before starting the reading:
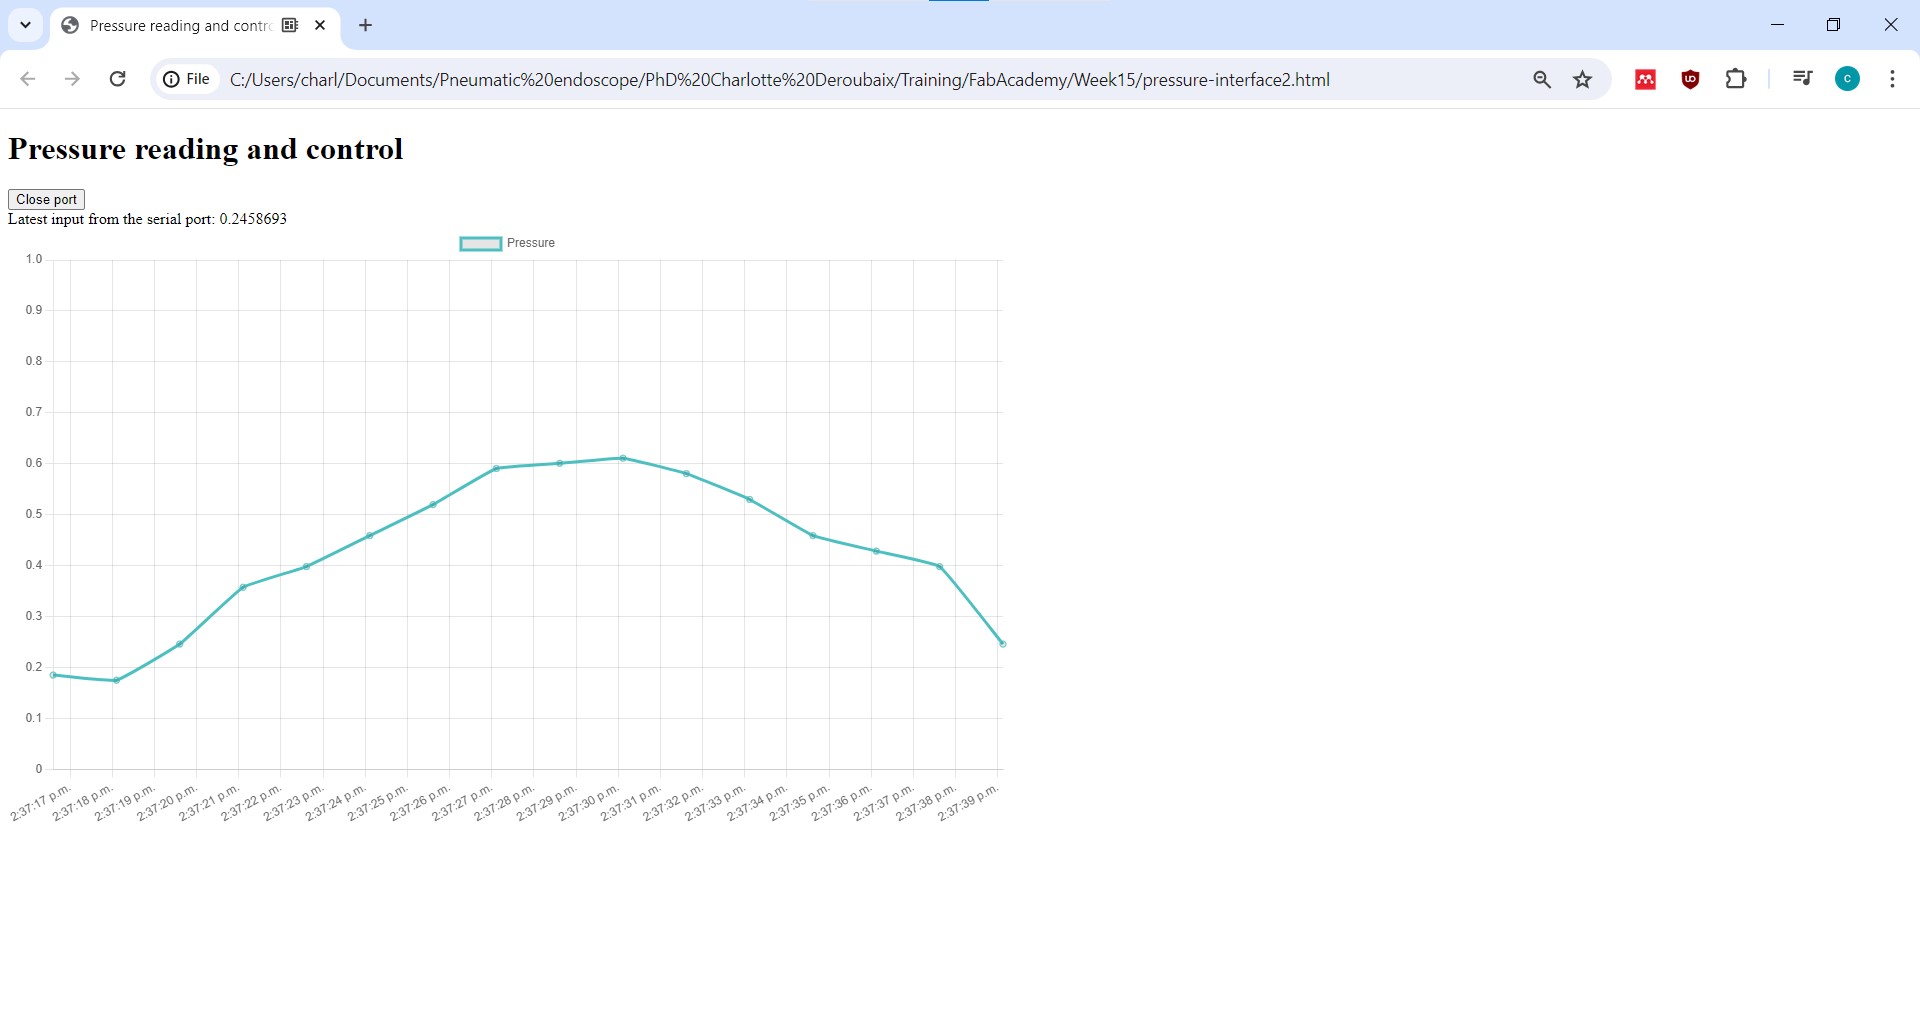
While reading:
Video of the result:
The interface can be used and tested here and the source files can be downloaded here .