Assignment 9: Input Devices
For this week 9 assignment, I am documenting my learning on Input Devices, covering their types, working principles, and how they interface with different microcontroller boards including the custom board I designed for this week.
I have detailed how I integrated both input and output devices with my board, along with the troubleshooting process I went through. Successfully, I managed to program my board and connect both an ultrasonic sensor and a Hall Effect sensor.
Additionally, my documentation includes reflections on what worked well, the challenges I faced, how I resolved them, and the improvements I would make in future assignments. I am also summarizing my key learning outcomes from this experience.
Highlight Moments of the Week


Basics of Input Devices
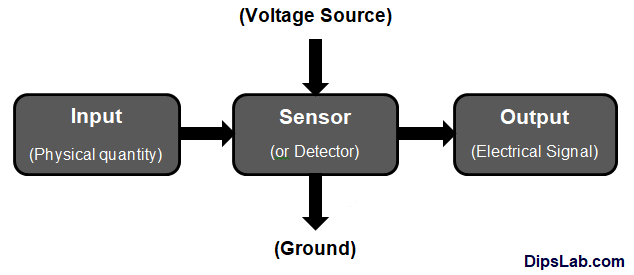
Input devices are essential components in electronics and computing, allowing systems to collect real-world data and interact with their environment. These devices convert physical parameters like motion, temperature, light, or sound into electrical signals that can be processed by microcontrollers or computers. They are widely used in automation, robotics, smart systems, and industrial applications to enhance functionality and responsiveness. The need for input devices arises from the requirement to monitor conditions, enable user interaction, and automate processes. Their advantages include improved accuracy, real-time data collection, and efficient control, while challenges may include calibration issues, environmental interference, and power consumption. Understanding input devices is crucial for designing responsive and intelligent electronic systems.
References:, Reference:1, Reference:2.
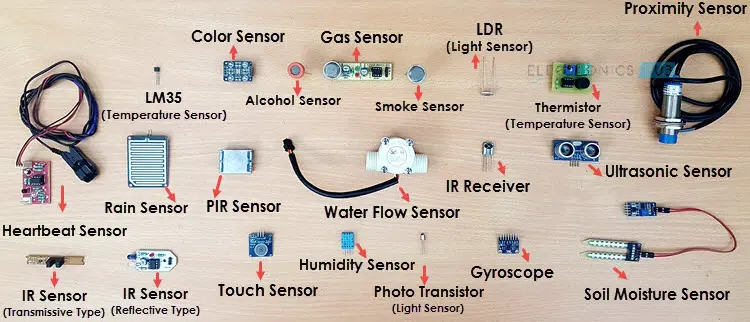
Types of Sensors:
Sensors are classified based on the type of physical quantity they detect. Common types include temperature sensors (e.g., thermocouples, RTDs) that measure heat, proximity sensors (e.g., infrared, ultrasonic) that detect object presence, and light sensors (e.g., LDR, photodiodes) that respond to light intensity. Magnetic sensors (e.g., Hall effect sensors) detect magnetic fields, while pressure sensors measure force or pressure variations. Every sensor generates a signal that corresponds to the measured quantity, ensuring accurate data collection for processing.
References:, Reference:
How a basic sensor works:
References:, Reference:
Characteristics of Sensors:
Sensors possess certain key characteristics that determine their performance and accuracy in measuring physical parameters. Some of the most important characteristics include:
Sensitivity – The ability of a sensor to detect small changes in the measured quantity and produce a proportional output.
Accuracy – The degree to which a sensor’s measurement matches the actual value of the physical quantity.
Resolution – The smallest detectable change in the measured value that the sensor can differentiate.
Linearity – The extent to which the sensor’s output signal is directly proportional to the input quantity over a given range.
Repeatability – The ability of a sensor to produce the same output when subjected to the same input conditions multiple times.
Response Time – The time taken by a sensor to react to a change in the measured parameter and produce a stable output.
Drift – The gradual change in sensor output over time due to factors like temperature, aging, or environmental conditions.
Range – The minimum and maximum values of the physical quantity that a sensor can measure accurately.
Hysteresis – The difference in output when the input quantity is increased versus when it is decreased, affecting measurement precision.
Stability – The ability of a sensor to maintain consistent performance over time and under varying conditions.
Each of these characteristics plays a crucial role in determining the effectiveness of a sensor in real-world applications
Classification of Sensors:
1. Based on the Quantity Being Measured Sensors are categorized according to the type of physical parameter they detect:
* Temperature Sensors – Devices like Resistance Temperature Detectors (RTD), Thermistors, and Thermocouples measure temperature variations.
* Pressure Sensors – Instruments such as Bourdon tubes, Manometers, Diaphragms, and Pressure Gauges detect pressure changes.
* Force/Torque Sensors – Examples include Strain Gauges and Load Cells, which measure force or torque.
* Speed/Position Sensors – Devices like Tachometers, Encoders, and Linear Variable Differential Transformers (LVDT) help measure speed or position.
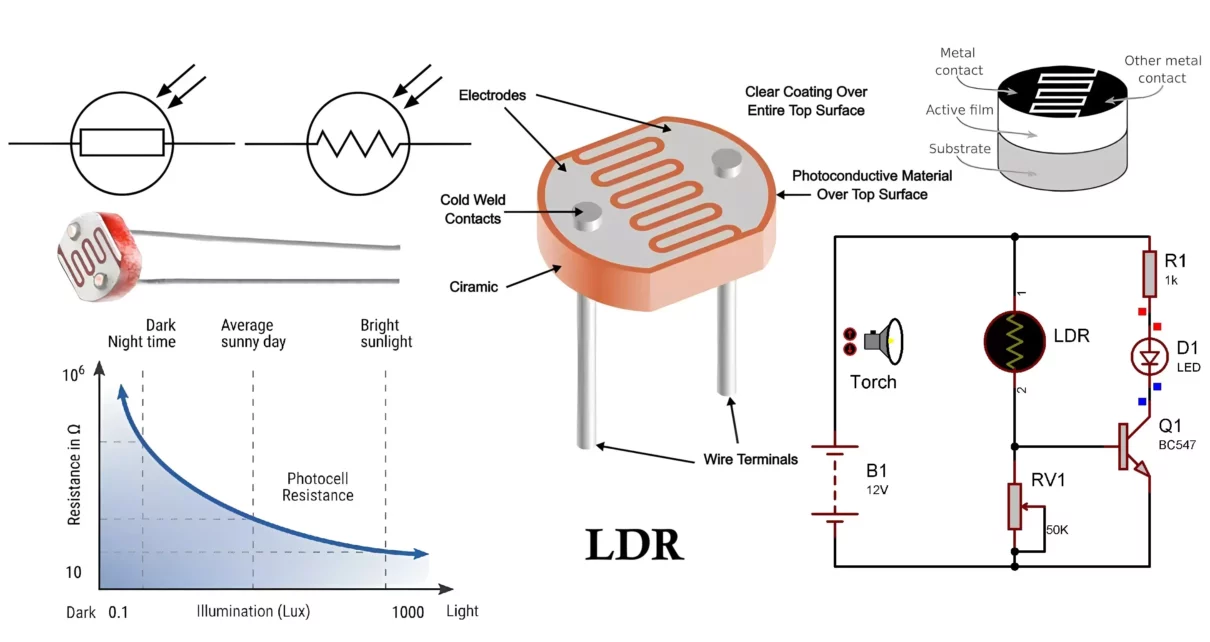
* Light Sensors – Components such as Photodiodes and Light Dependent Resistors (LDRs) detect light intensity.
2. Based on Power Requirement Sensors are also classified based on their need for an external power source:
* Active Sensors – These sensors generate their own electrical output without requiring an external power source. They operate using the energy derived from the measured parameter. For instance,piezoelectric crystals produce an electrical charge when exposed to acceleration or pressure.
* Passive Sensors – These require an external power supply to function. Mostresistive, inductive, and capacitive sensors fall into this category, similar to how resistors, inductors, and capacitors are considered passive components.
3. Analog and Digital Sensors
* Analog Sensors – These sensors provide output in a continuous signal format corresponding to the measured parameter. Examples include Thermocouples, RTDs, and Strain Gauges.
* Digital Sensors – These sensors produce output in discrete pulses or digital signals, rather than a continuous range. Encoders are a common example of digital sensors.
4. Inverse Sensors - Some sensors have a unique ability to convert a physical quantity into another form and also reverse the process. For instance, piezoelectric crystals generate a voltage when subjected to vibrations. Conversely, when an alternating voltage is applied to them, they begin to vibrate. This dual nature makes them highly suitable for applications like microphones and speakers.
Types of Sensors
Before documenting my work for this week on input devices, I will first discuss some of the sensors that I plan to test and analyze for my Assignment.
1.Ultrasonic Sensor
An ultrasonic sensor is a device that measures distance by using sound waves beyond the range of human hearing. It works by emitting high-frequency sound pulses and calculating the time taken for the echo to return after bouncing off an object. The sensor consists of a Transmitter that generates the ultrasonic waves and a Receiver that detects the reflected signals. The time delay between transmission and reception helps determine the distance of the object. These sensors are commonly used in Robotics, automation, and obstacle detection systems due to their reliability in detecting objects without physical contact. Ultrasonic sensors work well in various environments, including dark or dusty conditions, where optical sensors may fail. However, they can be affected by soft surfaces that absorb sound instead of reflecting it. They are widely used in applications like parking sensors, liquid level monitoring, and proximity detection. The accuracy of measurement depends on factors such as sensor placement, object material, and environmental conditions.
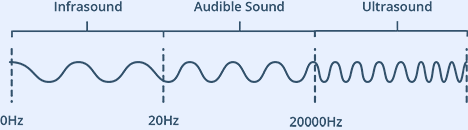
Humans can hear sound waves that vibrate in the range of about 20 times a second (a deep rumbling noise) to 20,000 times a second (a high-pitched whistle). However, ultrasound has a frequency of more than 20,000 Hz and is therefore inaudible to humans.
References:, Reference,
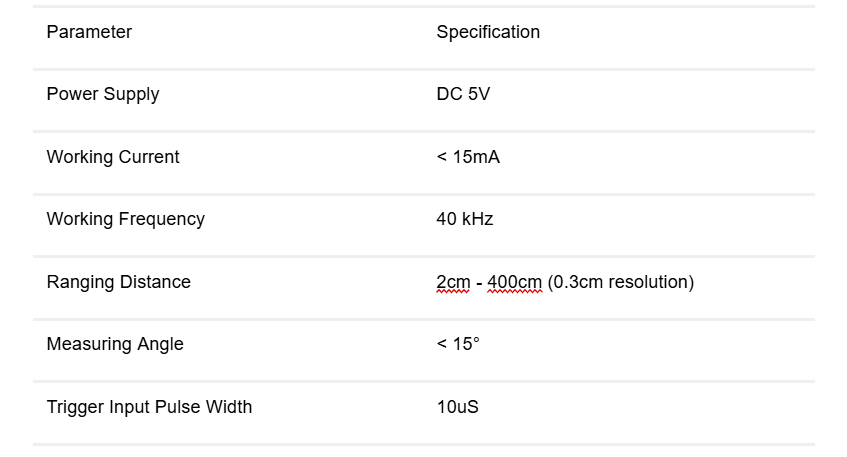
Technical Specifications for ultrasonic sensor
Below, we will look at the pin diagram of the ultrasonic sensor, which shows the different pins and their functions.
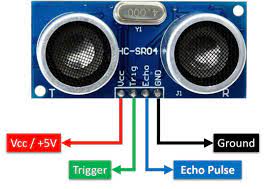
The ultrasonic sensor has the following four connections:
VCC – This is the 5 Volt positive power supply.
Trig – This is the “Trigger” pin, the one driven to send the ultrasonic pulses.
Echo – This is the pin that produces a pulse when the reflected signal is received. The length of the pulse is proportional to the time it took for the transmitted signal to be detected.
GND – This is the Ground pin.
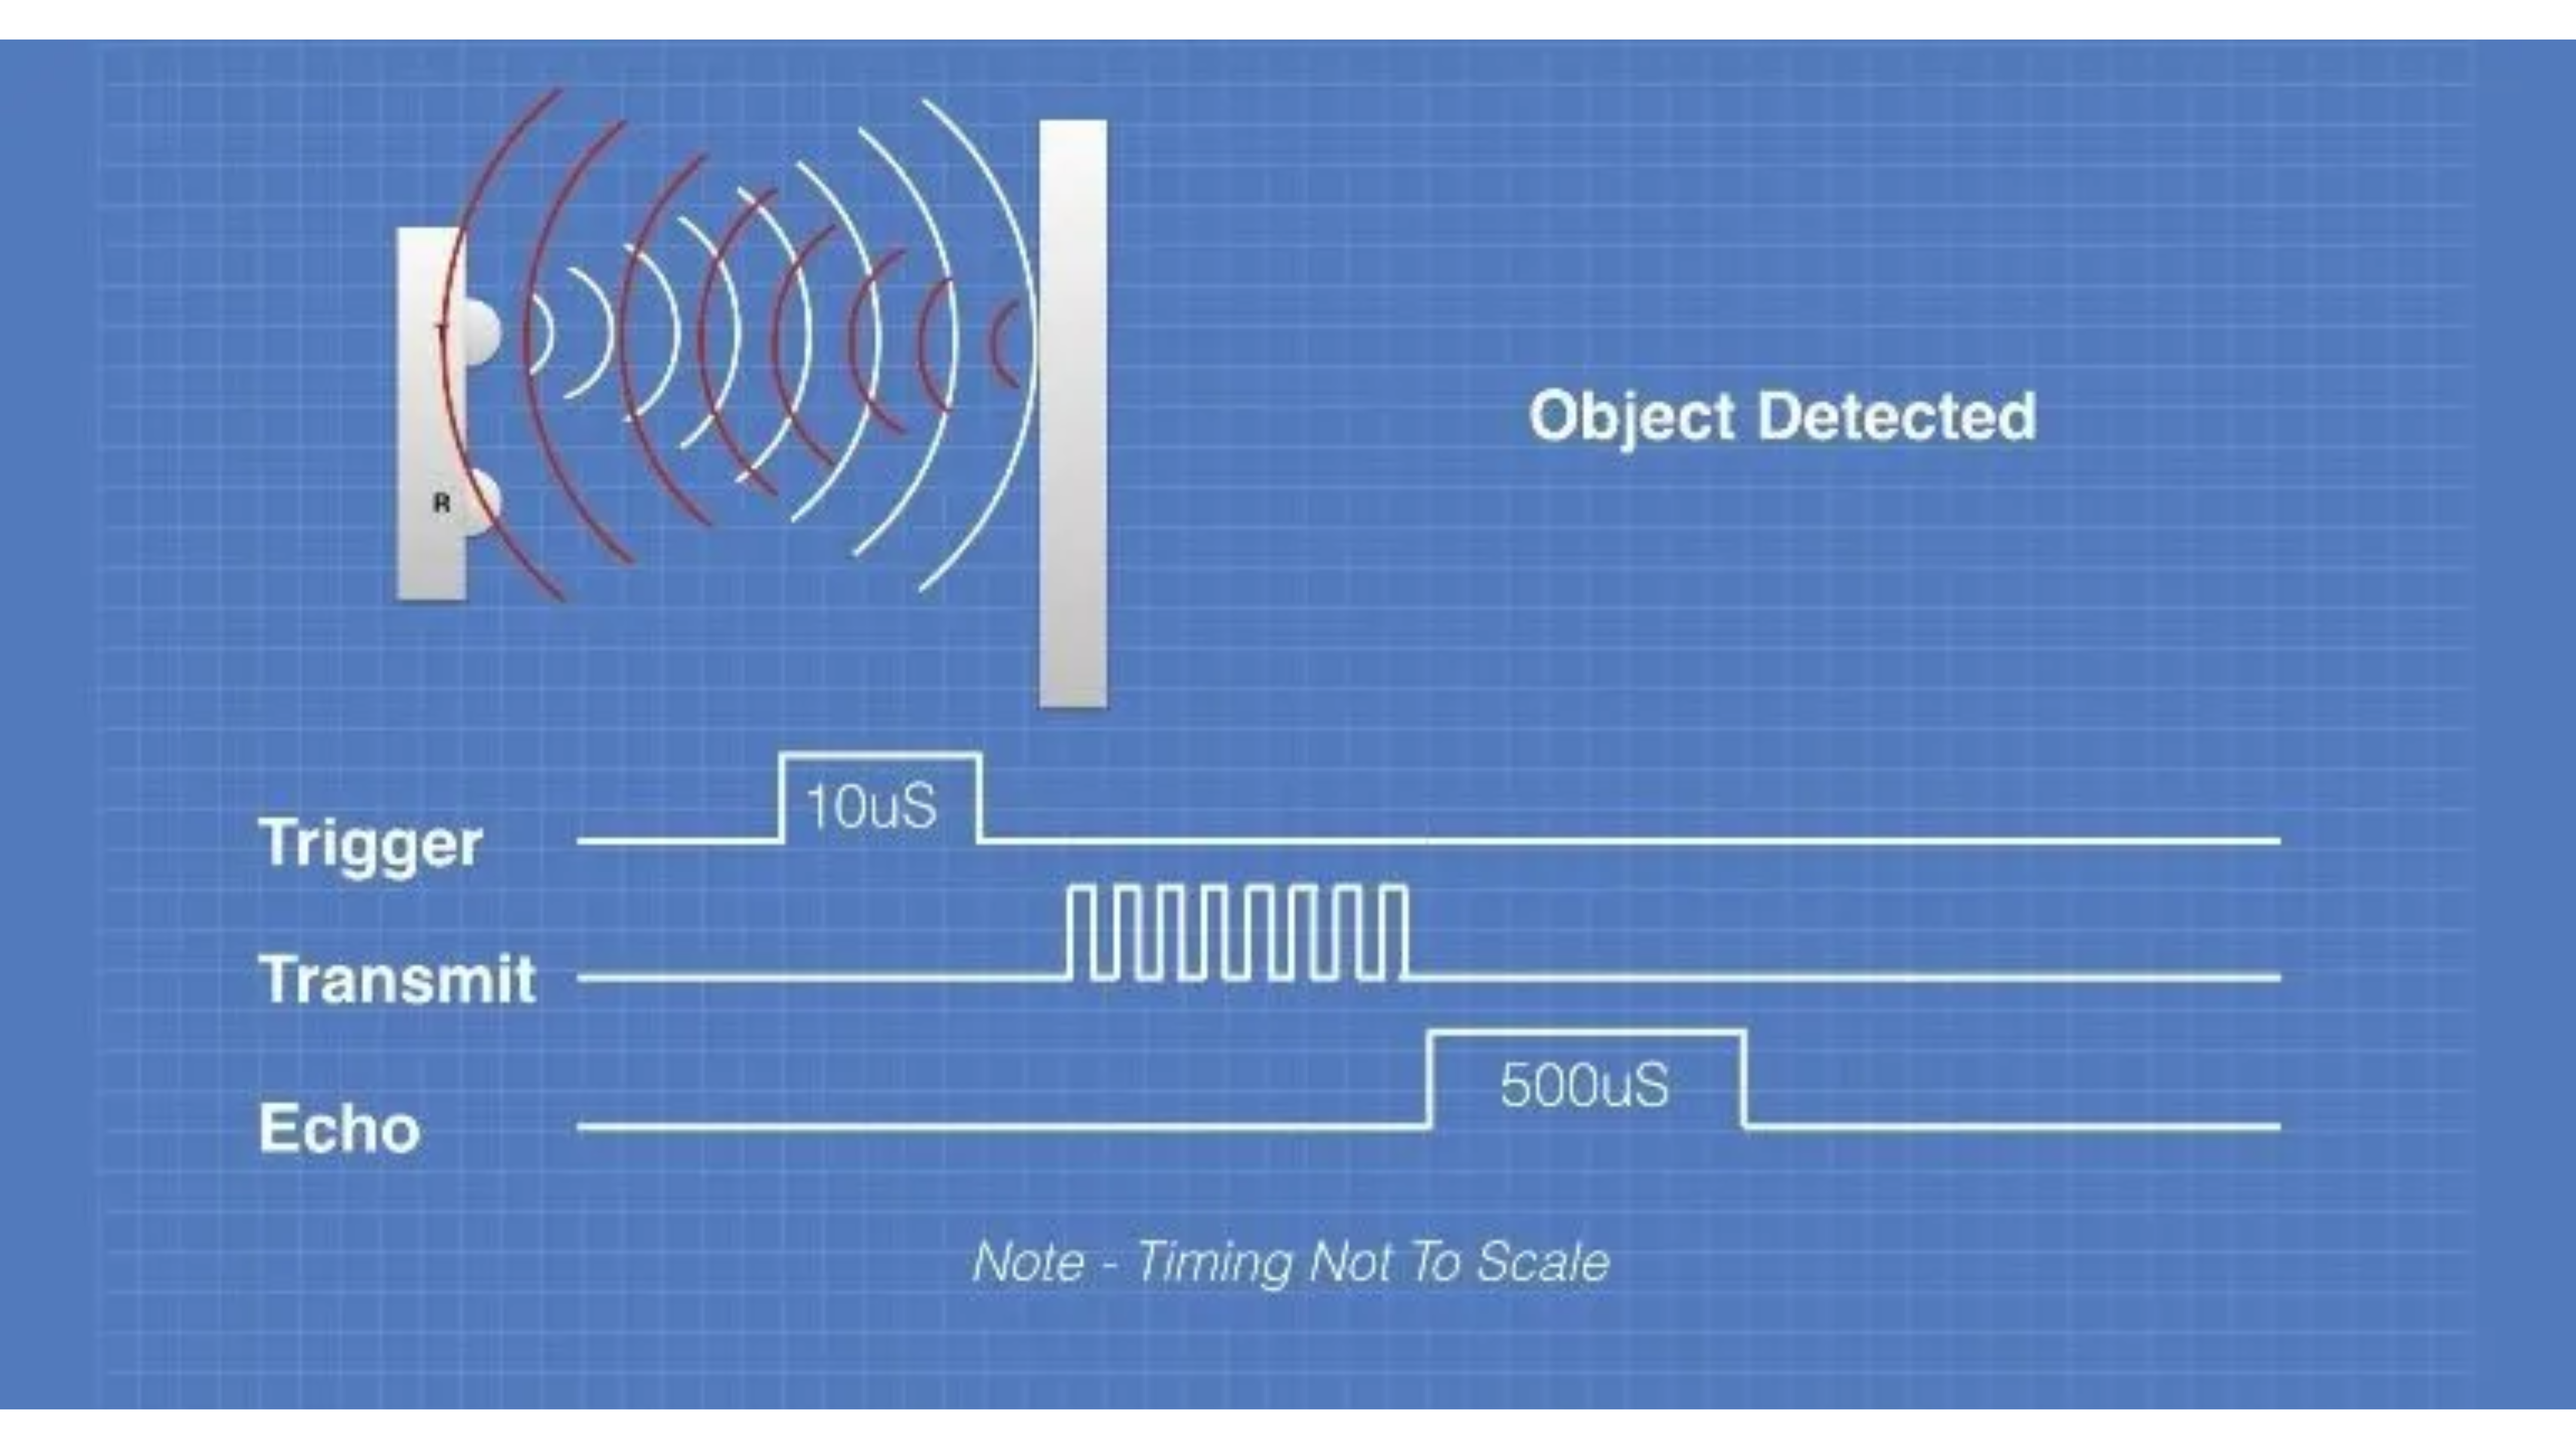
The Device Operates as Follows:
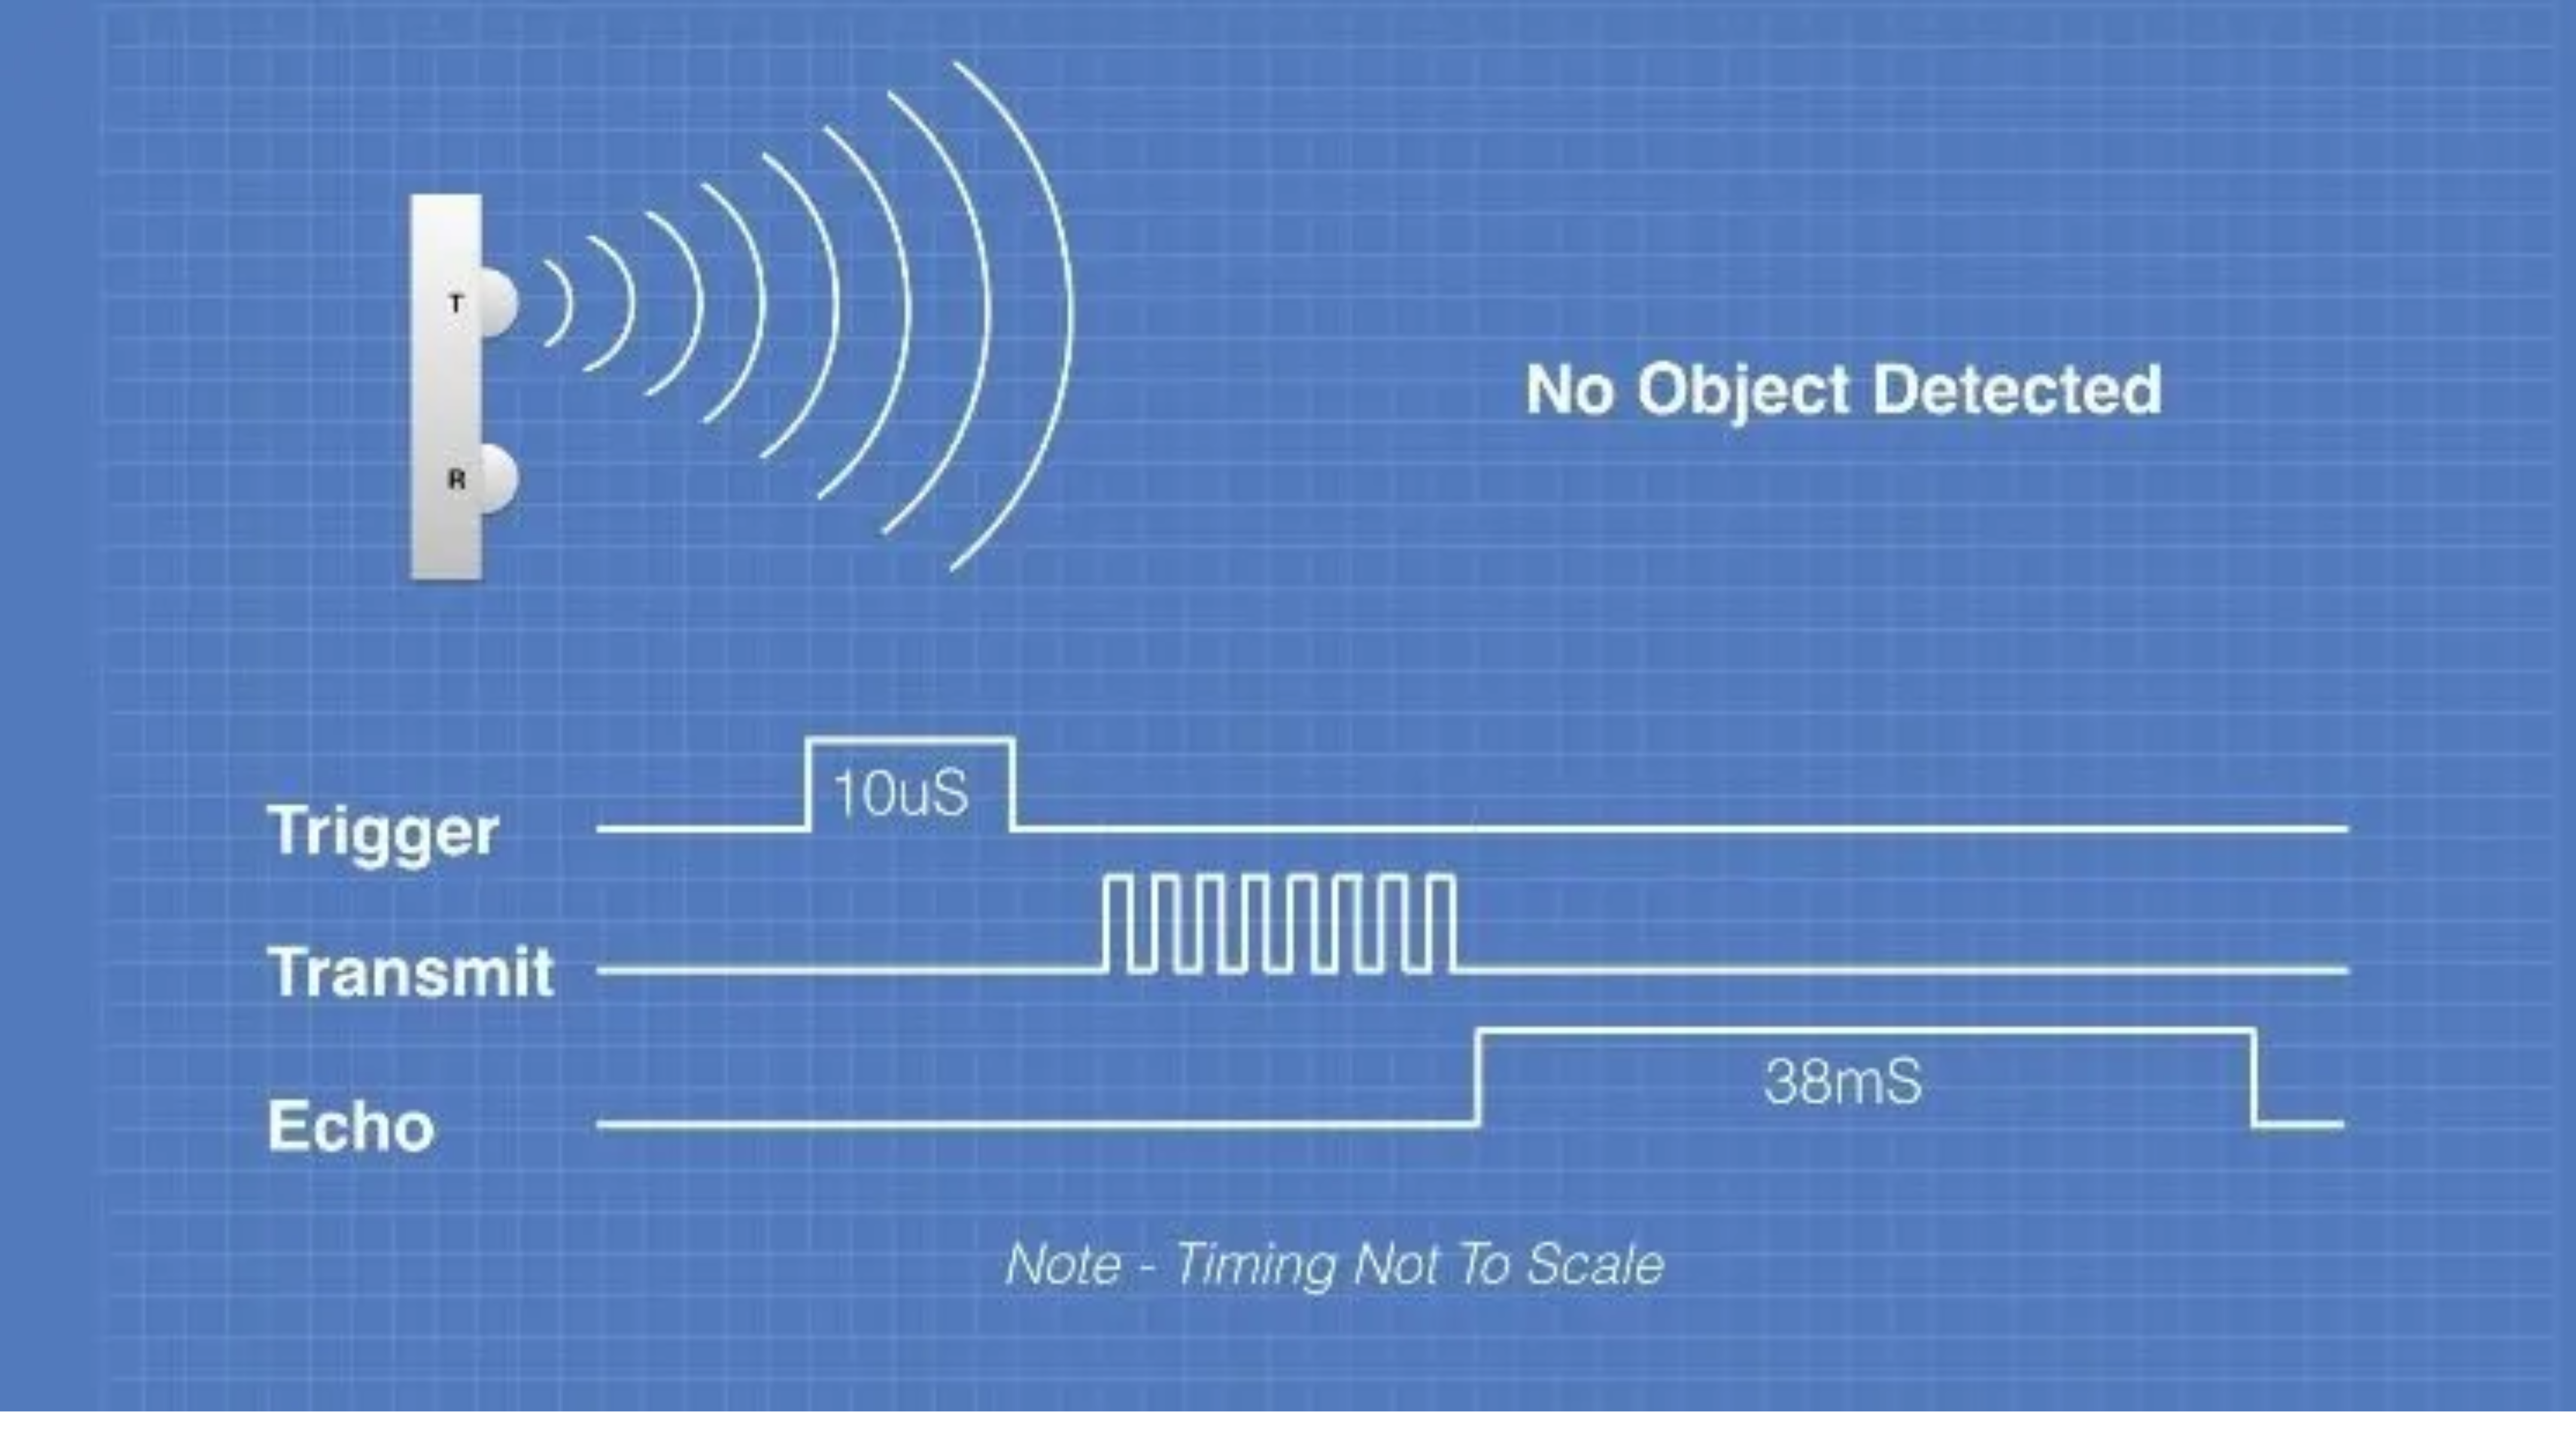
1. To operate, a 5V pulse of at least 10 microseconds is sent to the Trigger pin, prompting the HC-SR04 to emit a burst of eight 40 kHz ultrasonic pulses. This unique pattern helps the receiver differentiate the signal from background noise.
2.The Echo pin goes high as the pulses travel through the air. If no object reflects the signal, the Echo pin remains high for 38 milliseconds before timing out, indicating no obstacle within range. If an object is detected, the Echo pin goes low when the reflected pulse is received.
3. The duration of the Echo pulse (ranging from 150 microseconds to 25 milliseconds) corresponds to the time taken for the signal to travel to the object and return. Since this value represents the total time, the actual distance is calculated by dividing it by two.
References:, Reference,
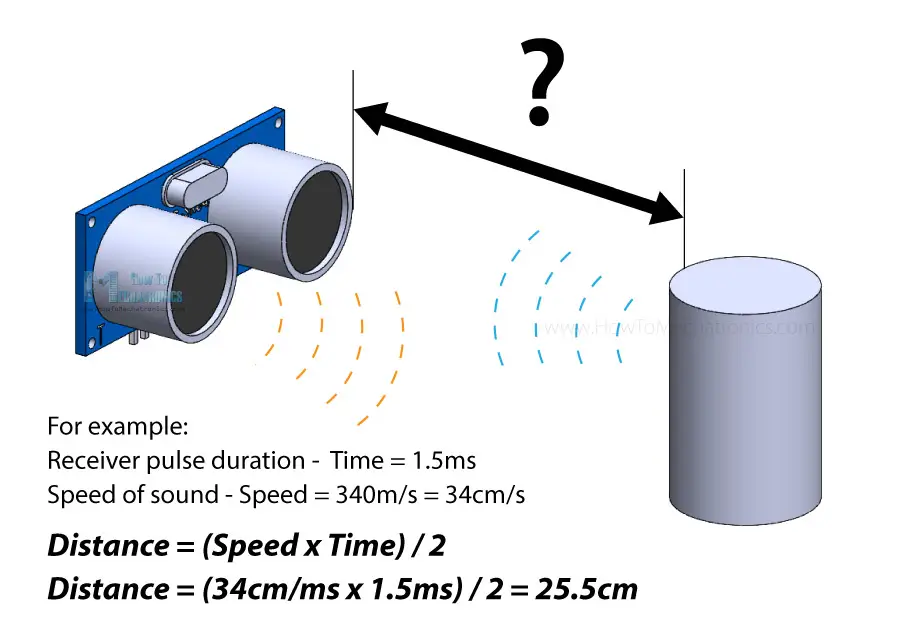
The distance is calculated using the formula based on the time taken for the ultrasonic waves to travel to the object and back. Below, we will see an image illustrating this calculation.
References:, Reference,
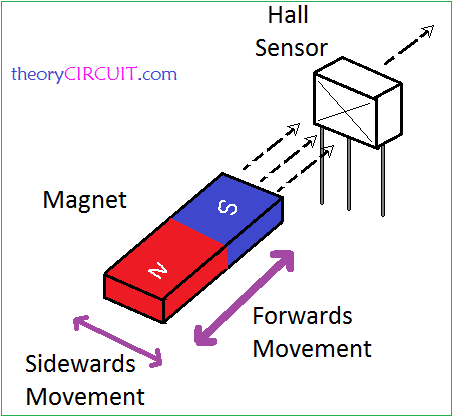
2.Hall Effect Sensor
A Hall Effect sensor is a device that detects the presence and strength of a magnetic field. It operates based on the Hall Effect, which states that when a conductor carrying current is exposed to a perpendicular magnetic field, a voltage (Hall voltage) is generated across the conductor.
What is Hall Effect?
When a voltage source is applied to a conductor plate, electrons and holes move toward their respective opposite polarity terminals. In the presence of a magnetic field, these charge carriers experience a force known as the Lorentz Force, which causes them to deviate from their usual path. However, in the absence of a magnetic field, the charge carriers travel in a nearly straight-line trajectory. This deviation due to the magnetic field results in the Hall Effect within the conductor plate.
Block Diagram of Hall Effect Sensor
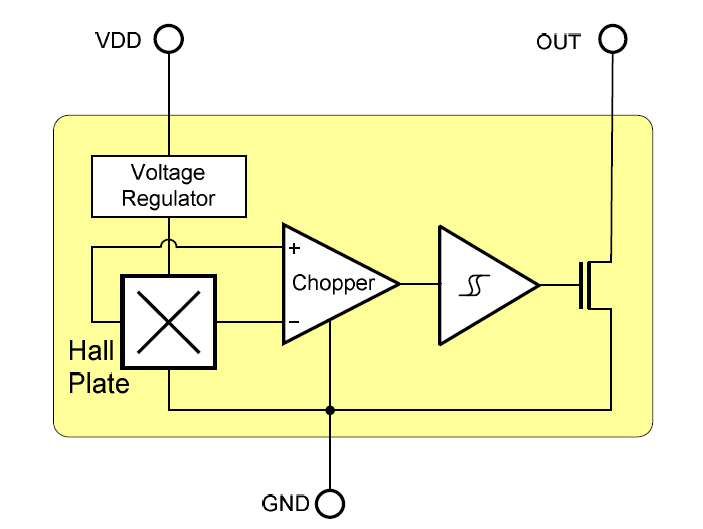
A typical Hall Effect sensor consists of three key components: the Hall plate, Voltage Regulator
, and Chopper circuit.
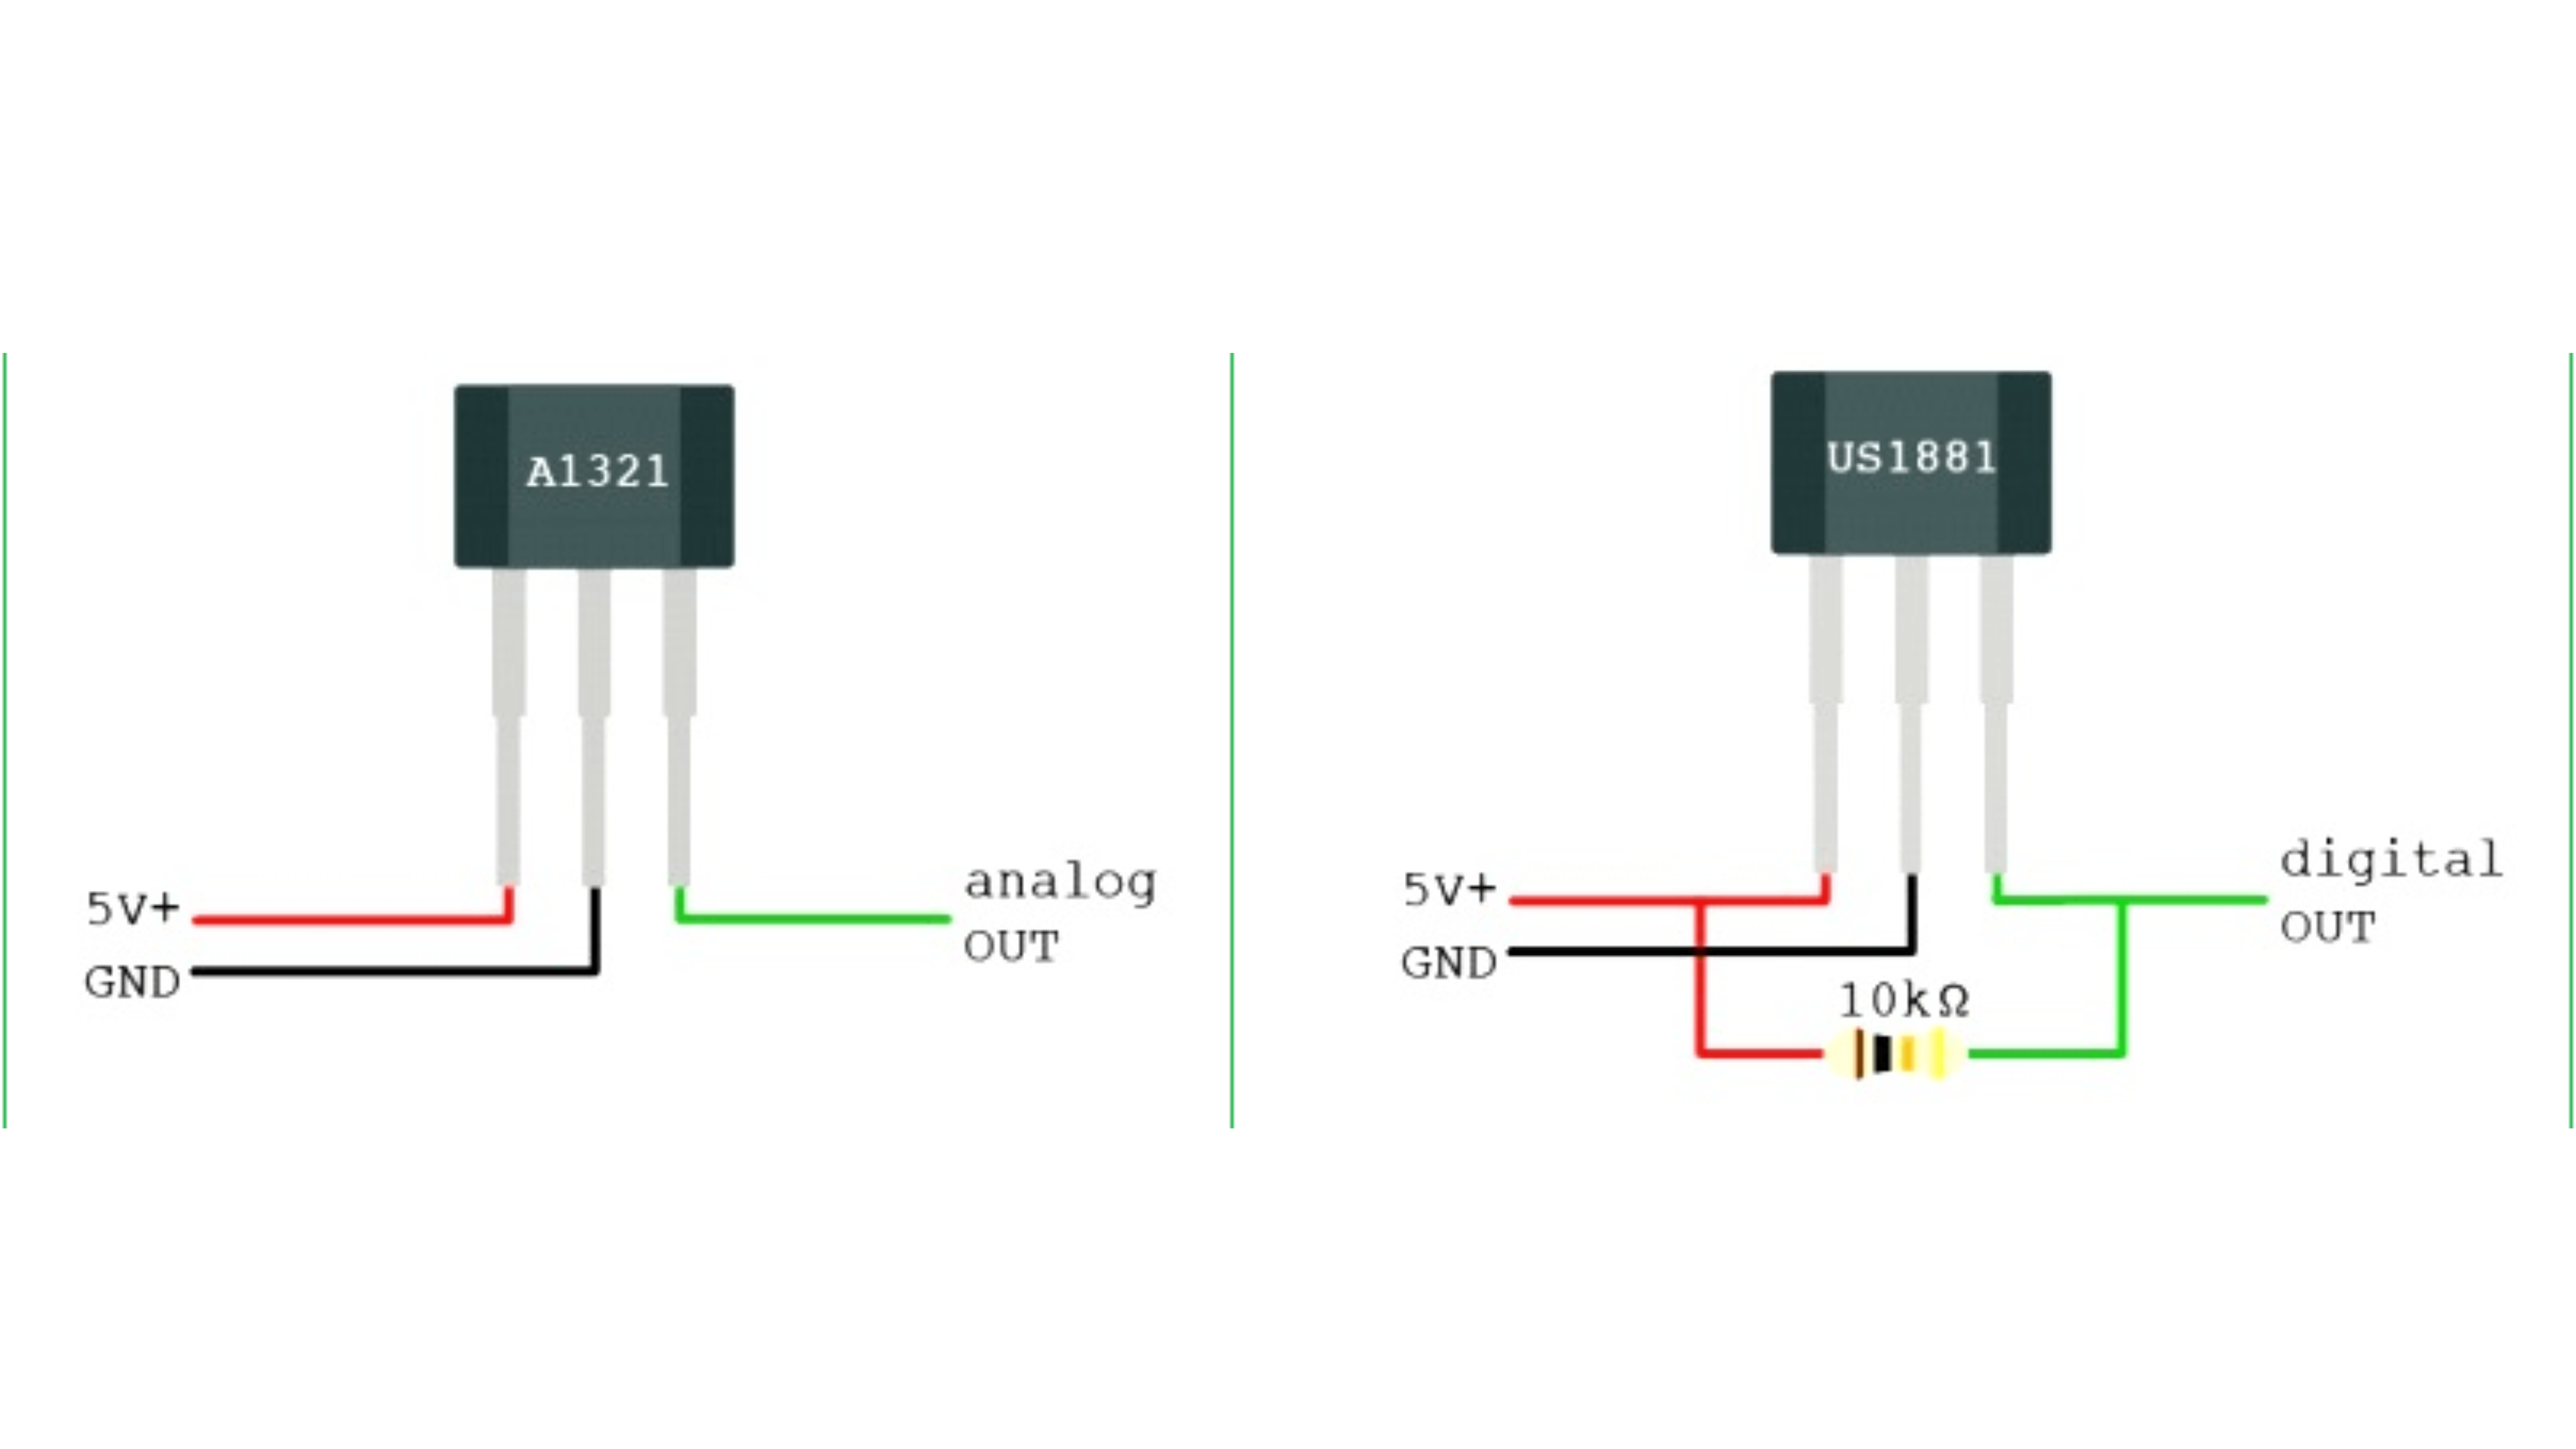
Hall Effect sensors are categorized into two types: Linear Output Sensors and Digital Output Sensors. In linear sensors, the output signal is directly taken from an operational amplifier, which amplifies the Hall voltage generated by the Hall plate. However, in digital sensors, a Schmitt trigger circuit is included, which processes the Hall voltage and converts it into a binary ON/OFF output. This means the digital sensor provides a clear switching response depending on the presence or absence of a magnetic field.
Working Principle of a Hall Effect Sensor:
AHall Effect sensor operates based on the Hall Effect, which occurs when an electric current flows through a conductor or semiconductor placed in a perpendicular magnetic field. As the magnetic field interacts with the moving charge carriers (electrons and holes), they experience a force called the Lorentz Force, which pushes them to one side of the material. This results in a voltage difference across the sensor, known as the Hall voltage.
This small Hall voltage is then amplified and processed using signal conditioning circuits. Depending on the type of sensor:
1.Linear Hall sensors provide an analog voltage output proportional to the strength of the magnetic field.
2.Digital Hall sensors use a Schmitt trigger to convert the signal into a binary ON/OFF output, switching states when the magnetic field crosses a threshold.
Hall Effect sensors are widely used in applications such as position sensing, speed detection, and current measurement, as they provide a reliable, contactless method for detecting magnetic fields.
References:, Reference,
Connecting Hall Effect Sensor
Understanding IR (Infrared) Sensors
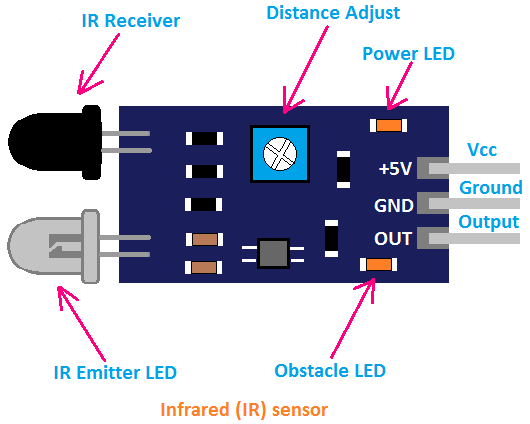
An IR (Infrared) sensor is an electronic device that detects infrared radiation emitted by objects. It works by either transmitting and receiving infrared light (active IR sensors) or simply detecting IR radiation from objects (passive IR sensors). These sensors are widely used in motion detection, object tracking, proximity sensing, and communication systems.
There are two main types of IR sensors:
1.Active IR Sensors – These sensors have an infrared LED that emits IR light, and a photodiode that detects the reflected light from an object. They are used in obstacle detection, line-following robots, and remote controls.
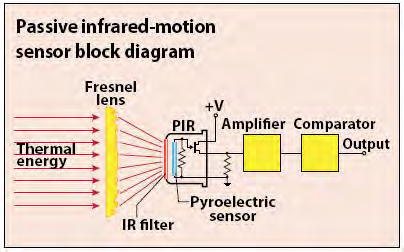
2.Passive IR Sensors (PIR Sensors) – These sensors detect the infrared radiation naturally emitted by warm objects, such as humans and animals. They are commonly used in motion detectors for security systems and automatic lighting.
IR sensors are essential in many applications, including automation, robotics, remote controls, and touchless devices. They offer a simple and efficient way to sense the environment and interact with electronic systems.
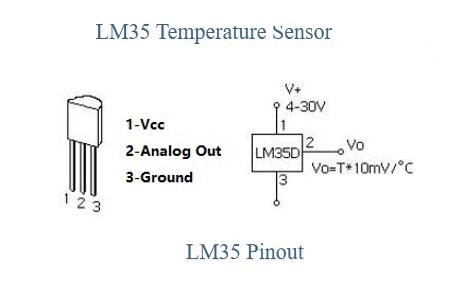
LM35 Temperature Sensor
The LM35 is a temperature sensor that provides readings in degrees Celsius. It works by generating a voltage output that increases by 10mV for every 1°C rise in temperature. The sensor operates within a voltage range of 4V to 30V and has three pins: VCC for power, OUT for temperature output, and GND for ground connection. It is commonly used with microcontrollers like Arduino to measure temperature in real-time. The LM35 does not require calibration, making it easy to use in various projects. It consumes very little power and does not heat up significantly, ensuring accurate temperature readings. Due to its high precision and efficiency, it is widely used in home automation, weather monitoring, industrial systems, and IoT applications. Its simple design and reliability make it a great choice for temperature measurement in electronics projects.
Group Assignment :
Objective of the IGroup Assignment
-Measured and analyzed the analog levels and digital signals of an input device using an oscilloscope to understand its behavior.
- Recorded observations on the group work page and documented personal learnings and reflections on my individual page.
Input Devices week, we learned:
In this experiment, an oscilloscope and an XIAO ESP32-C3 microcontroller are used to study and analyze digital and analog signals. A LED is utilized to observe digital signals, while an LDR (light-dependent resistor) sensor generates analog signals. The oscilloscope displays these signals, providing a clearer understanding of their behavior and characteristics.
Hardware Components
- XIAO ESP32-C3 Board
- LDR (Light Dependent Resistor)
- Oscilloscope (2-channel recommended)
- Connecting Wires
Circuit Connections
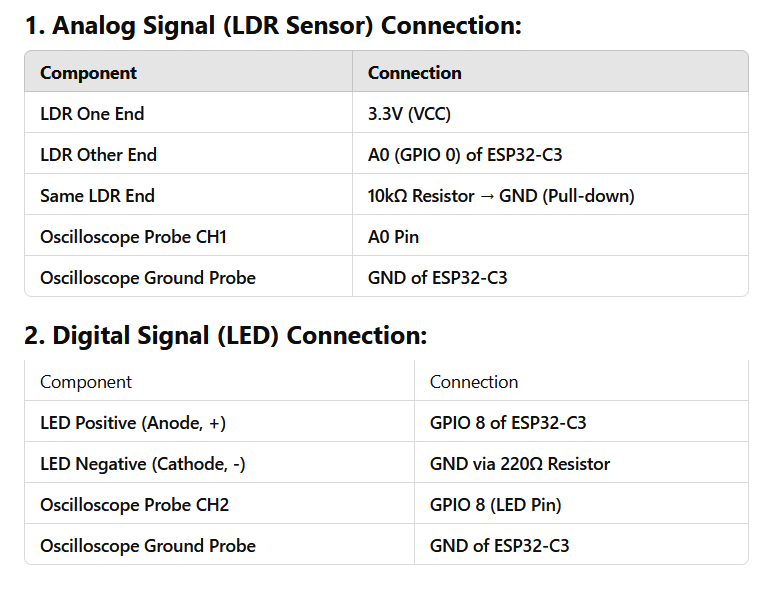
Code for programming
Arduino Code:Code for Analog Signal
            const int ldrPin = A0;      // Connect LDR to Analog pin A0
            const int ledPin = 8;       // Connect LED to digital pin 8
            const int threshold = 1800; // Set threshold (ESP32 12-bit ADC = max 4095)

            void setup() {
                pinMode(ledPin, OUTPUT);  // Set LED pin to Output mode
                Serial.begin(115200);     // Set baud rate to 115200 for ESP32
            }

            void loop() {
                int ldrValue = analogRead(ldrPin); // Read LDR value
                Serial.print("LDR Analog Value: ");
                Serial.println(ldrValue);

                // Convert LDR reading to digital signal
                if (ldrValue > threshold) {
                digitalWrite(ledPin, HIGH);  // Turn LED ON in darkness (HIGH Signal)
                Serial.println("Digital Signal: HIGH");
                } else {
                digitalWrite(ledPin, LOW);   // Turn LED OFF in light (LOW Signal)
                Serial.println("Digital Signal: LOW");
                }

                delay(500); // Wait for 500ms
            }
Arduino Code:Code for Didital Signal
            const int ldrPin = A0;      // Connect LDR to Analog pin A0
            const int ledPin = 8;       // Connect LED to digital pin 8
            const int threshold = 1800; // Set threshold (ESP32 12-bit ADC = max 4095)

            void setup() {
                pinMode(ledPin, OUTPUT);  // Set LED pin to Output mode
                Serial.begin(115200);     // Set baud rate to 115200 for ESP32
            }

            void loop() {
                int ldrValue = digitalRead(ldrPin); // Read LDR value
                Serial.print("LDR digital Value: ");
                Serial.println(ldrValue);

                // Convert LDR reading to digital signal
                if (ldrValue > threshold) {
                digitalWrite(ledPin, HIGH);  // Turn LED ON in darkness (HIGH Signal)
                Serial.println("Digital Signal: HIGH");
                } else {
                digitalWrite(ledPin, LOW);   // Turn LED OFF in light (LOW Signal)
                Serial.println("Digital Signal: LOW");
                }

                delay(500); // Wait for 500ms
            }
Single of the sensor in oscilloscopeg
Digital and nalog signal With oscilloscope
Observations on Oscilloscope
1. Digital Signal (LED Blinking):
-LED ON: High Signal (3.3V)
-LED OFF: Low Signal (0V)
-The oscilloscope Output: A square wave, as the LED toggles ON/OFF dependent on LDR input.
2. Analog Signal (Ch1's LDR Sensor):
Condition of Bright Light: High voltage (about 3.3V)
Low voltage (around 0V) in the dark
The oscilloscope Output: An analog waveform with a smooth variation in signal strength.
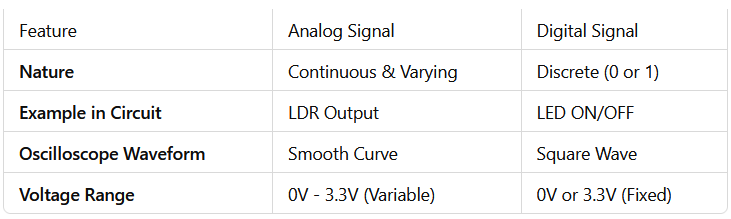
Comparison: Analog vs Digital Signal
Group Assignment Conclusion
The oscilloscope's CH1 successfully displayed the LDR's analog signal, which fluctuates continually depending on light intensity.and the LED's digital signal was seen as a square wave that alternated between HIGH (3.3V) and LOW (0V).
By evaluating the circuit and software implementation, the oscilloscope assisted in confirming the behavior of the real-time signals.
Individual Assignment
Objective of the Individual Assignment:
-Integrate a sensor with a custom-designed microcontroller board.
-Capture data from the sensor and interpret the readings.
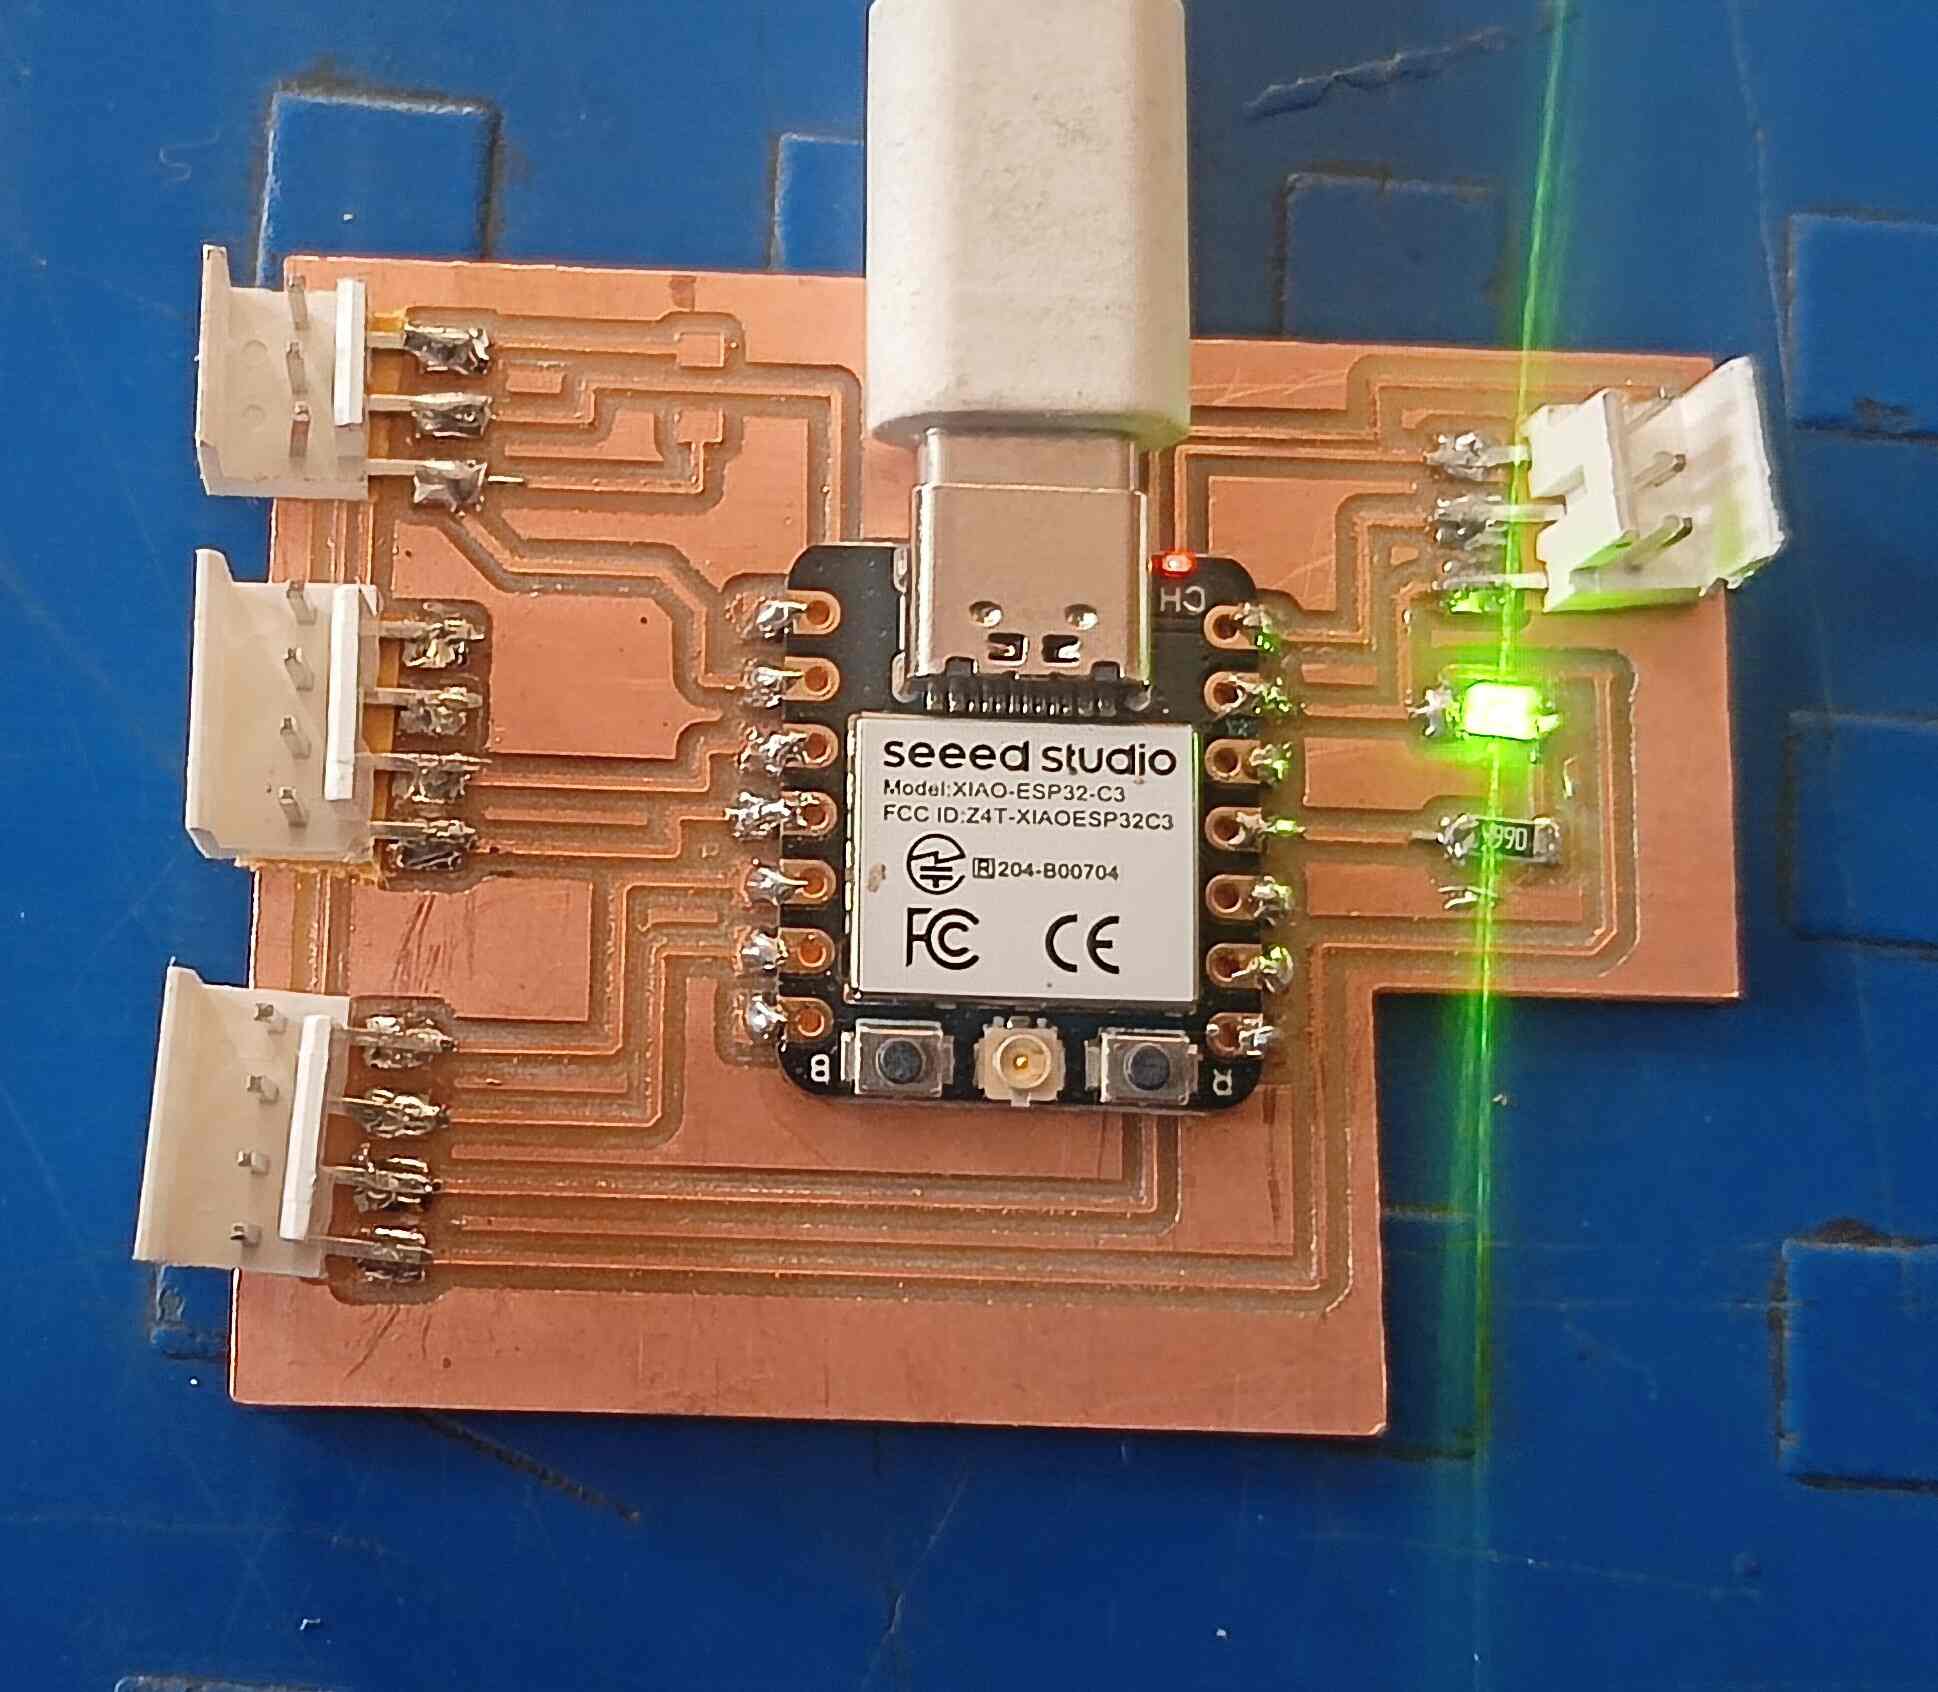
Plan for My Individual Assignment:
Before starting my input device assignment, I explored various input devices to understand their functionalities. I decided to use an ultrasonic sensor to measure distance and a Hall Effect sensor to detect the strength of a magnetic field. I also included an LED indicator to provide visual feedback based on sensor data.
For additional functionality, I added an extra 3-pin header for future expansions. After finalizing my sensor selection, I considered the microcontroller options and decided to use the ESP-C3 for my project. With a clear plan in mind, I started designing my custom PCB using KiCad.
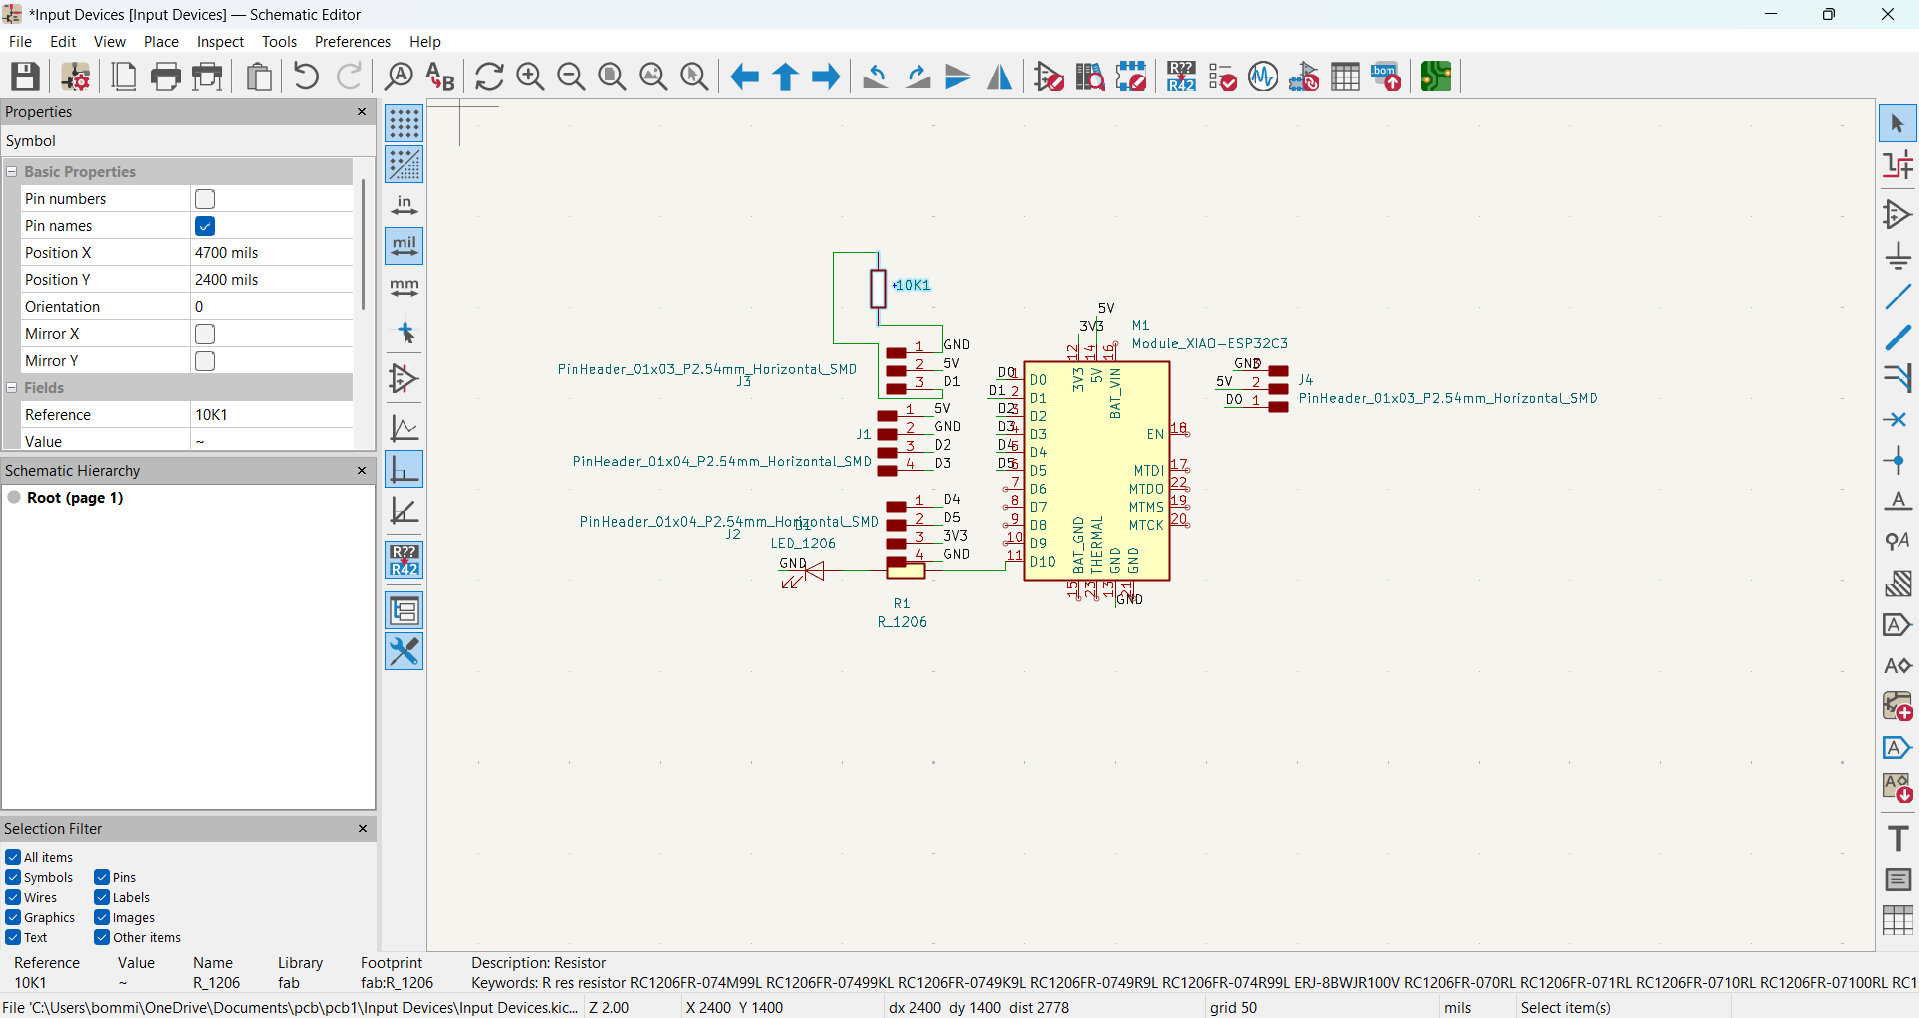
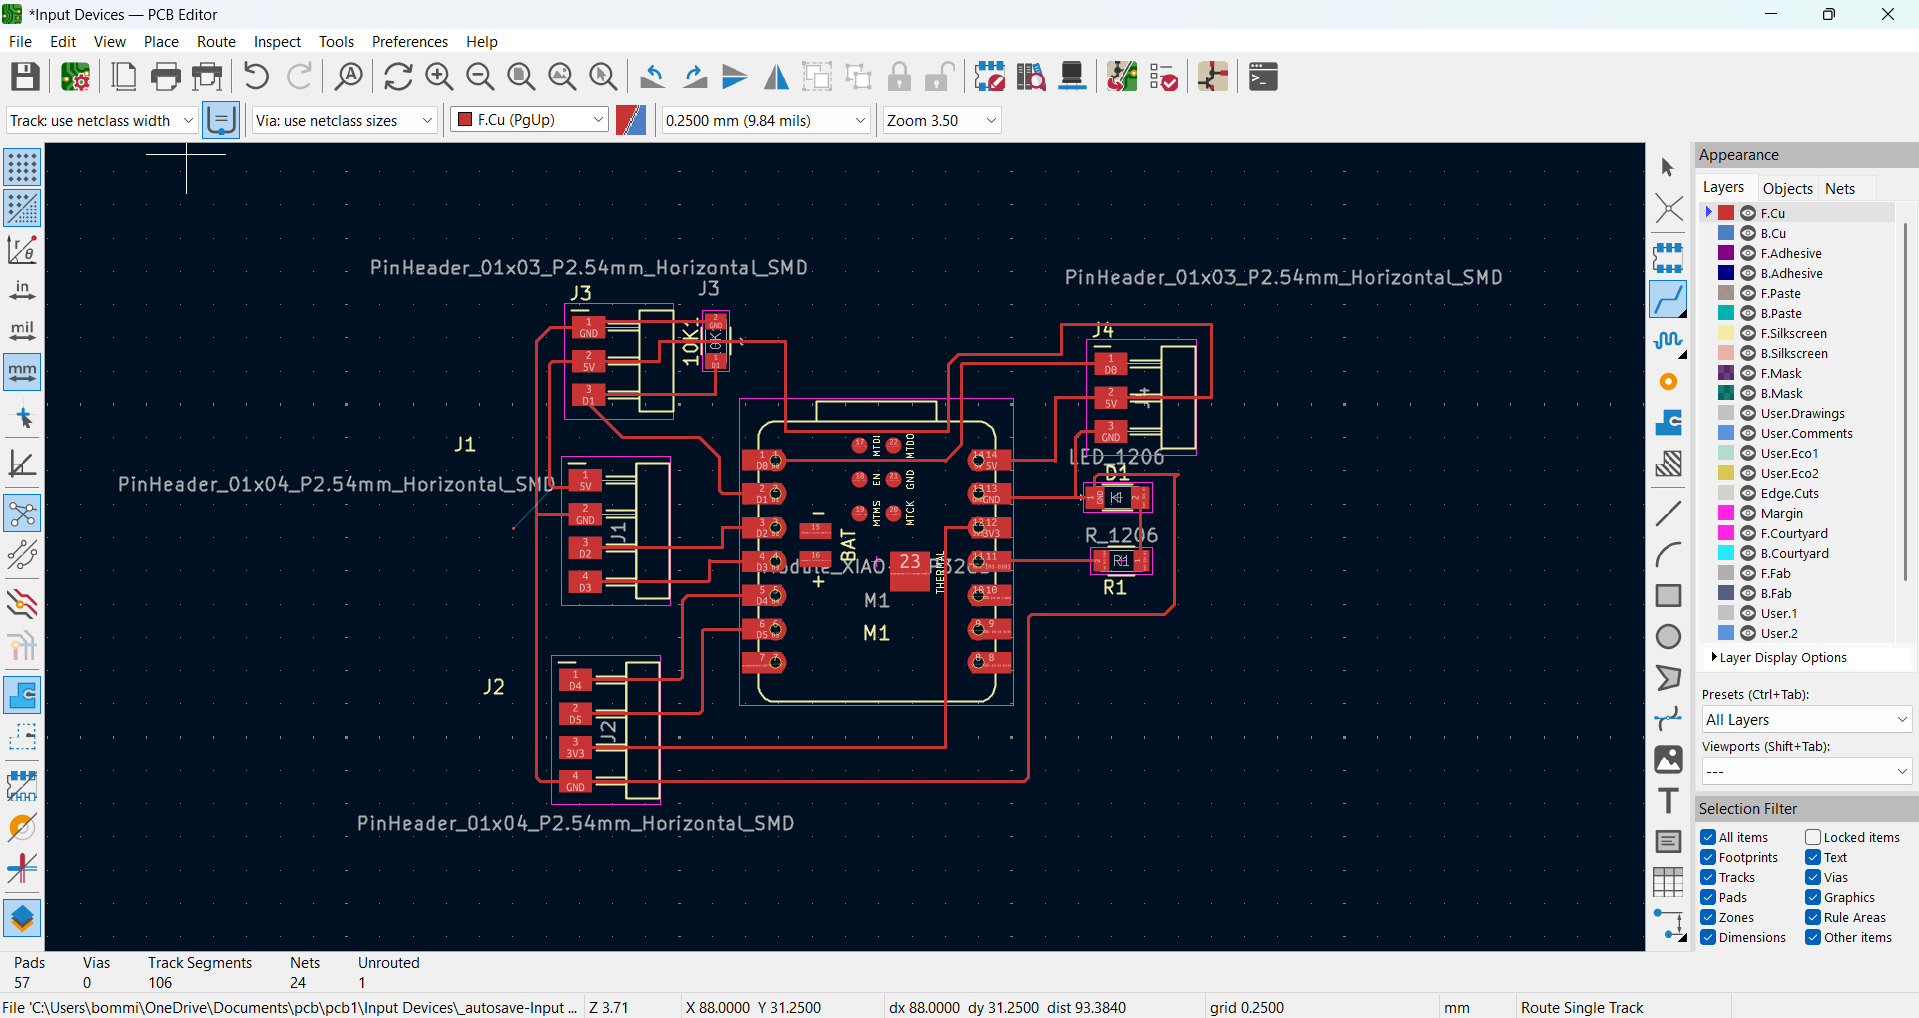
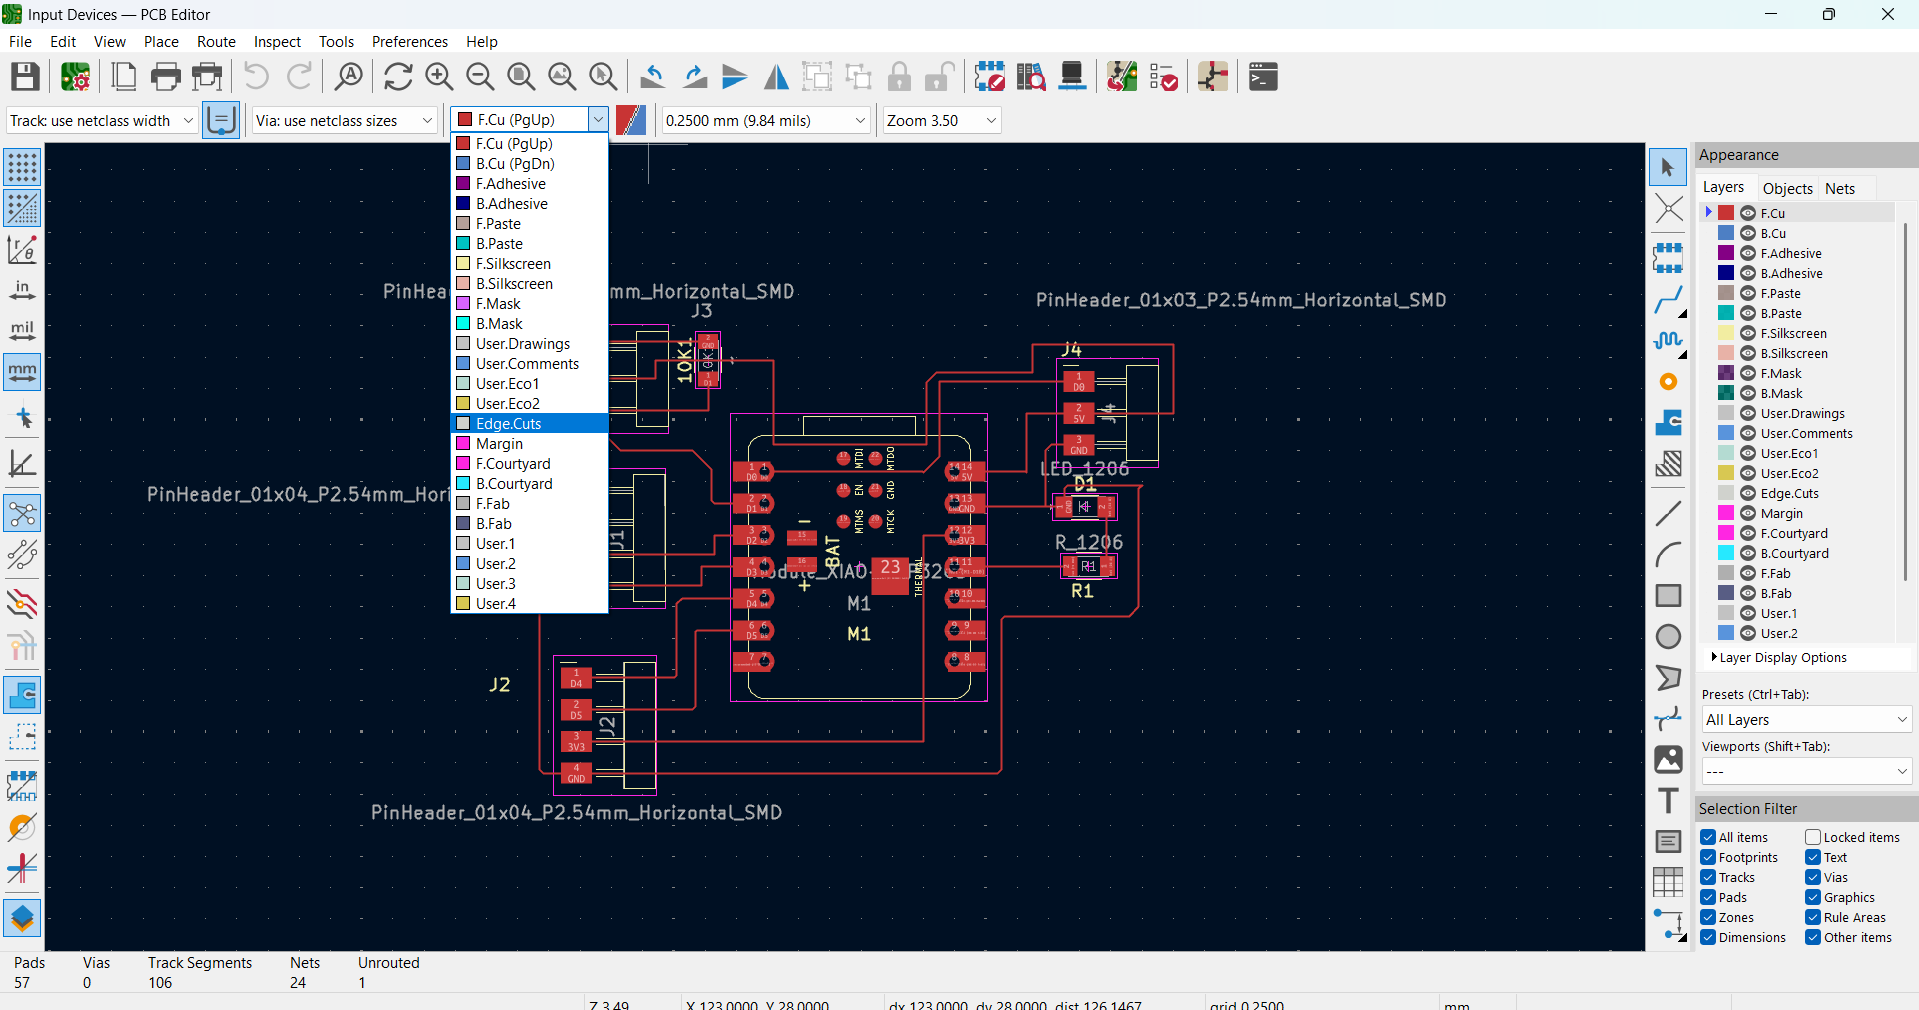
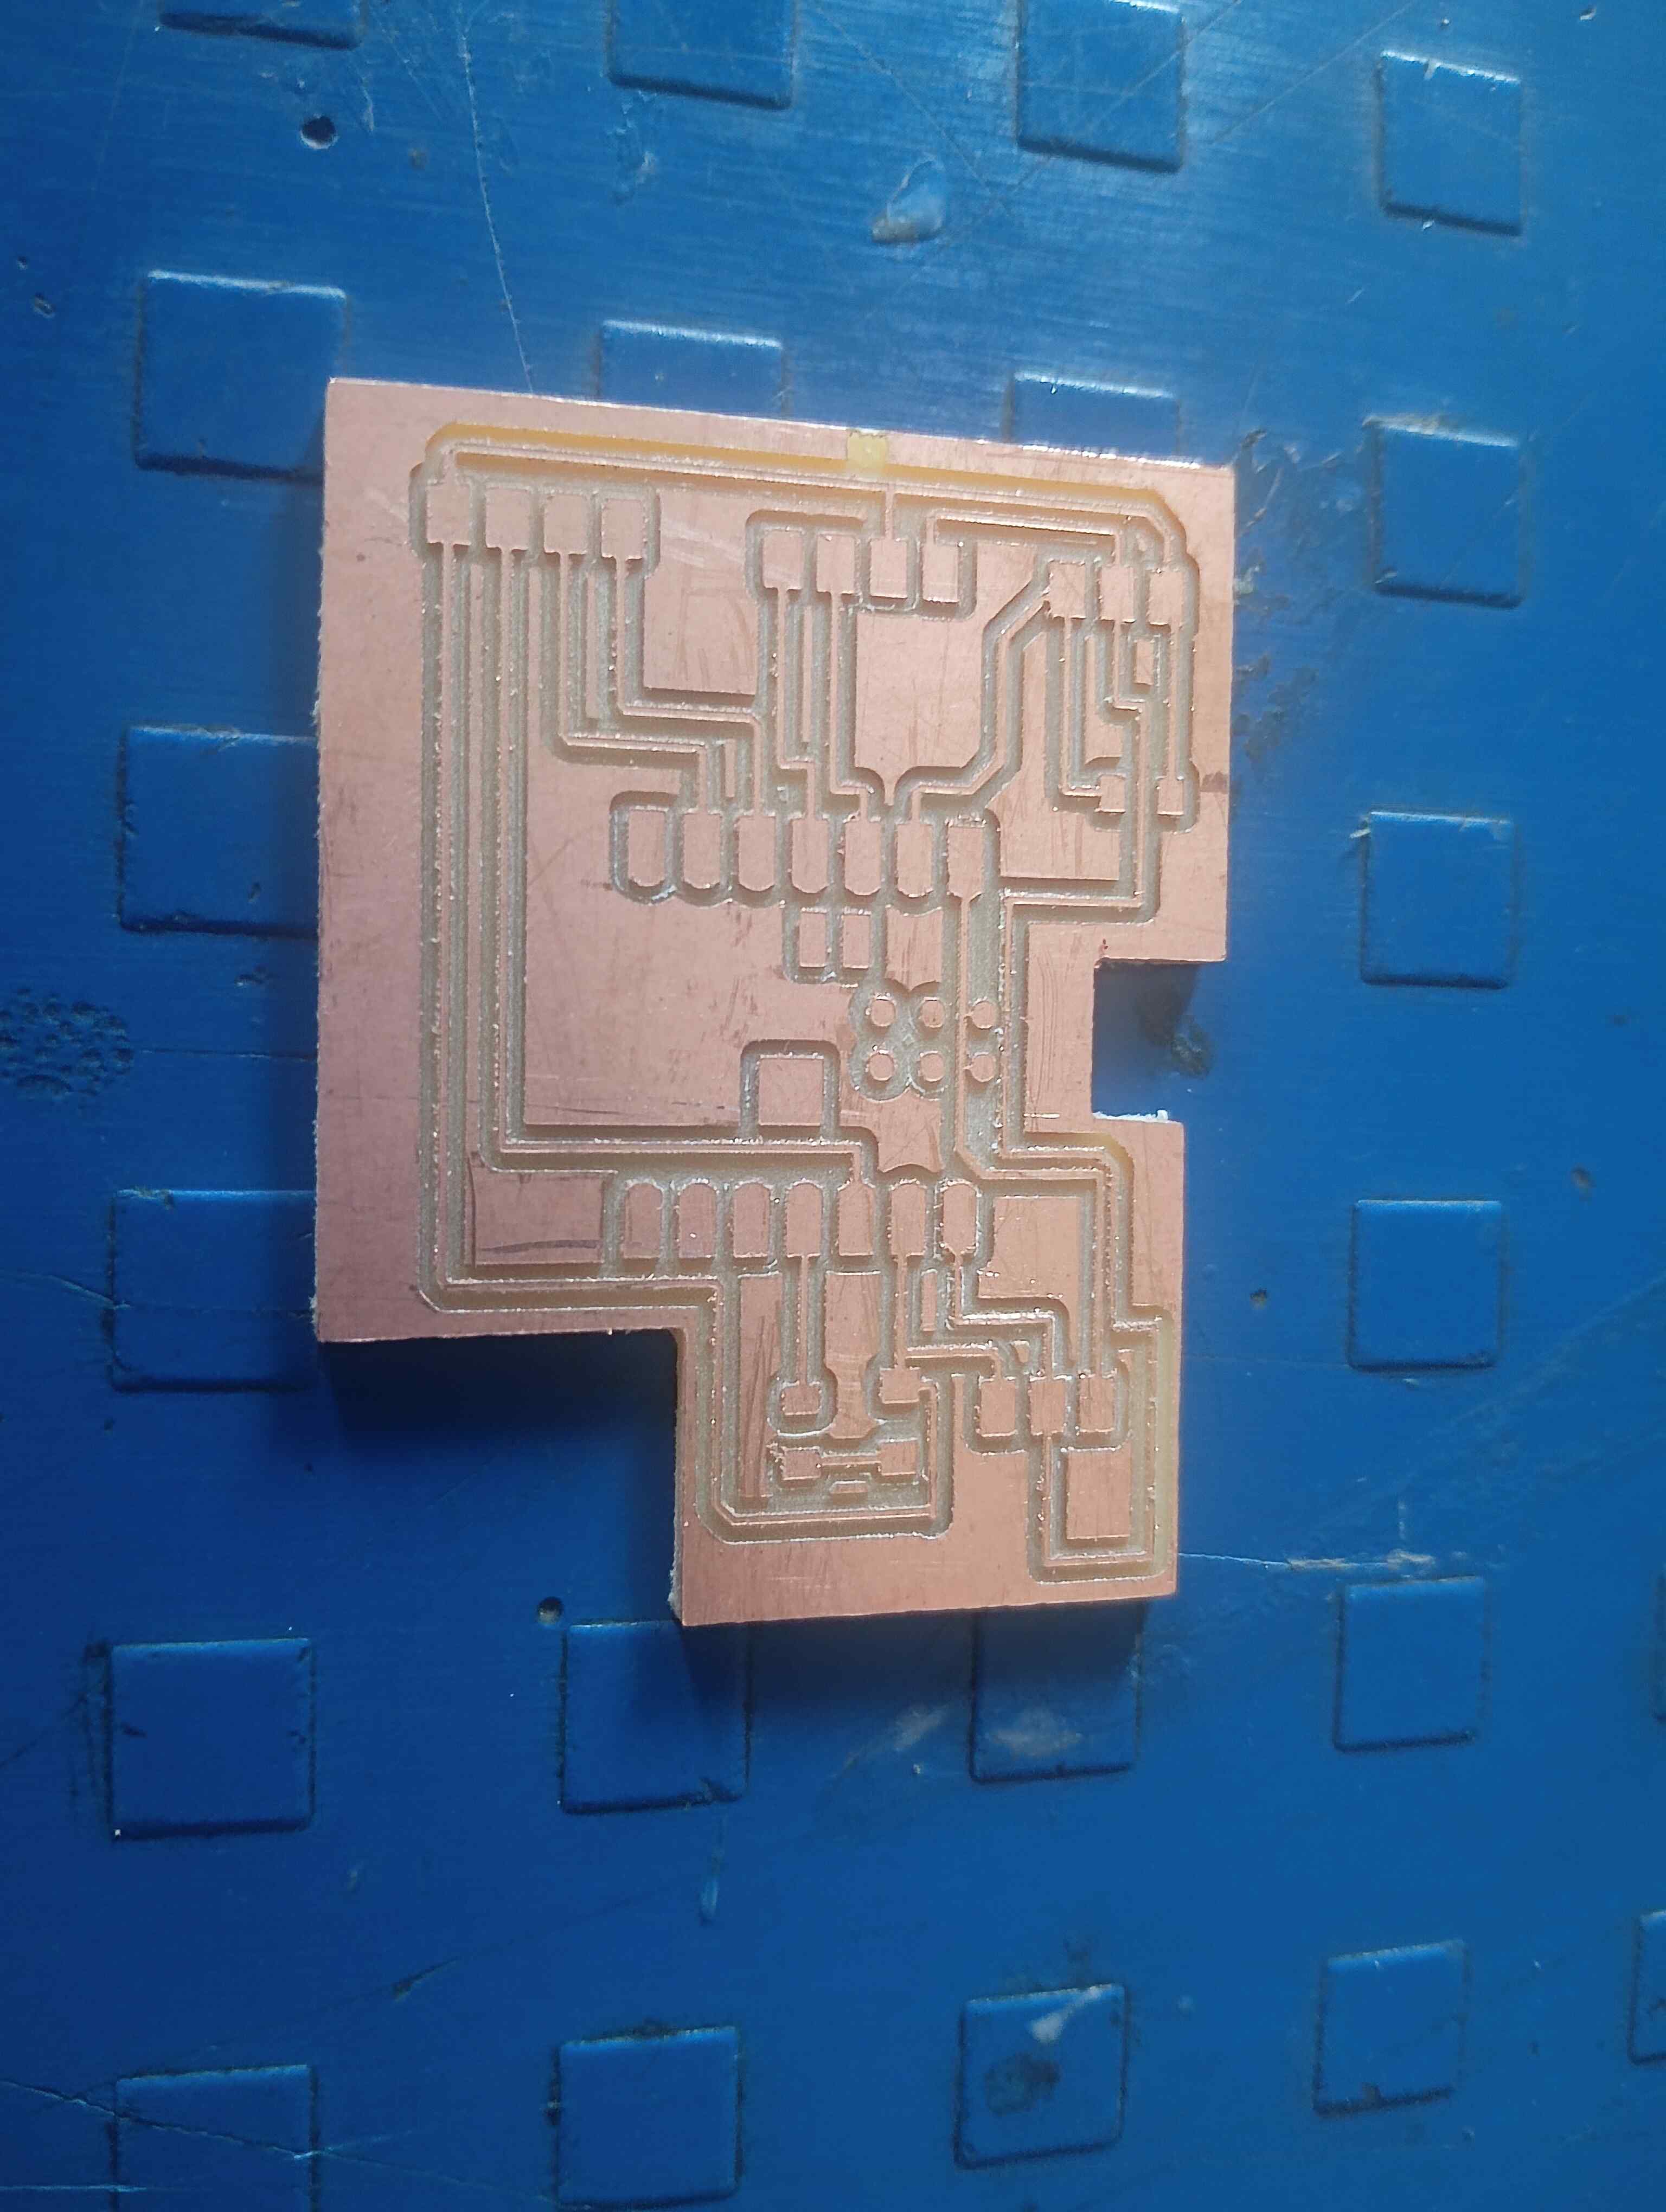
I carefully arranged the components and routed the connections to create an efficient layout. After that, I performed edge cutting to finalize the board shape and saved my design in the appropriate file location. Once the design was completed, I thoroughly reviewed it to identify and correct any potential errors before moving forward with fabrication. This setup will enable me to effectively test and analyze various input devices.
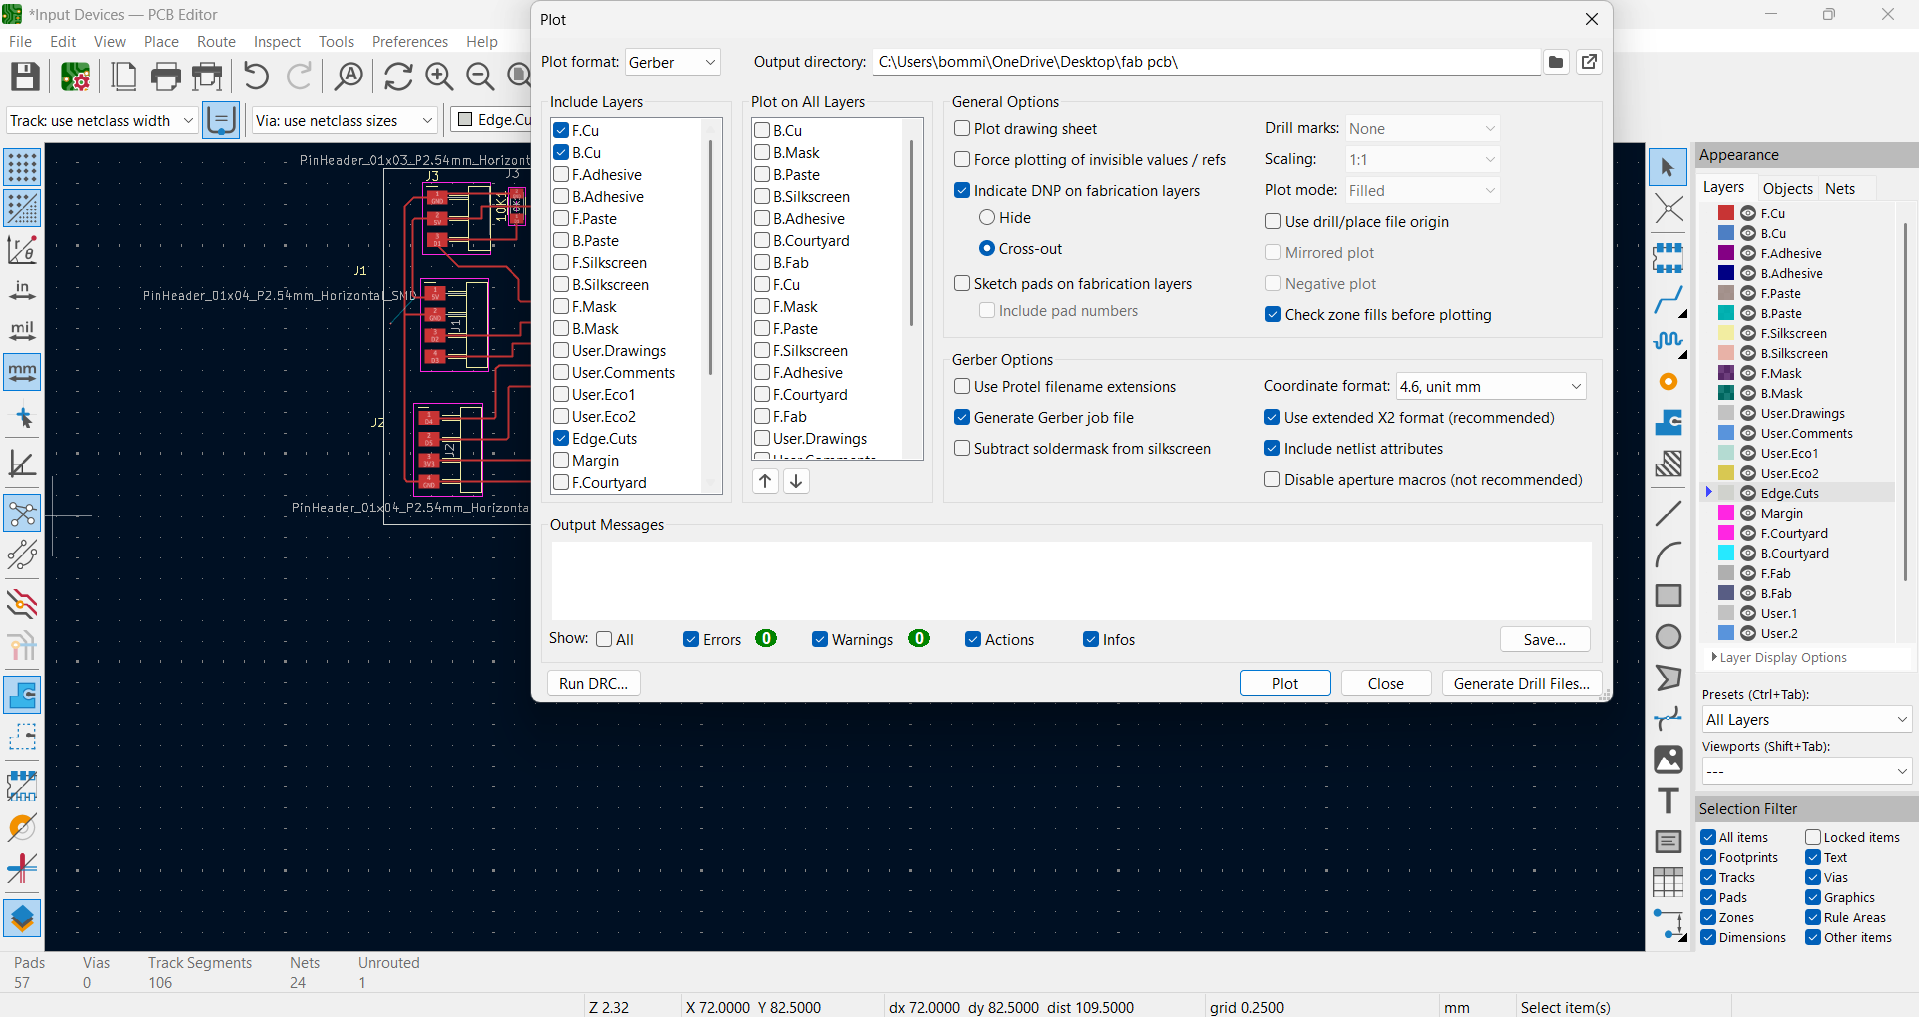
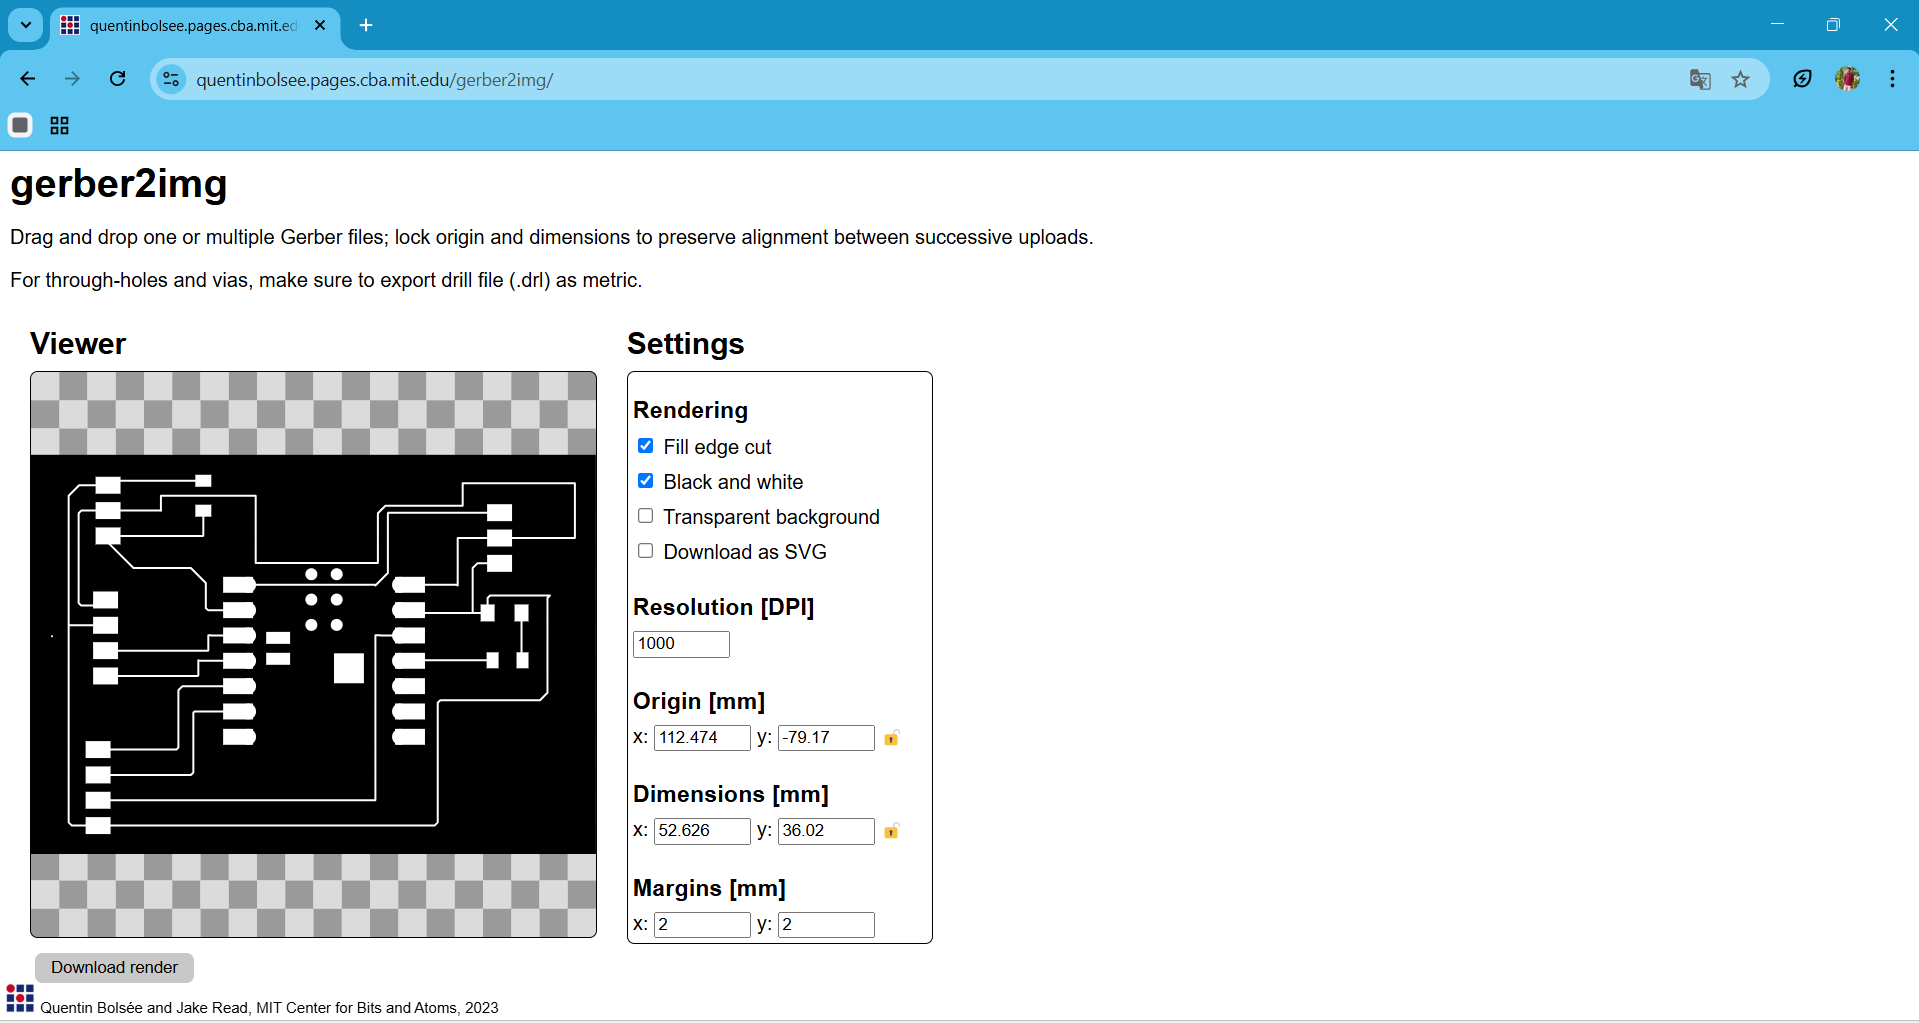
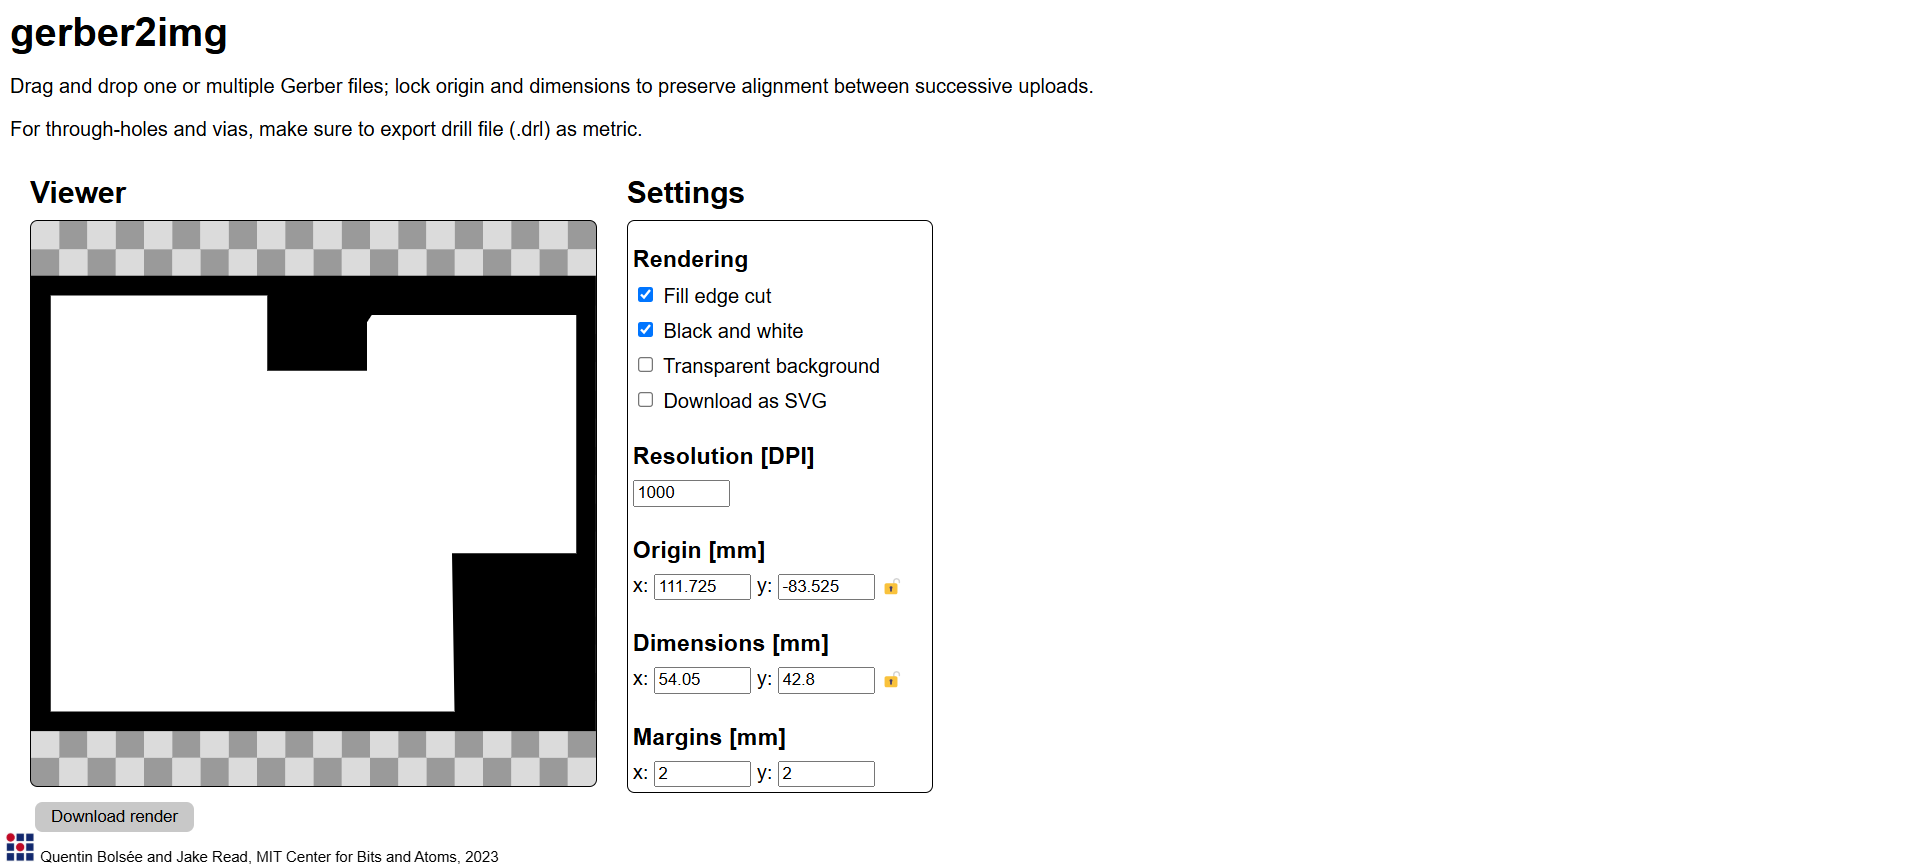
Before cutting my board, I converted my Gerber file to SVG to define the edge cut (outer cut) and inside cut. I used the Gerber2img website for this conversion, ensuring that the design was accurately prepared for fabrication.
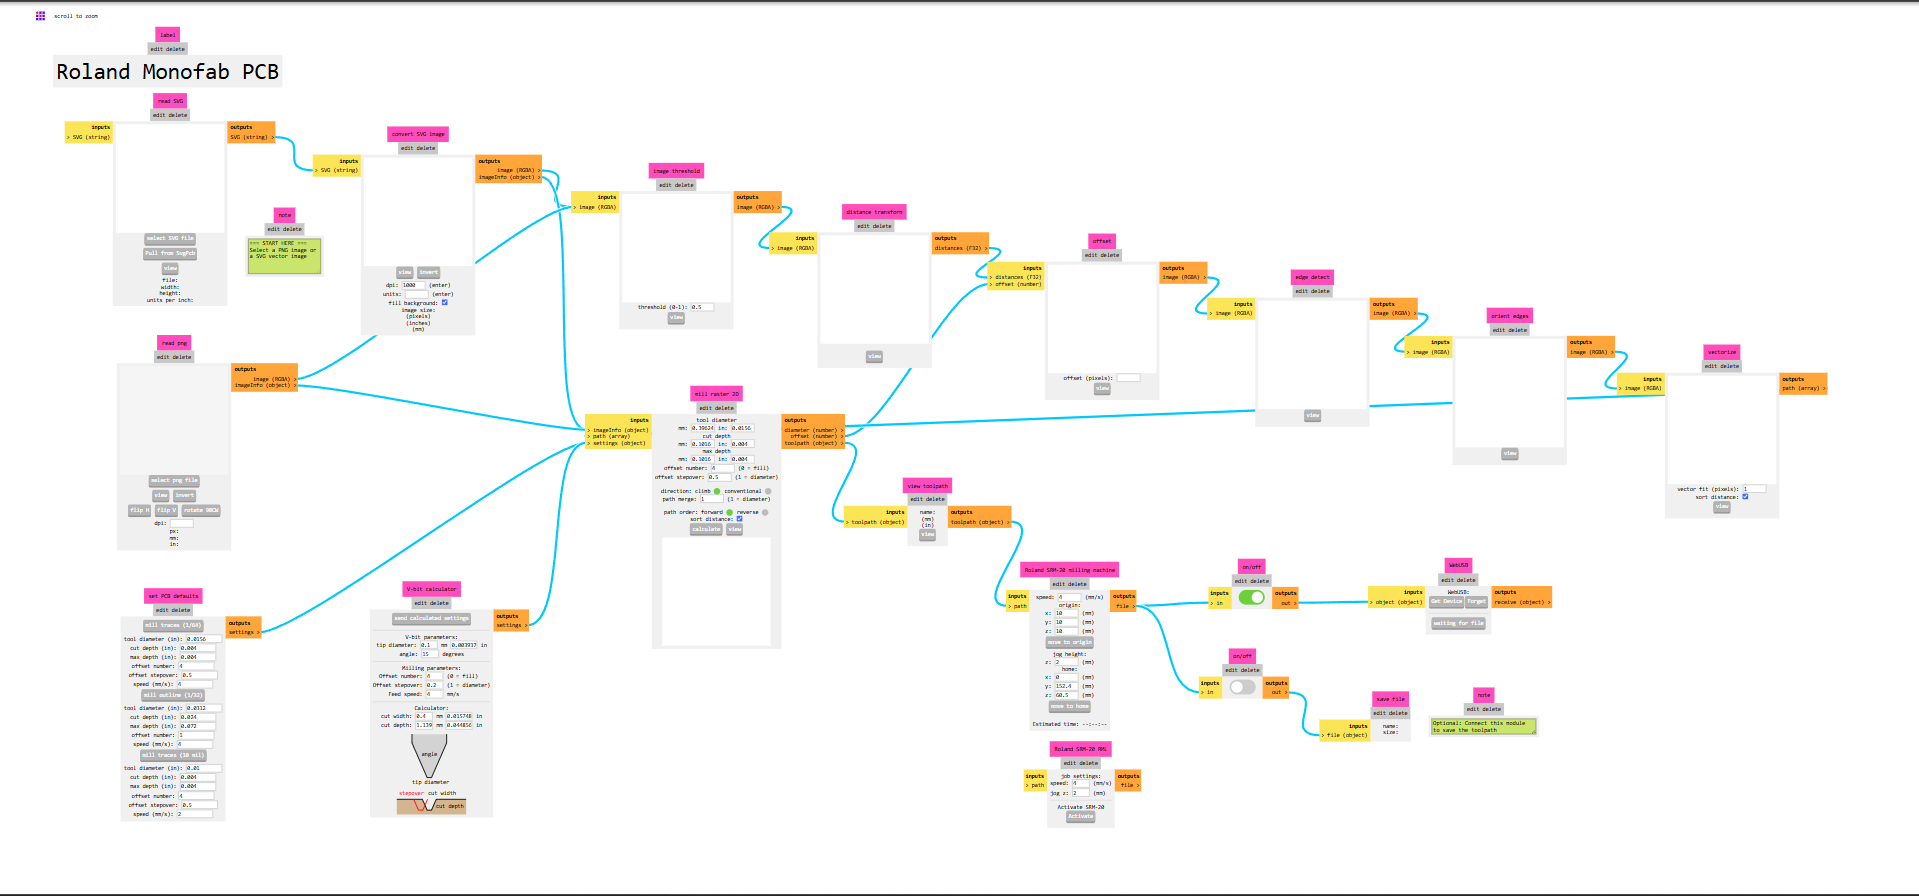
After preparing the SVG file, I needed to generate the G-code for cutting my board. To do this, I used the MODS website, where I converted the SVG file into G-code. This step ensured that the milling machine could accurately follow the designated cutting paths.
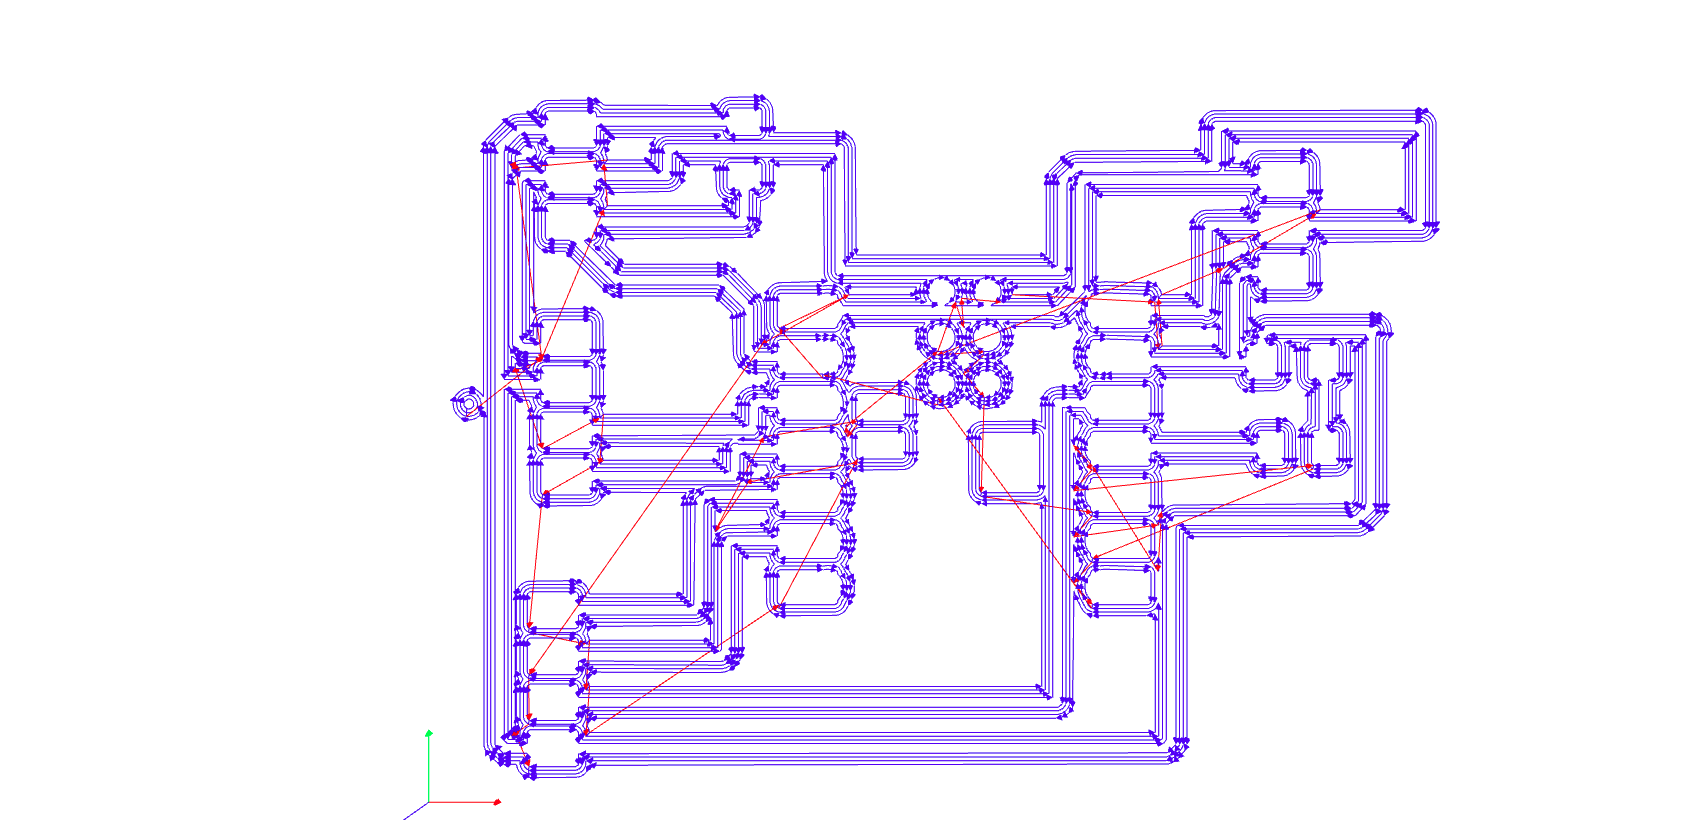
I carefully checked the generated G-code to confirm that the edge cuts and inside cuts were correctly defined. Once verified, I saved the G-code file and prepared it for use with the milling machine. This process ensured precise board fabrication, allowing for accurate assembly and testing of input devices.
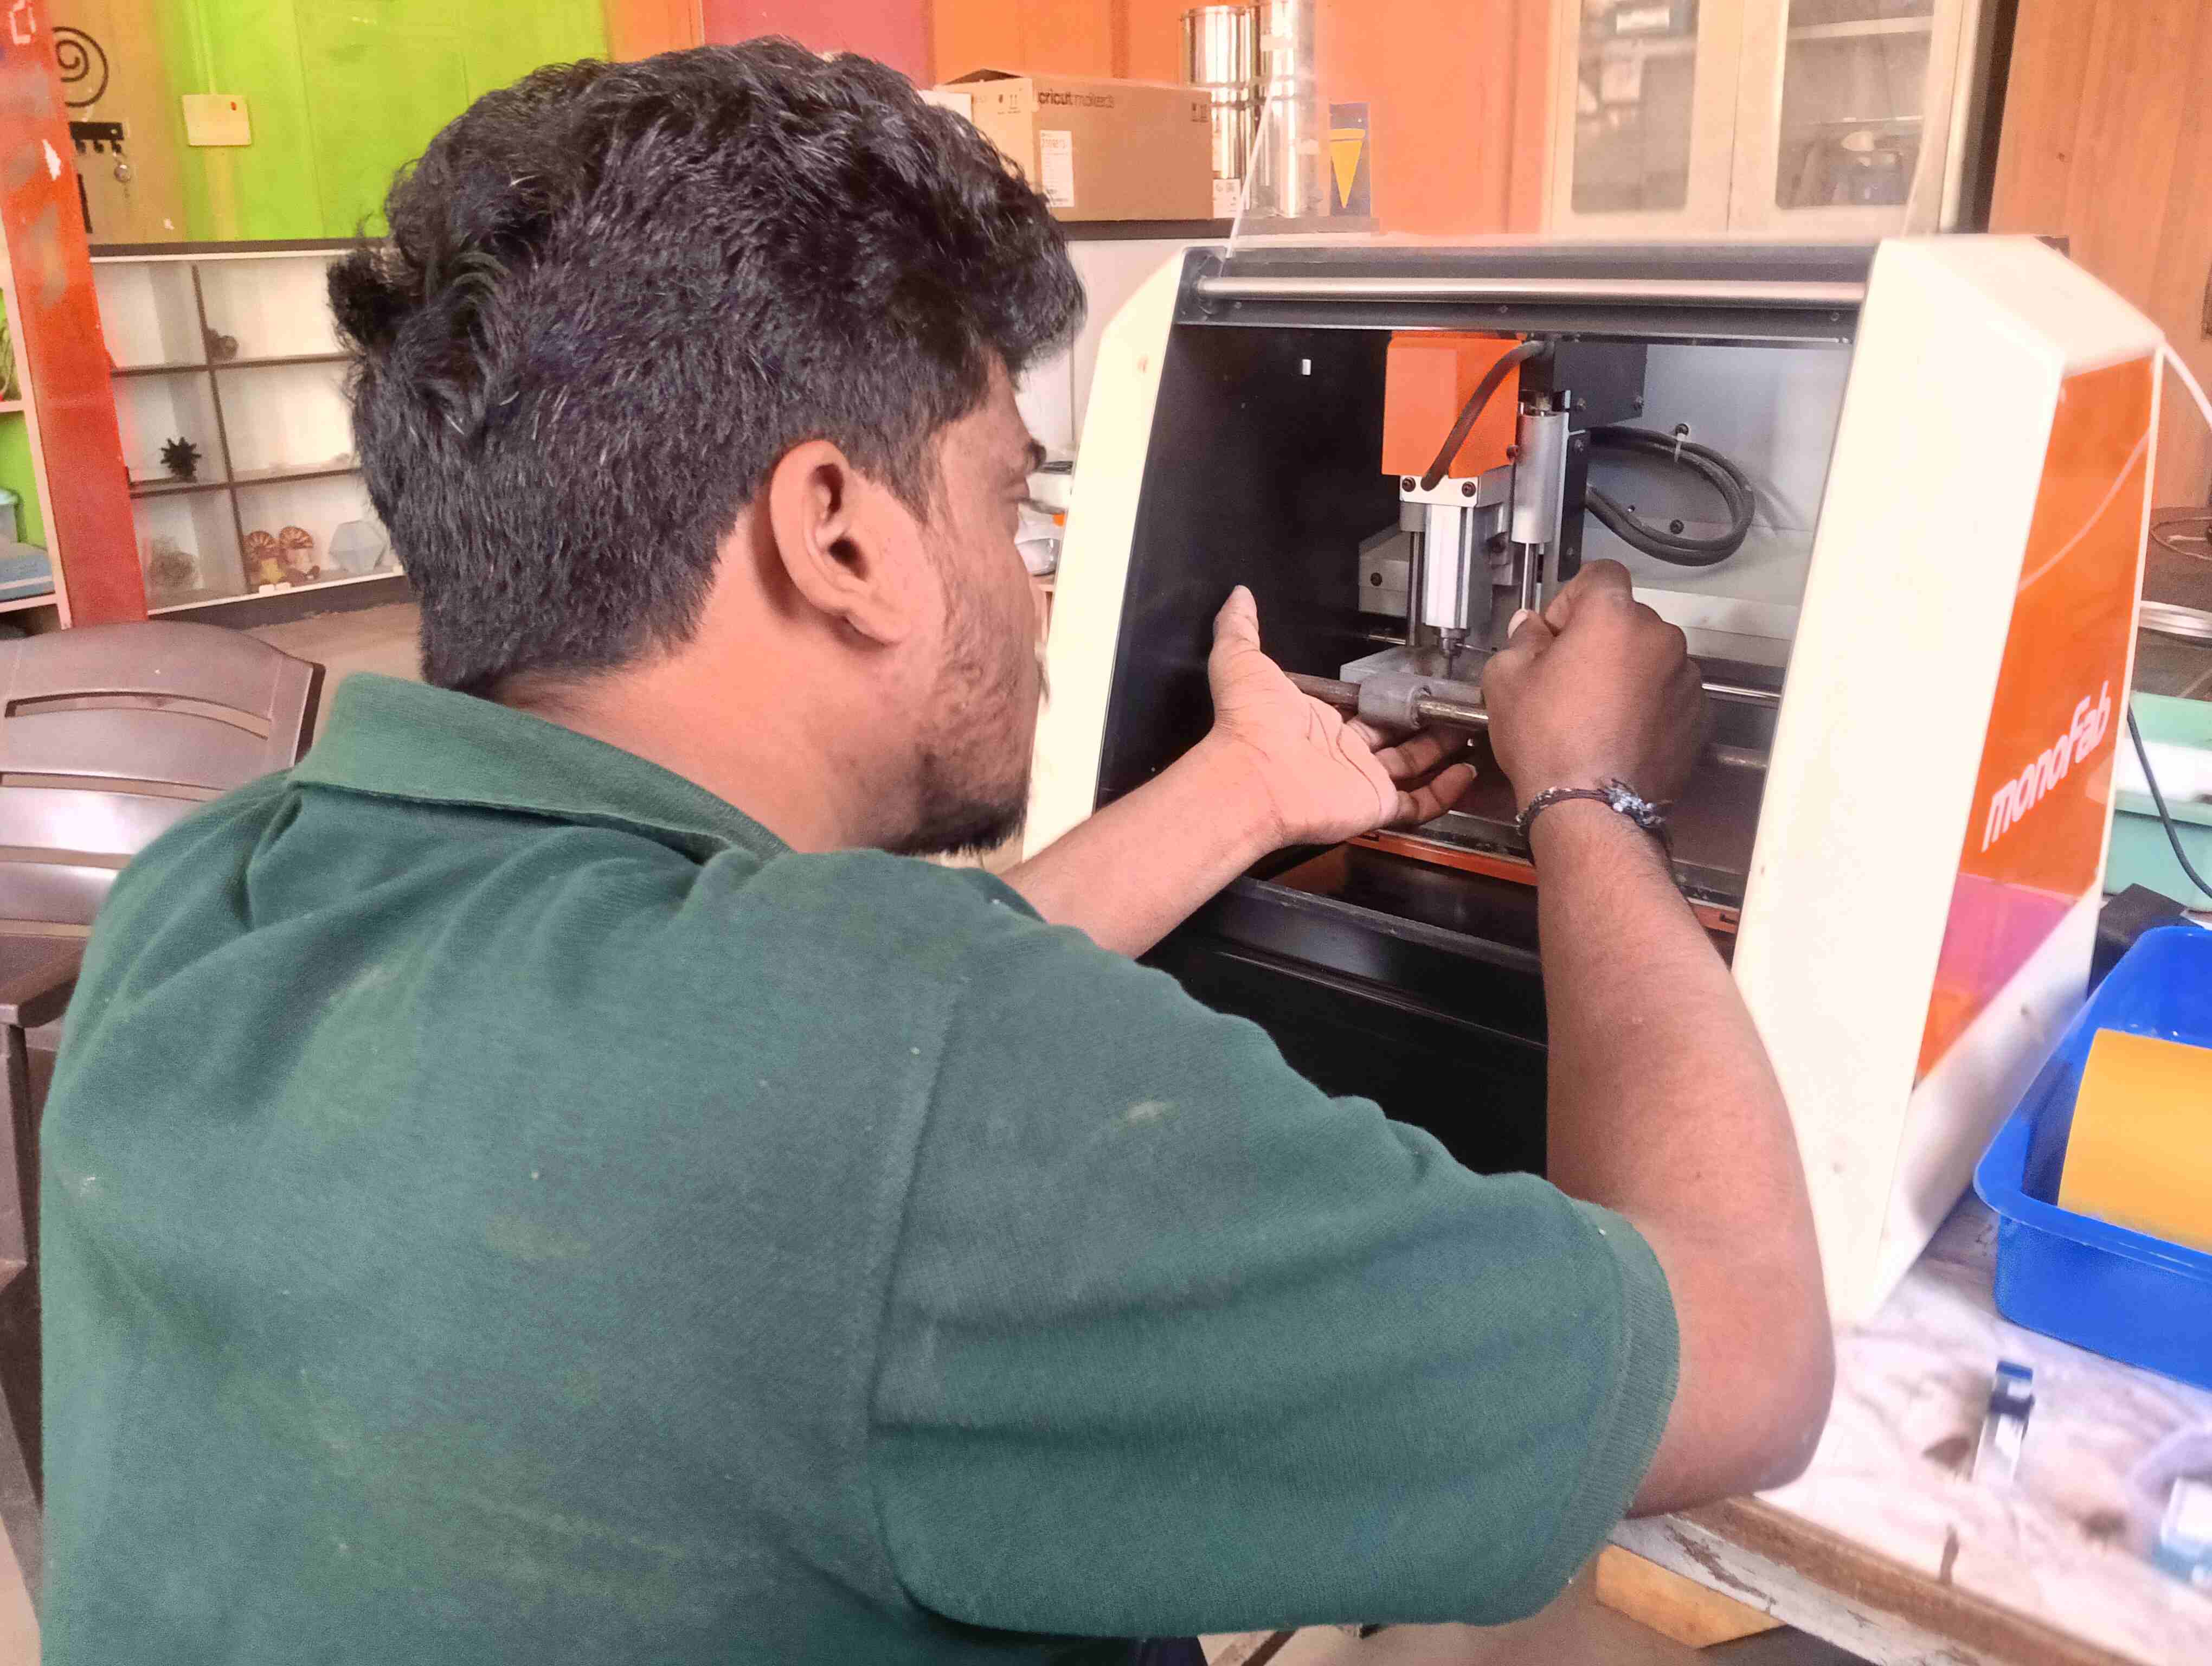
Now, I will check whether my PCB cutting is correct or not. After verifying the cuts, I will proceed with setting up my mono machine for the next steps. This ensures a smooth fabrication process before moving forward with assembly.
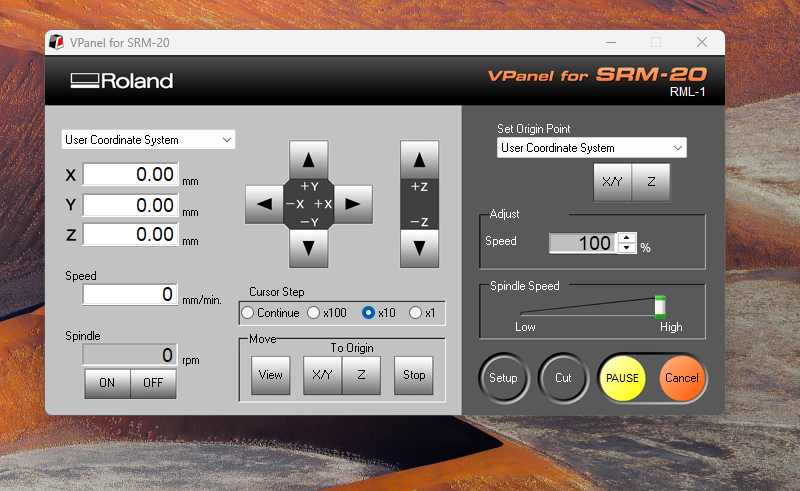
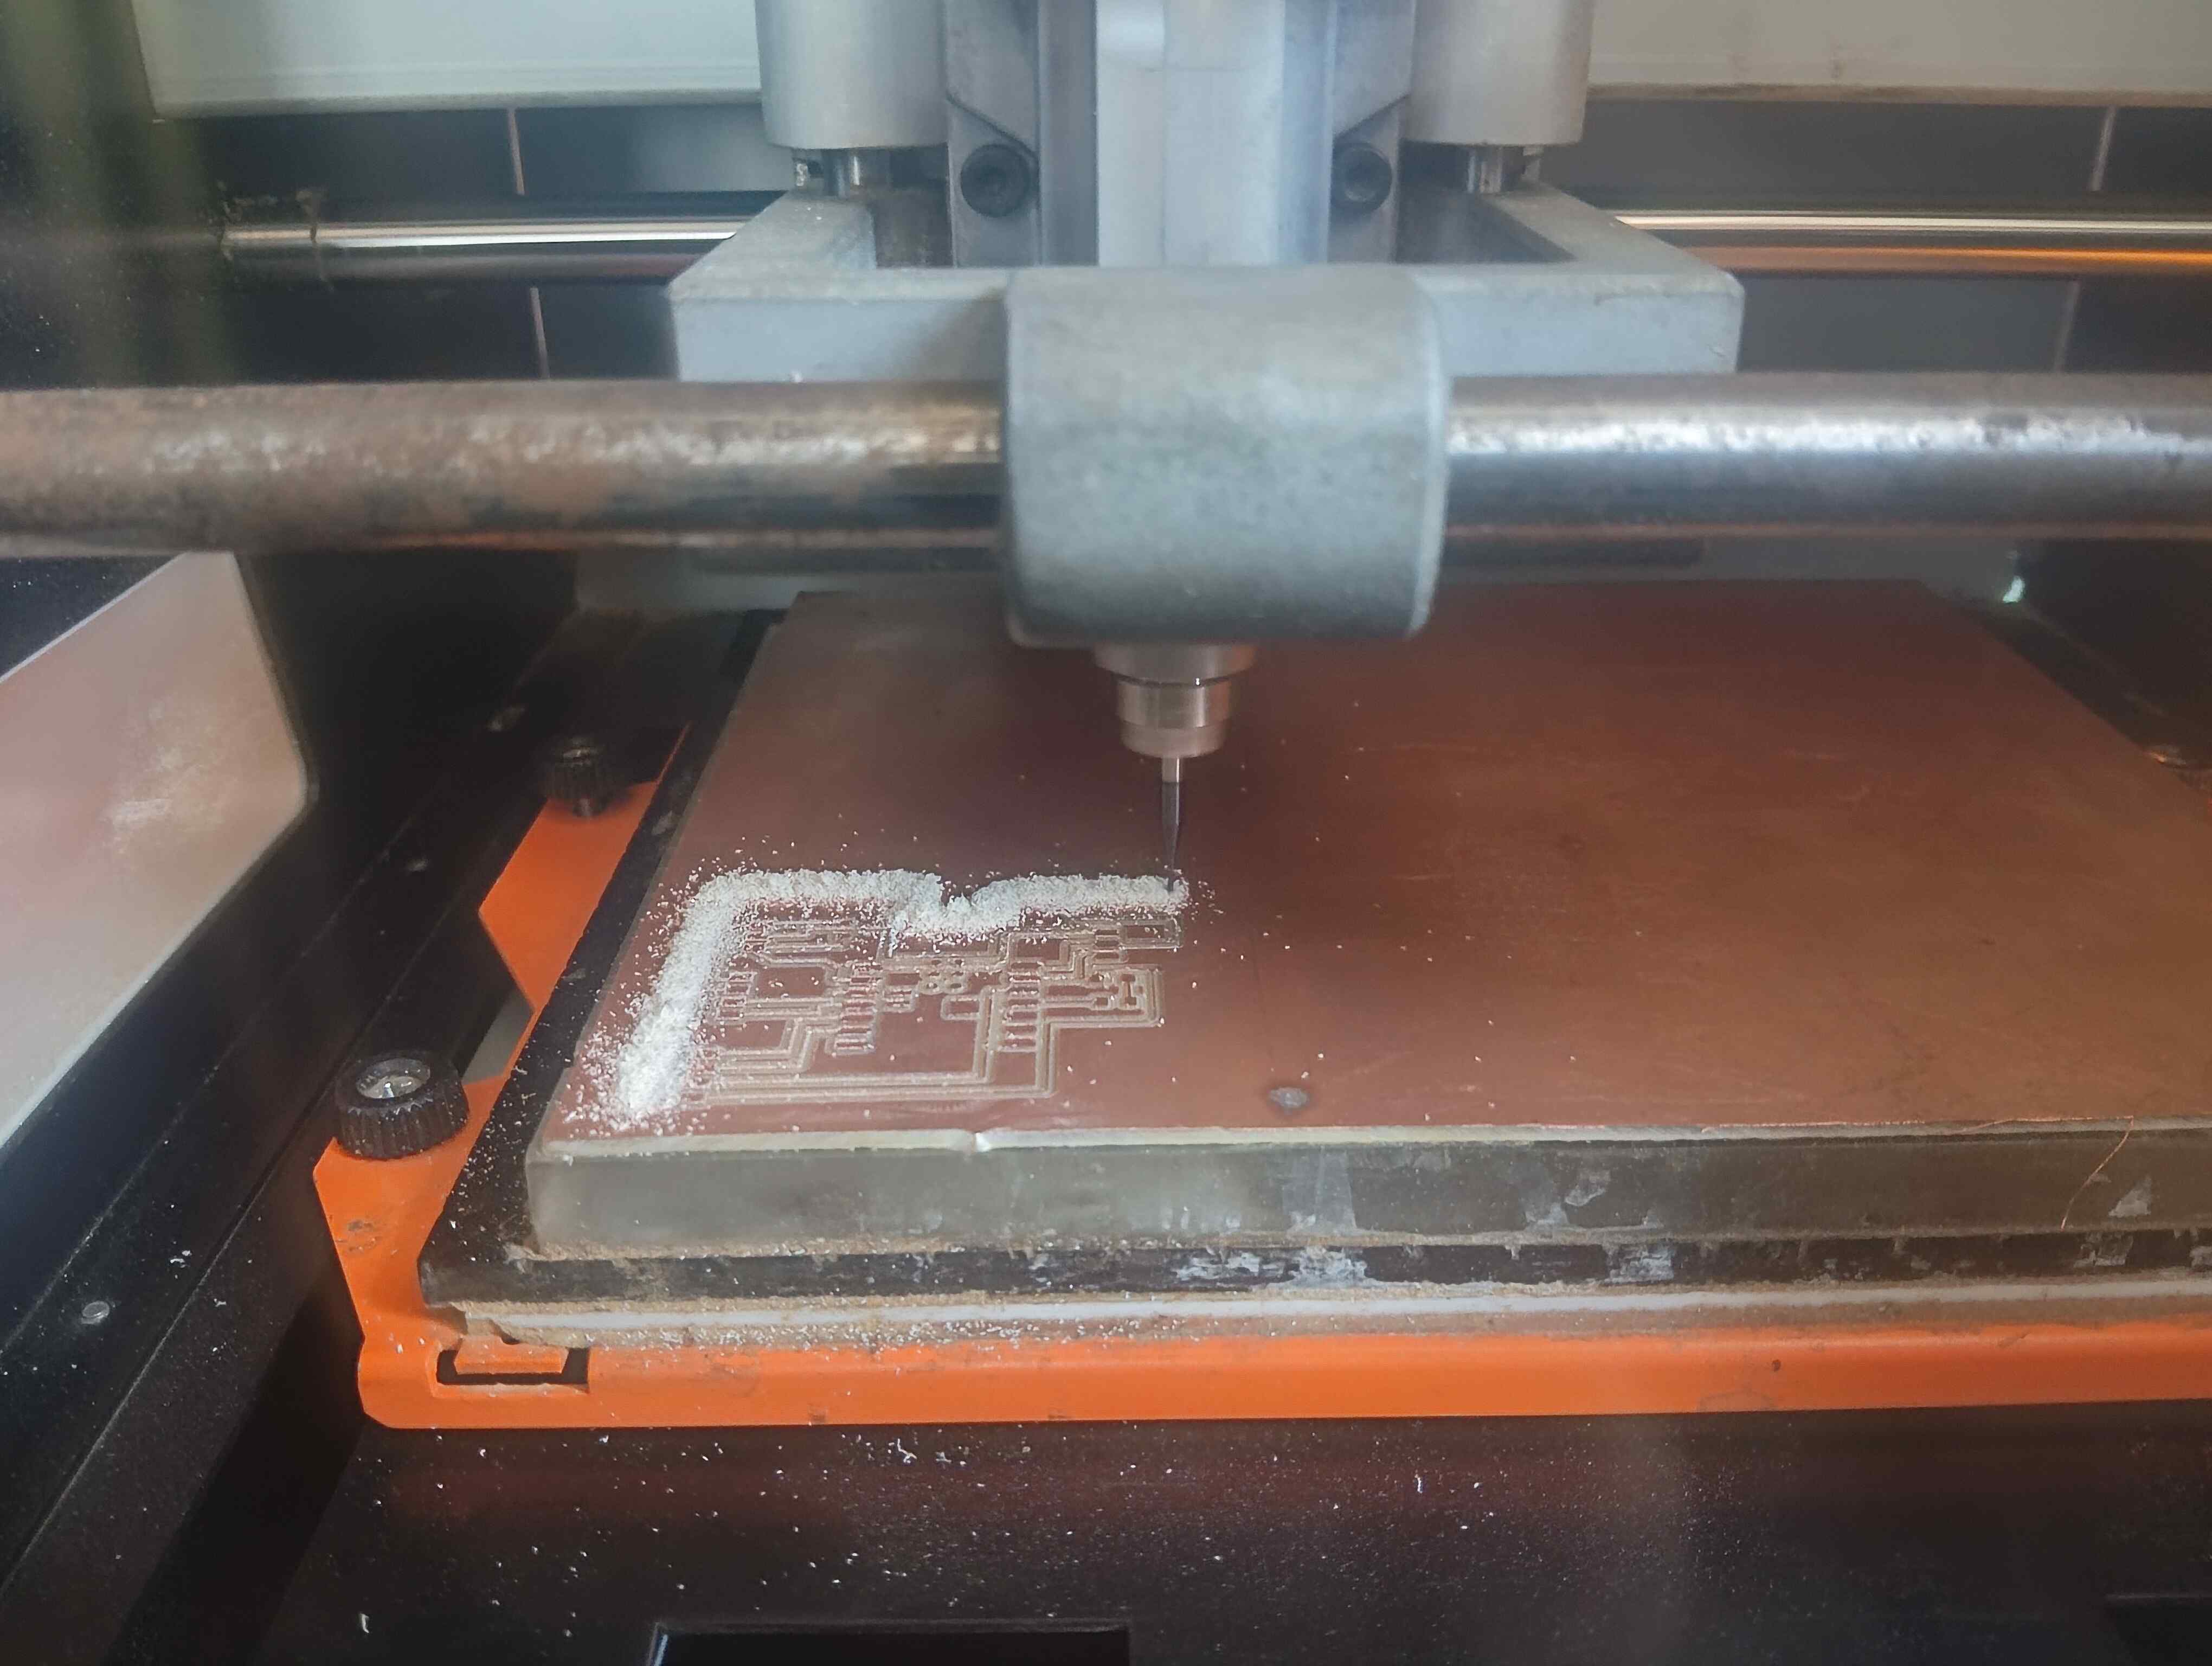
Before starting my work with the machine, I cleaned everything to ensure a smooth process. Then, I fixed the tool 64 size bit securely and set the machine to its home position to align it properly for cutting my design in the exact desired location.
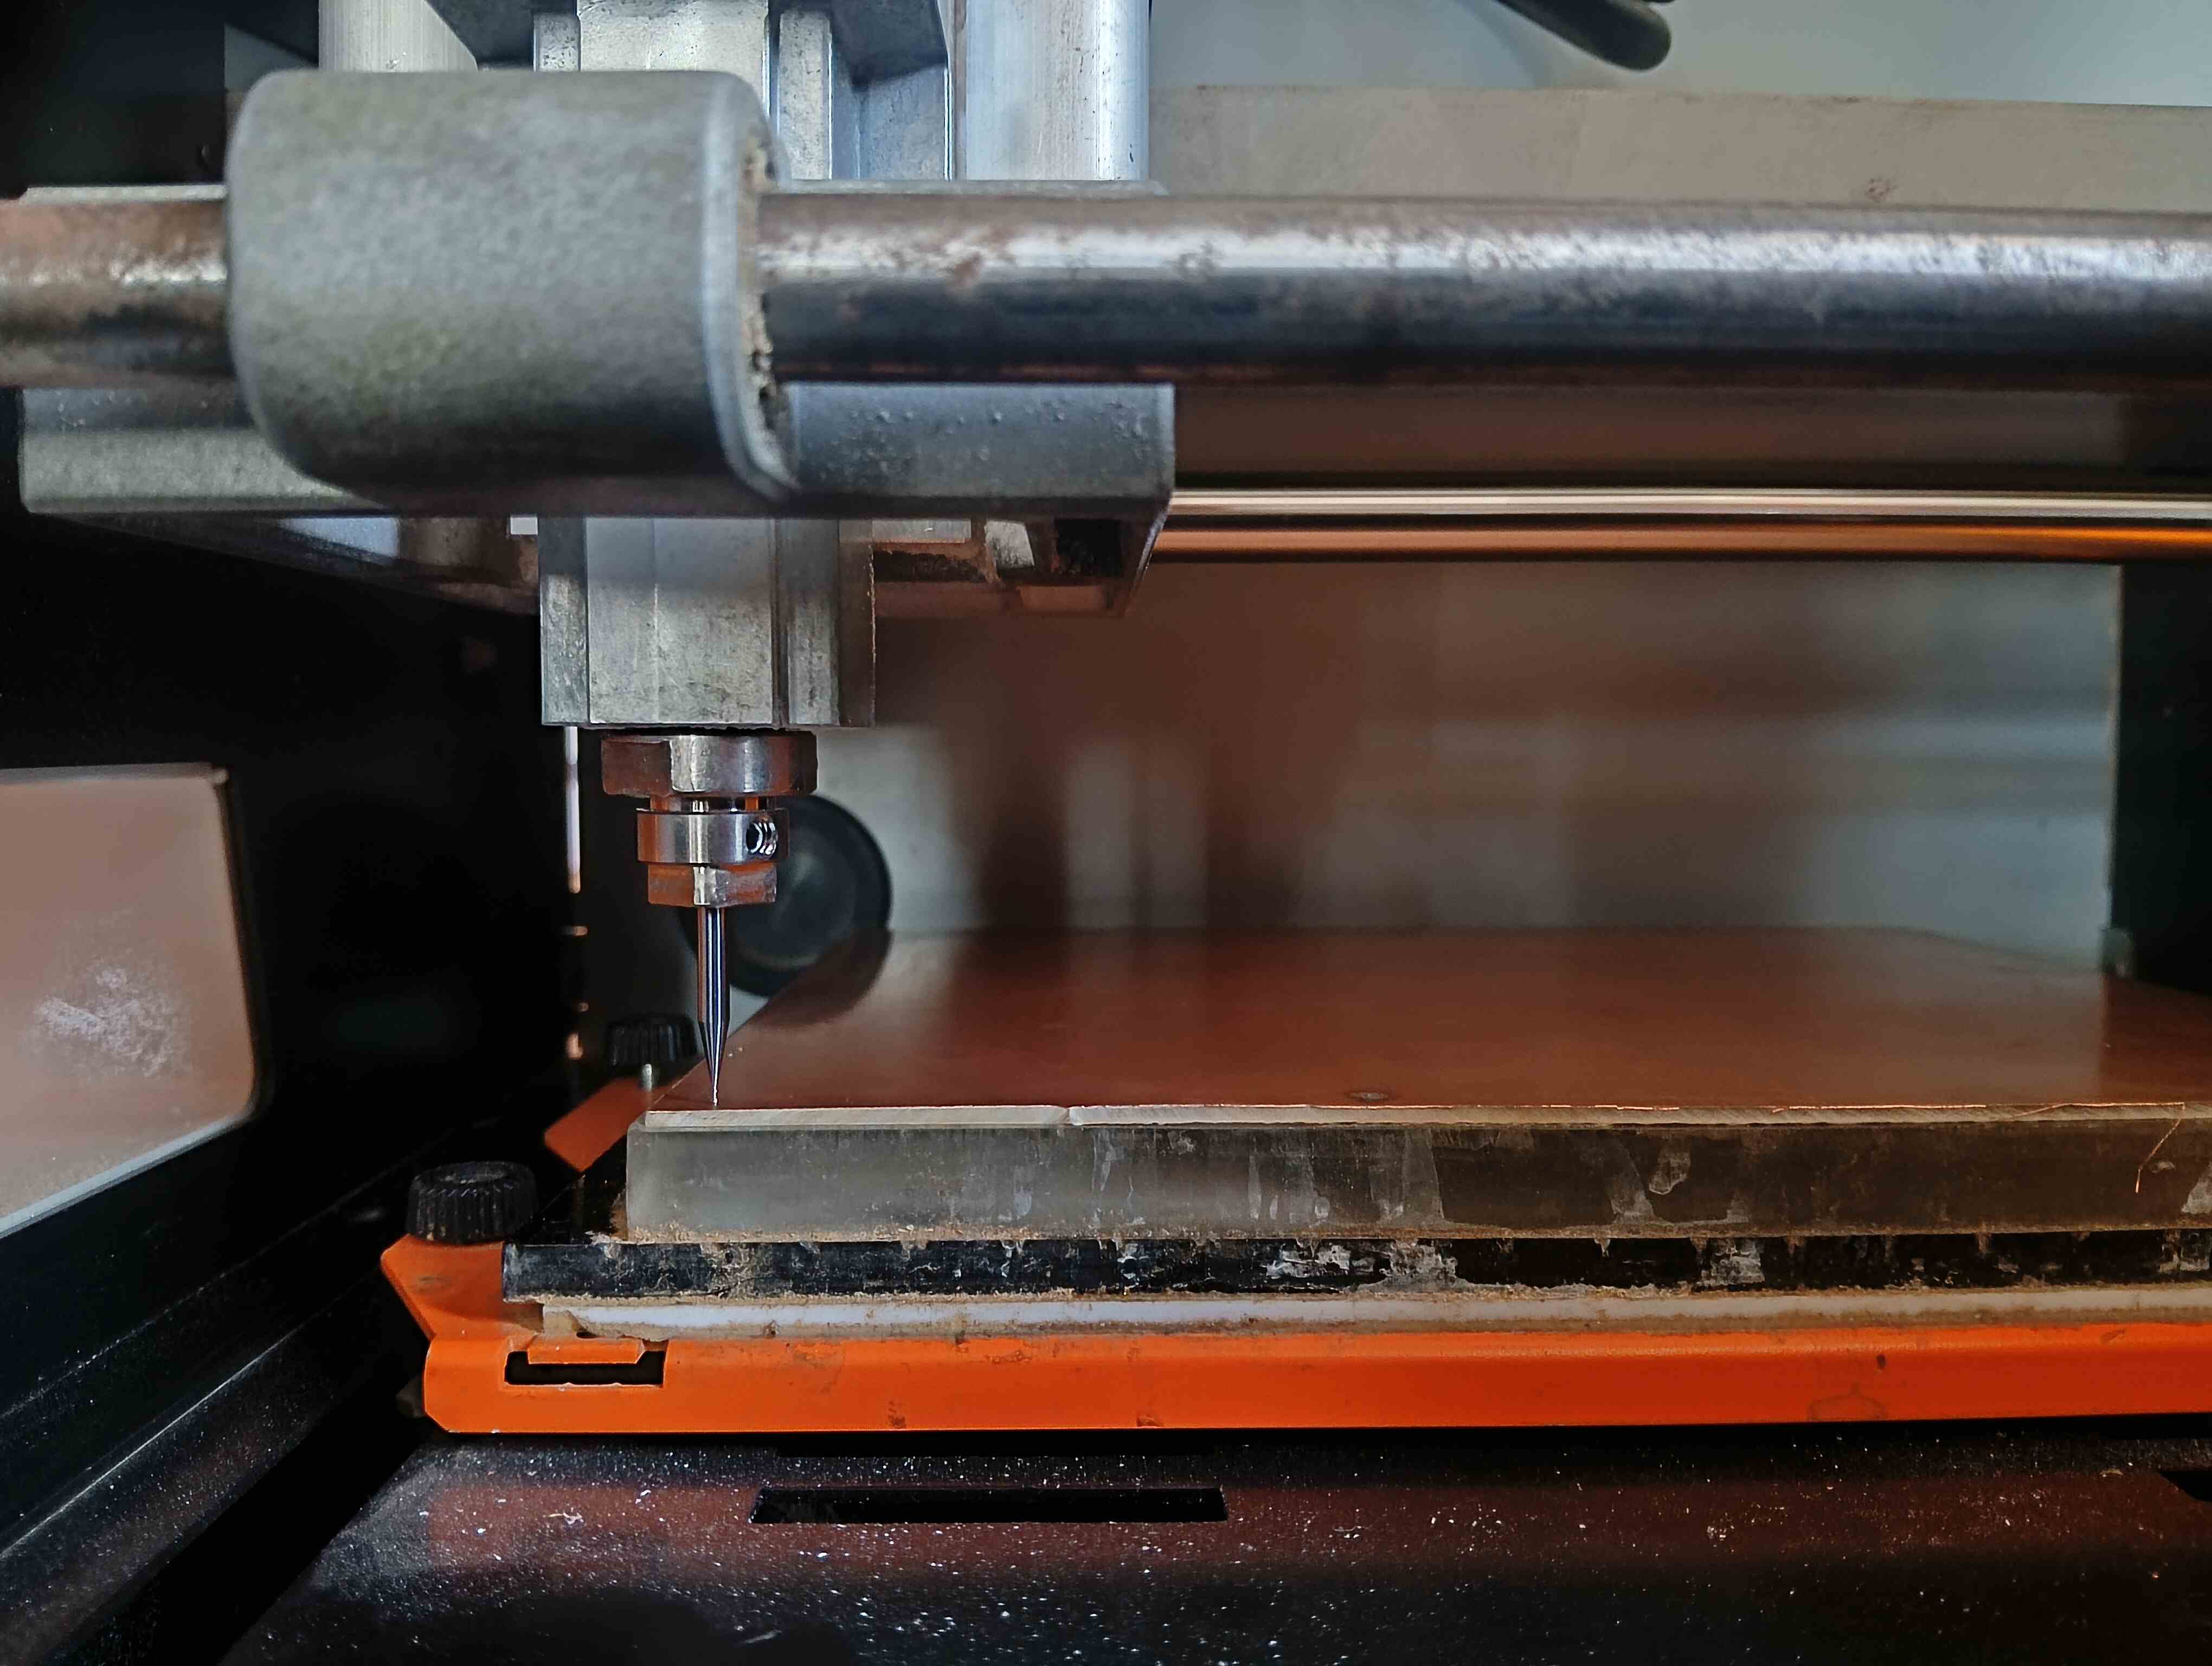
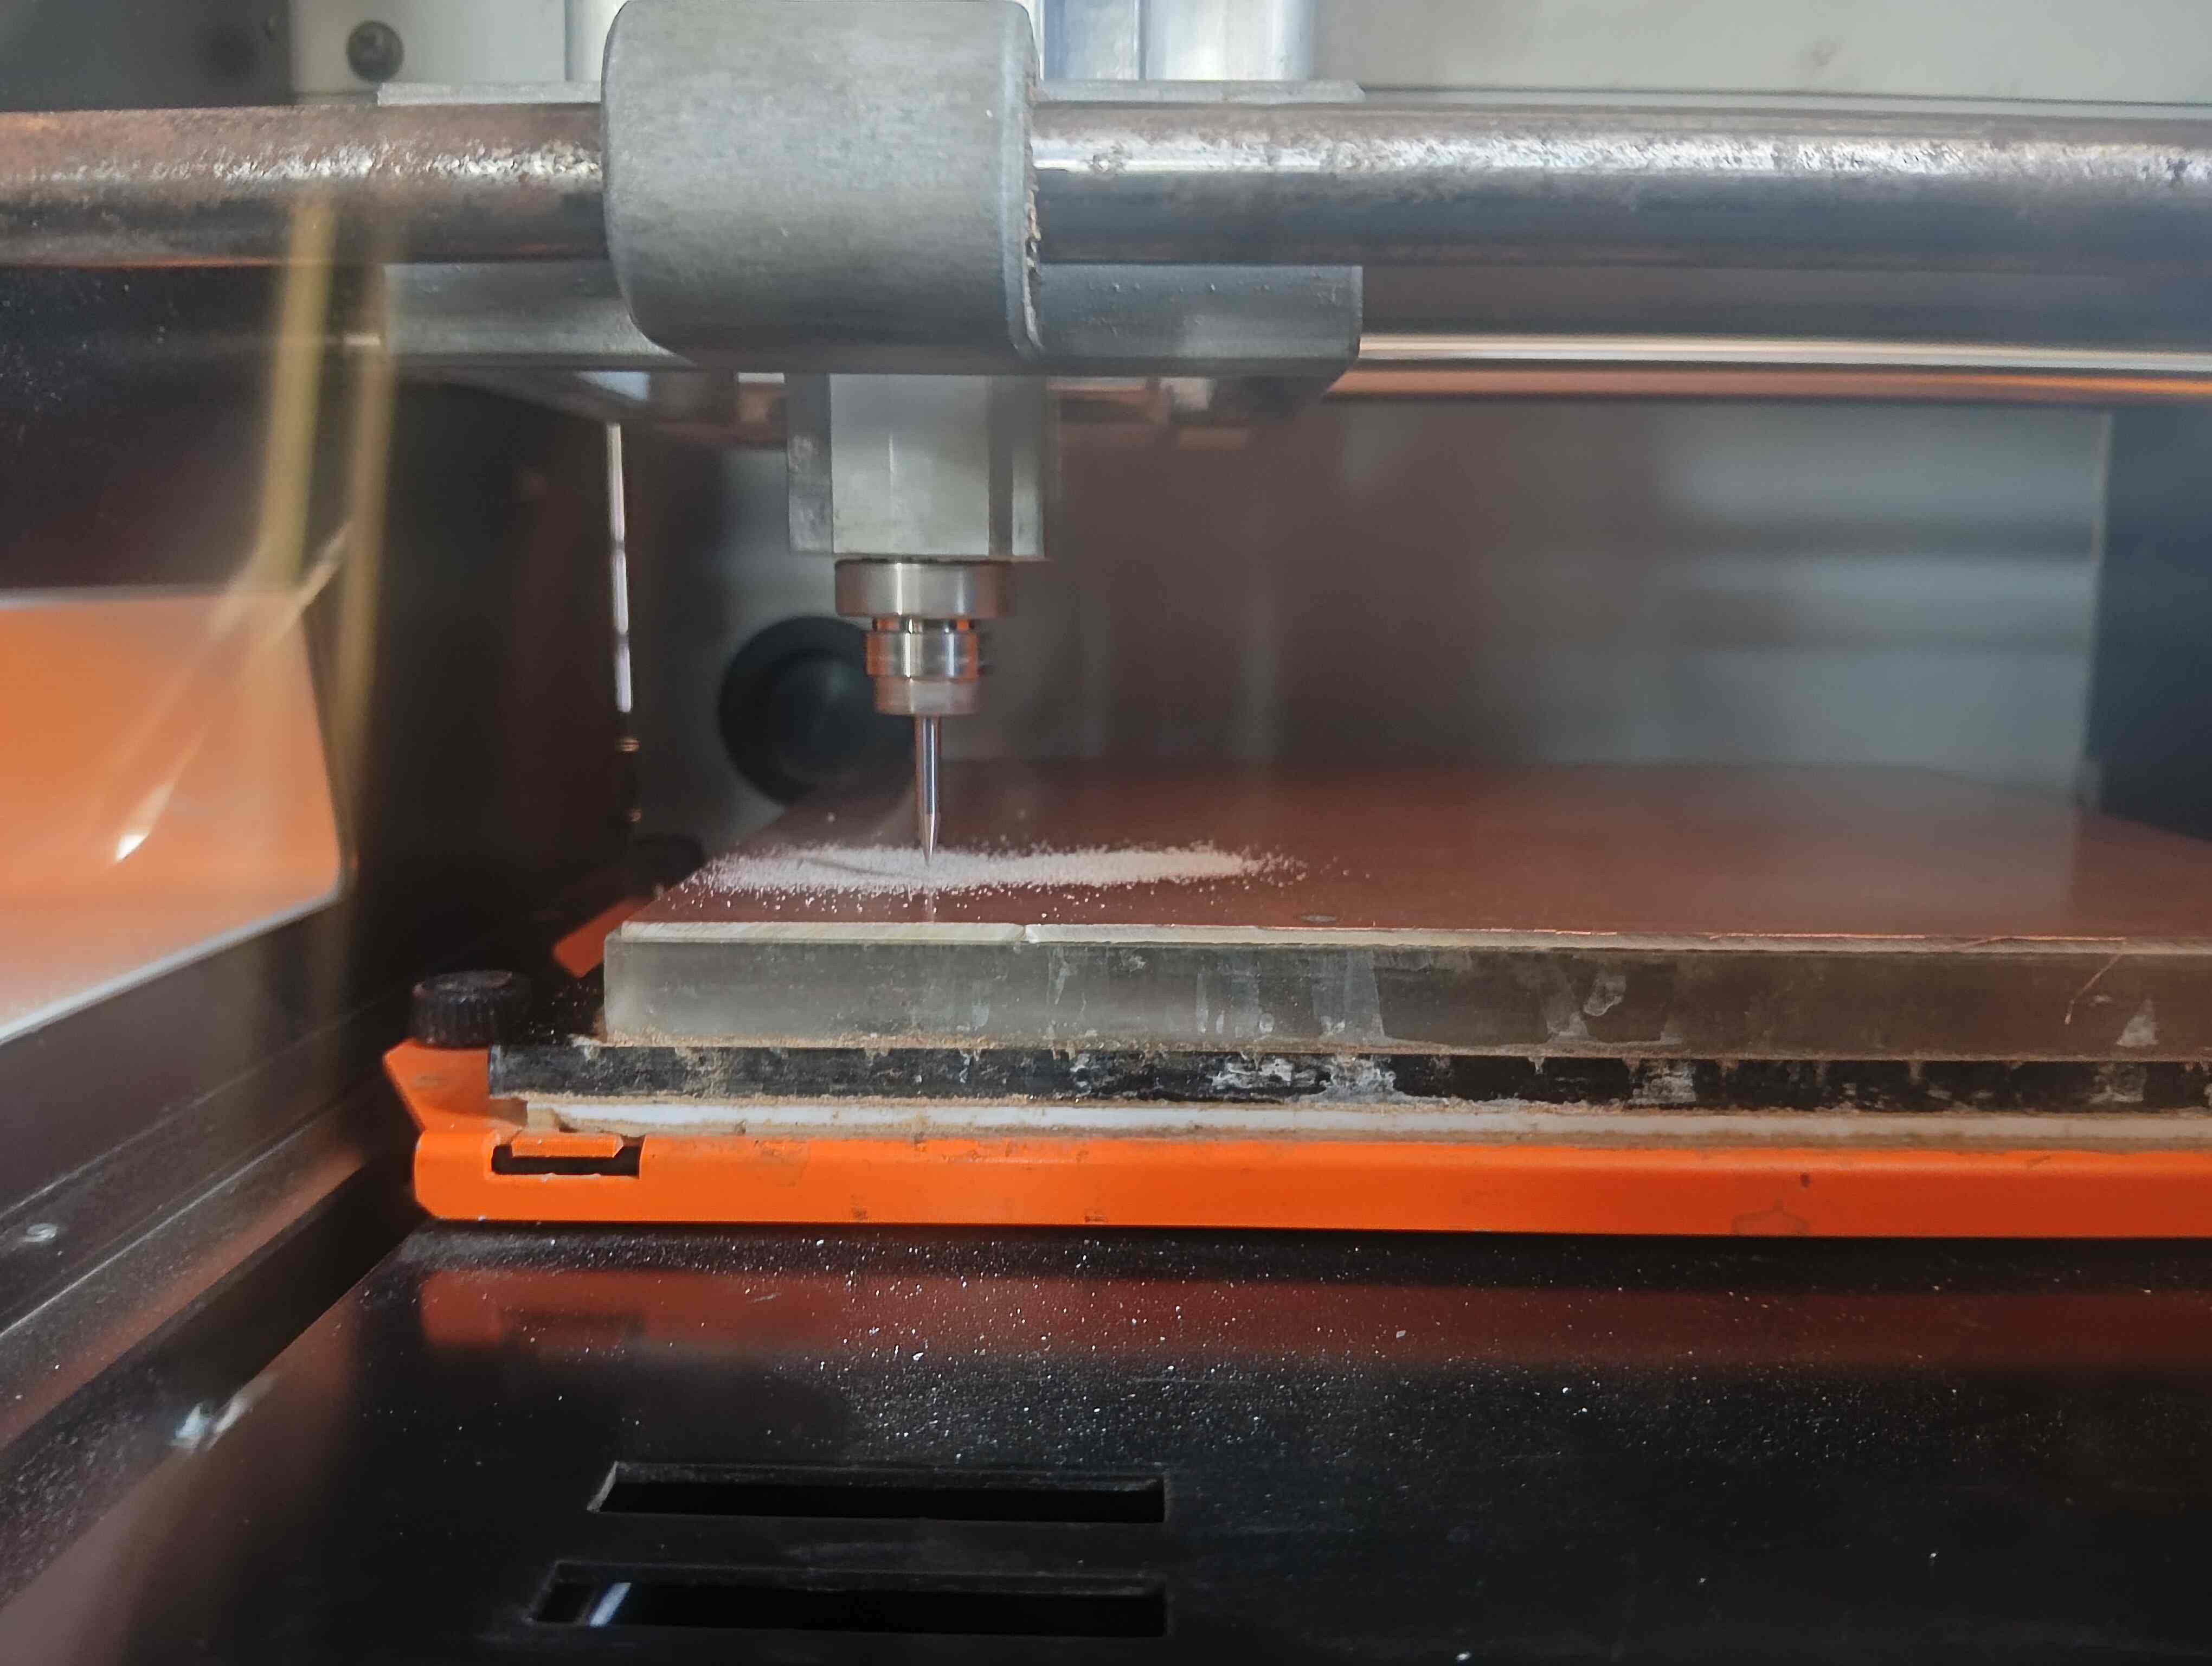
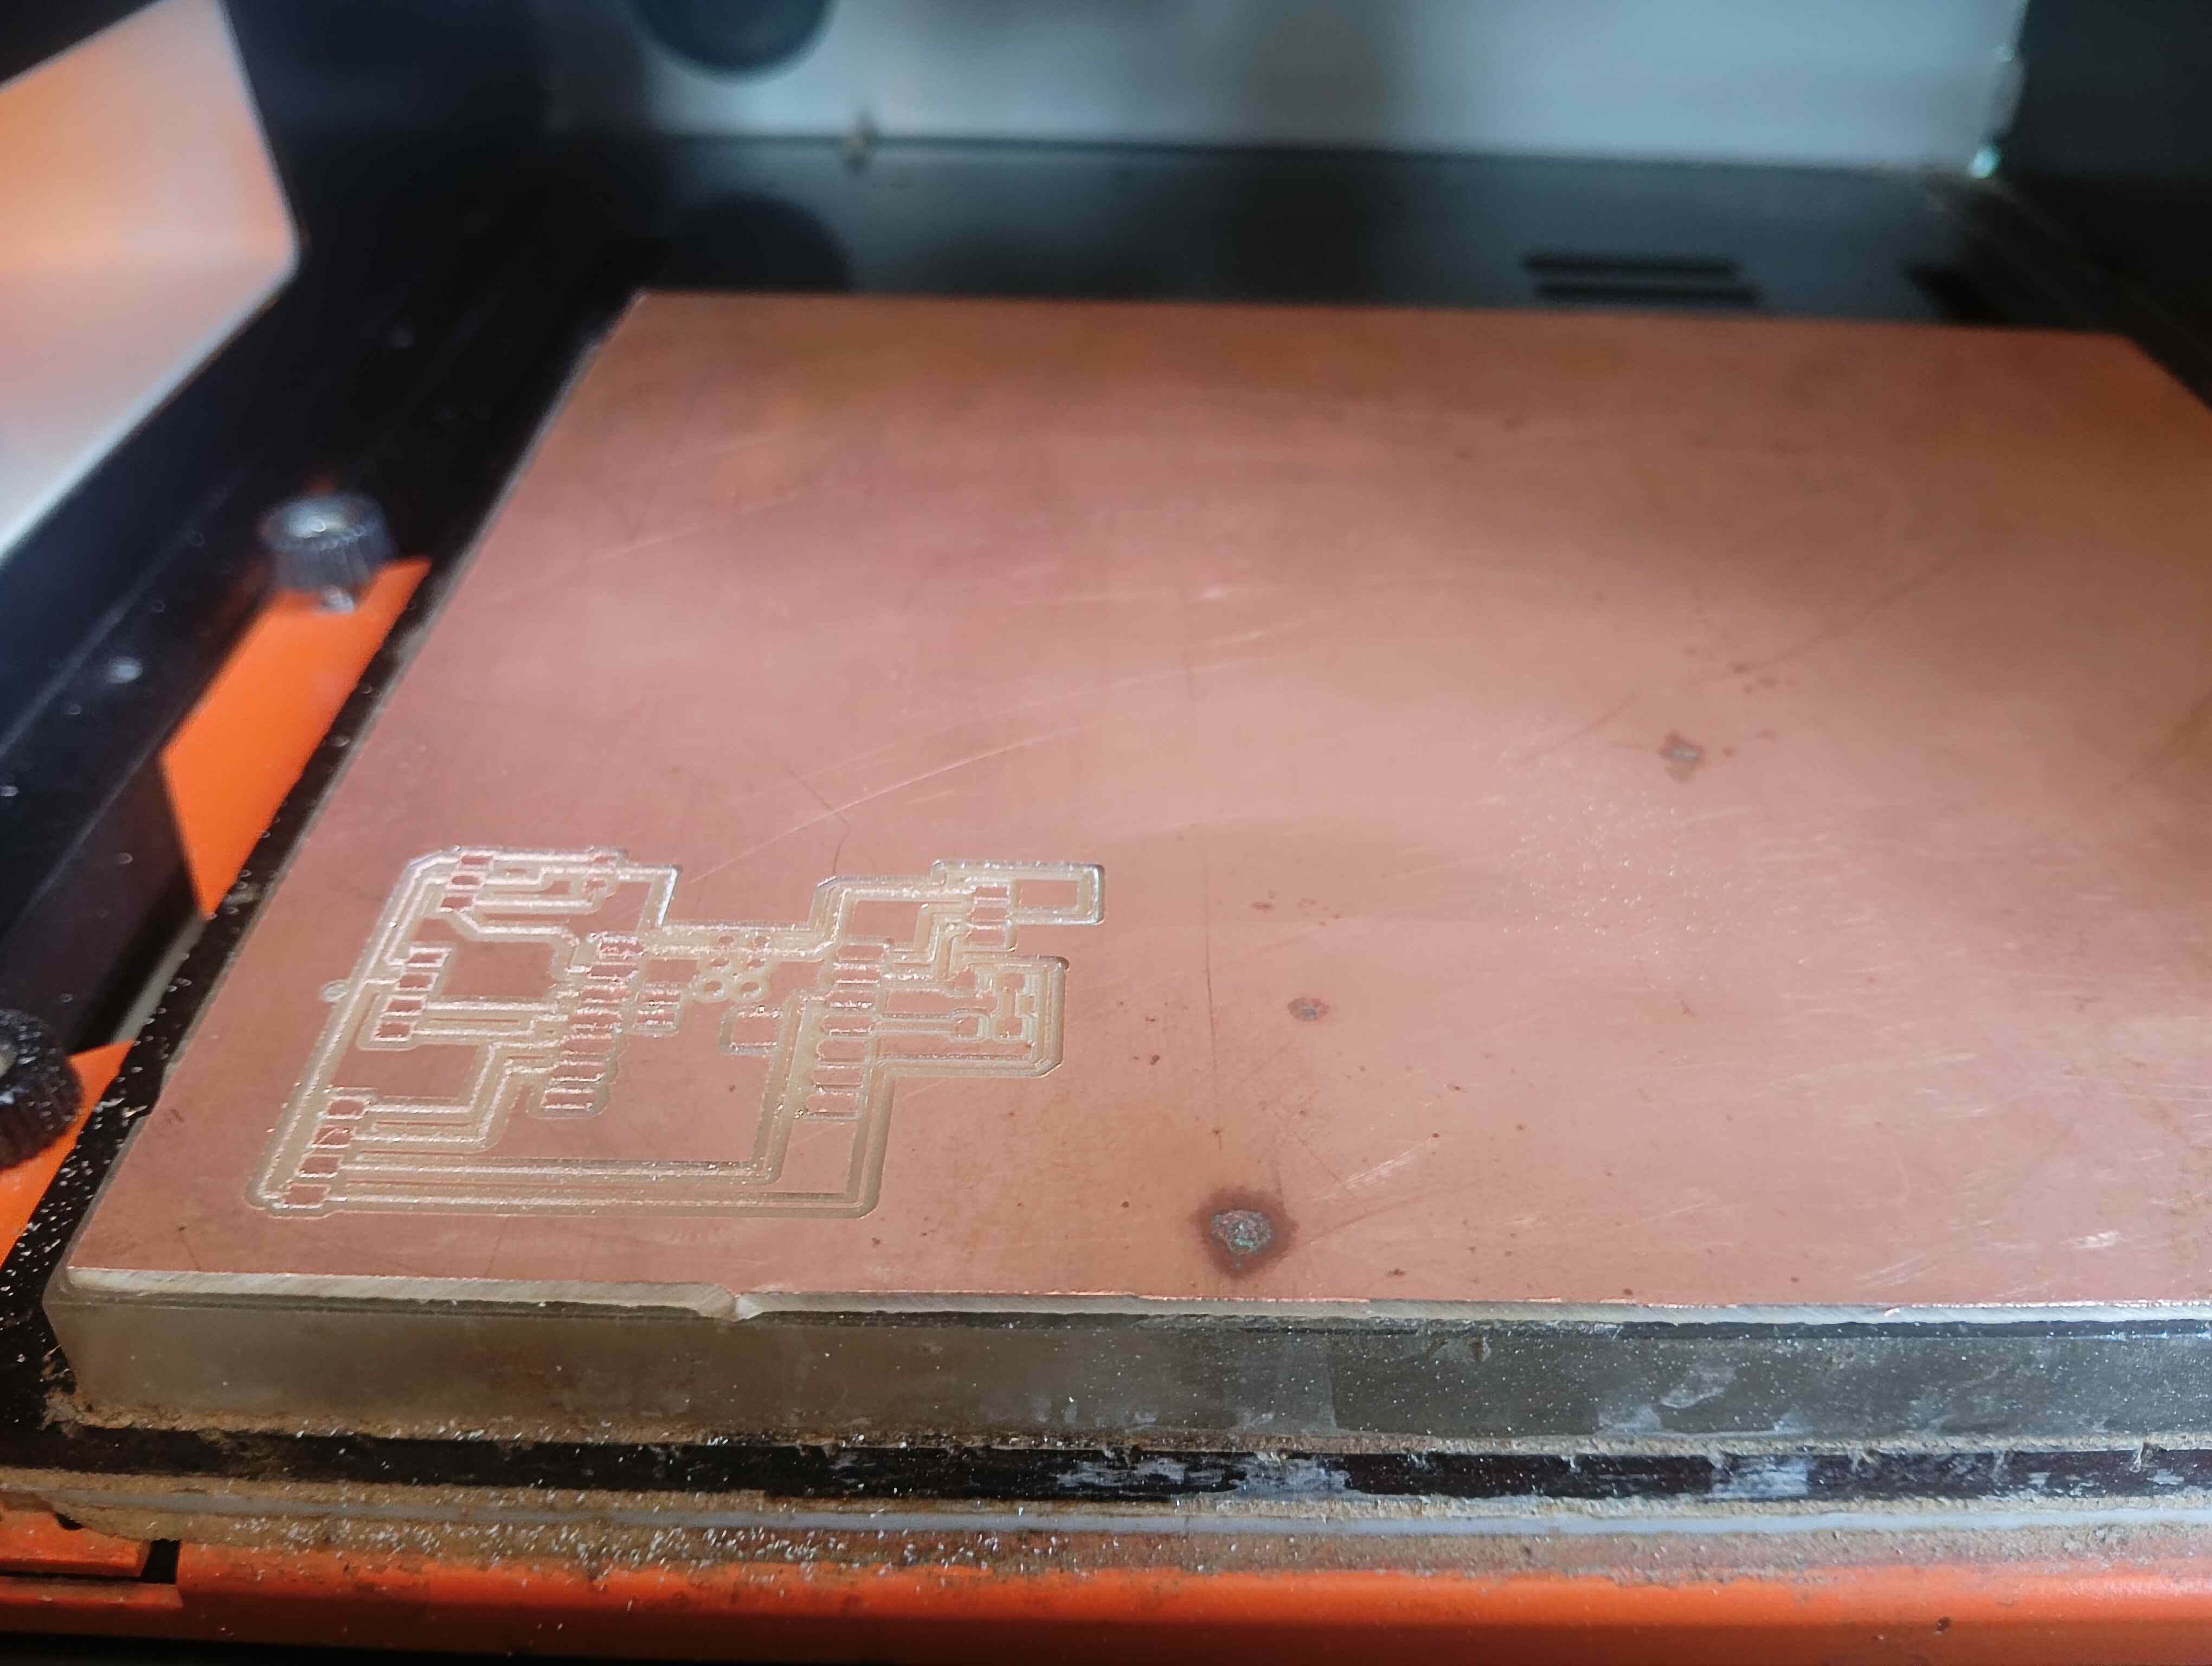
Then, I started my cutting process, beginning with the inside cuts. The machine precisely followed the G-code, ensuring accurate cuts. Once the inside cutting was completed, I inspected the results. The cut turned out good and clean, as shown below. This step ensured that all inner sections were properly shaped before proceeding to the edge cutting.
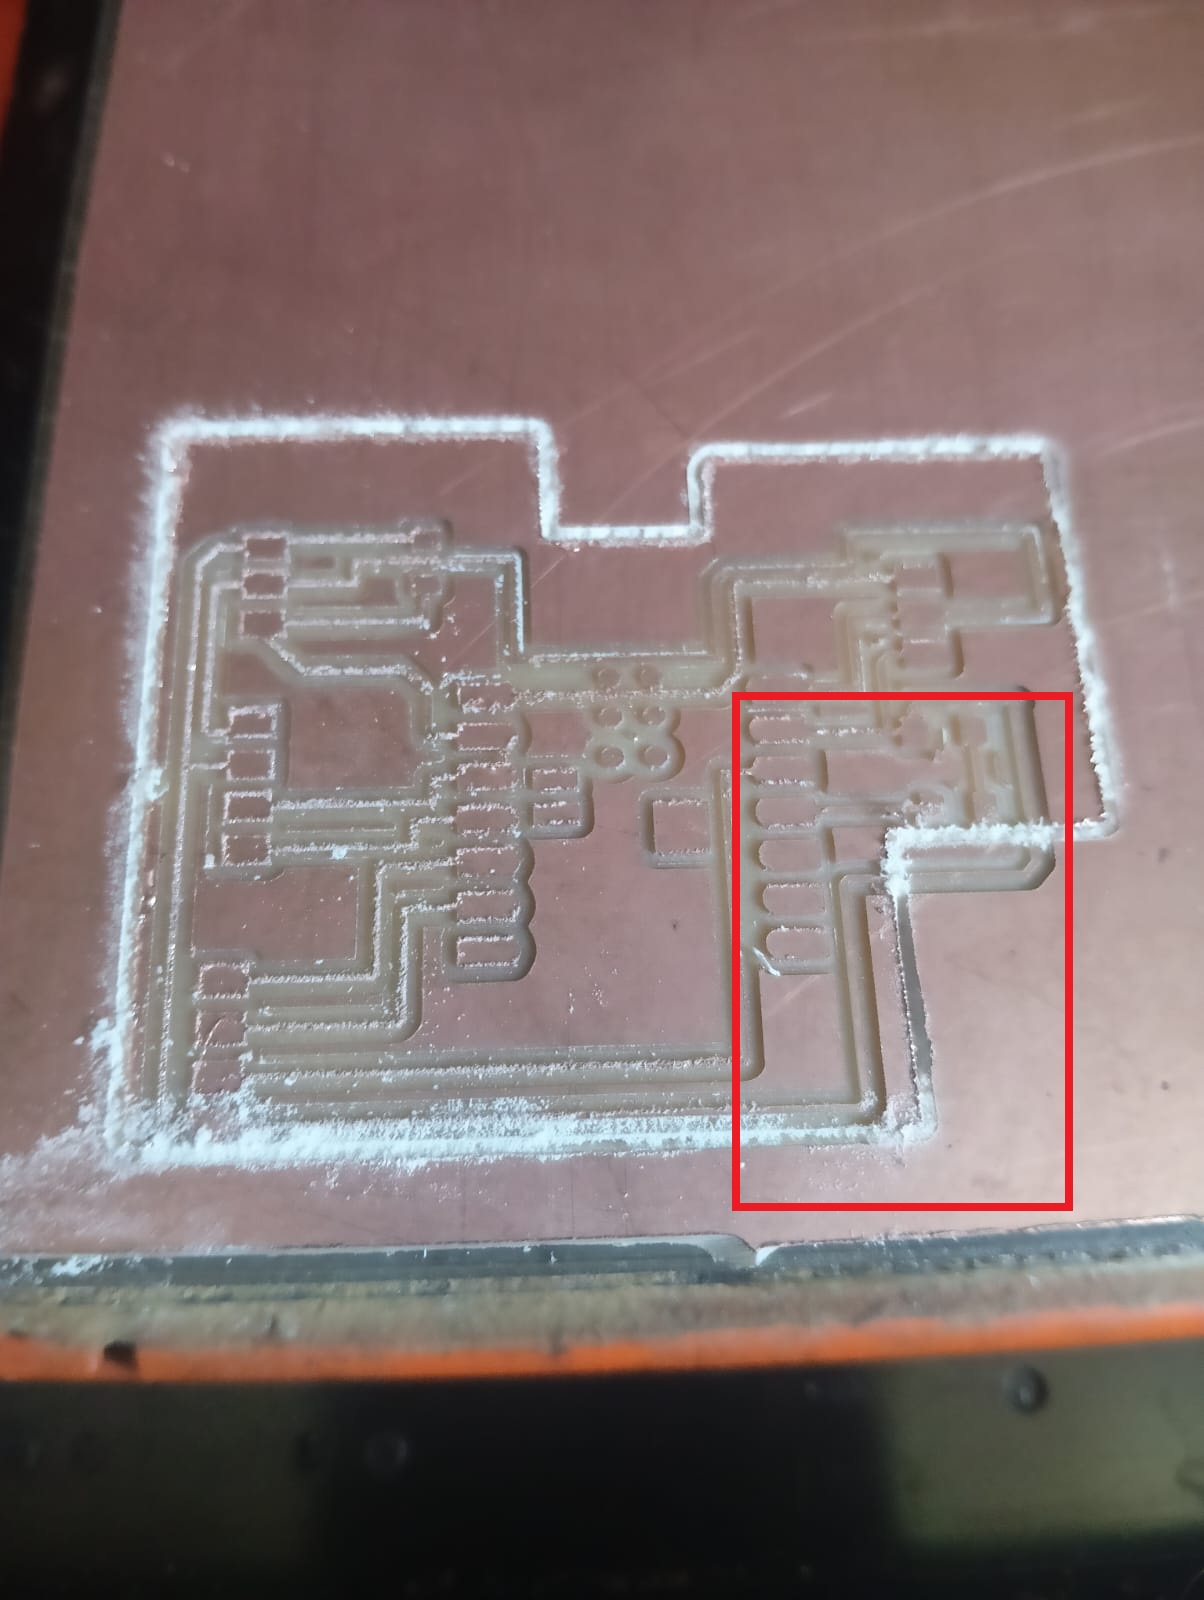
After completing my inside cut, I cleaned the machine again to ensure smooth operation. Then, I proceeded with the edge cutting and changed my bit size to 64 before continuing the process. However, I faced an issue where the edge cut overlapped with the inside cut, affecting the final shape.
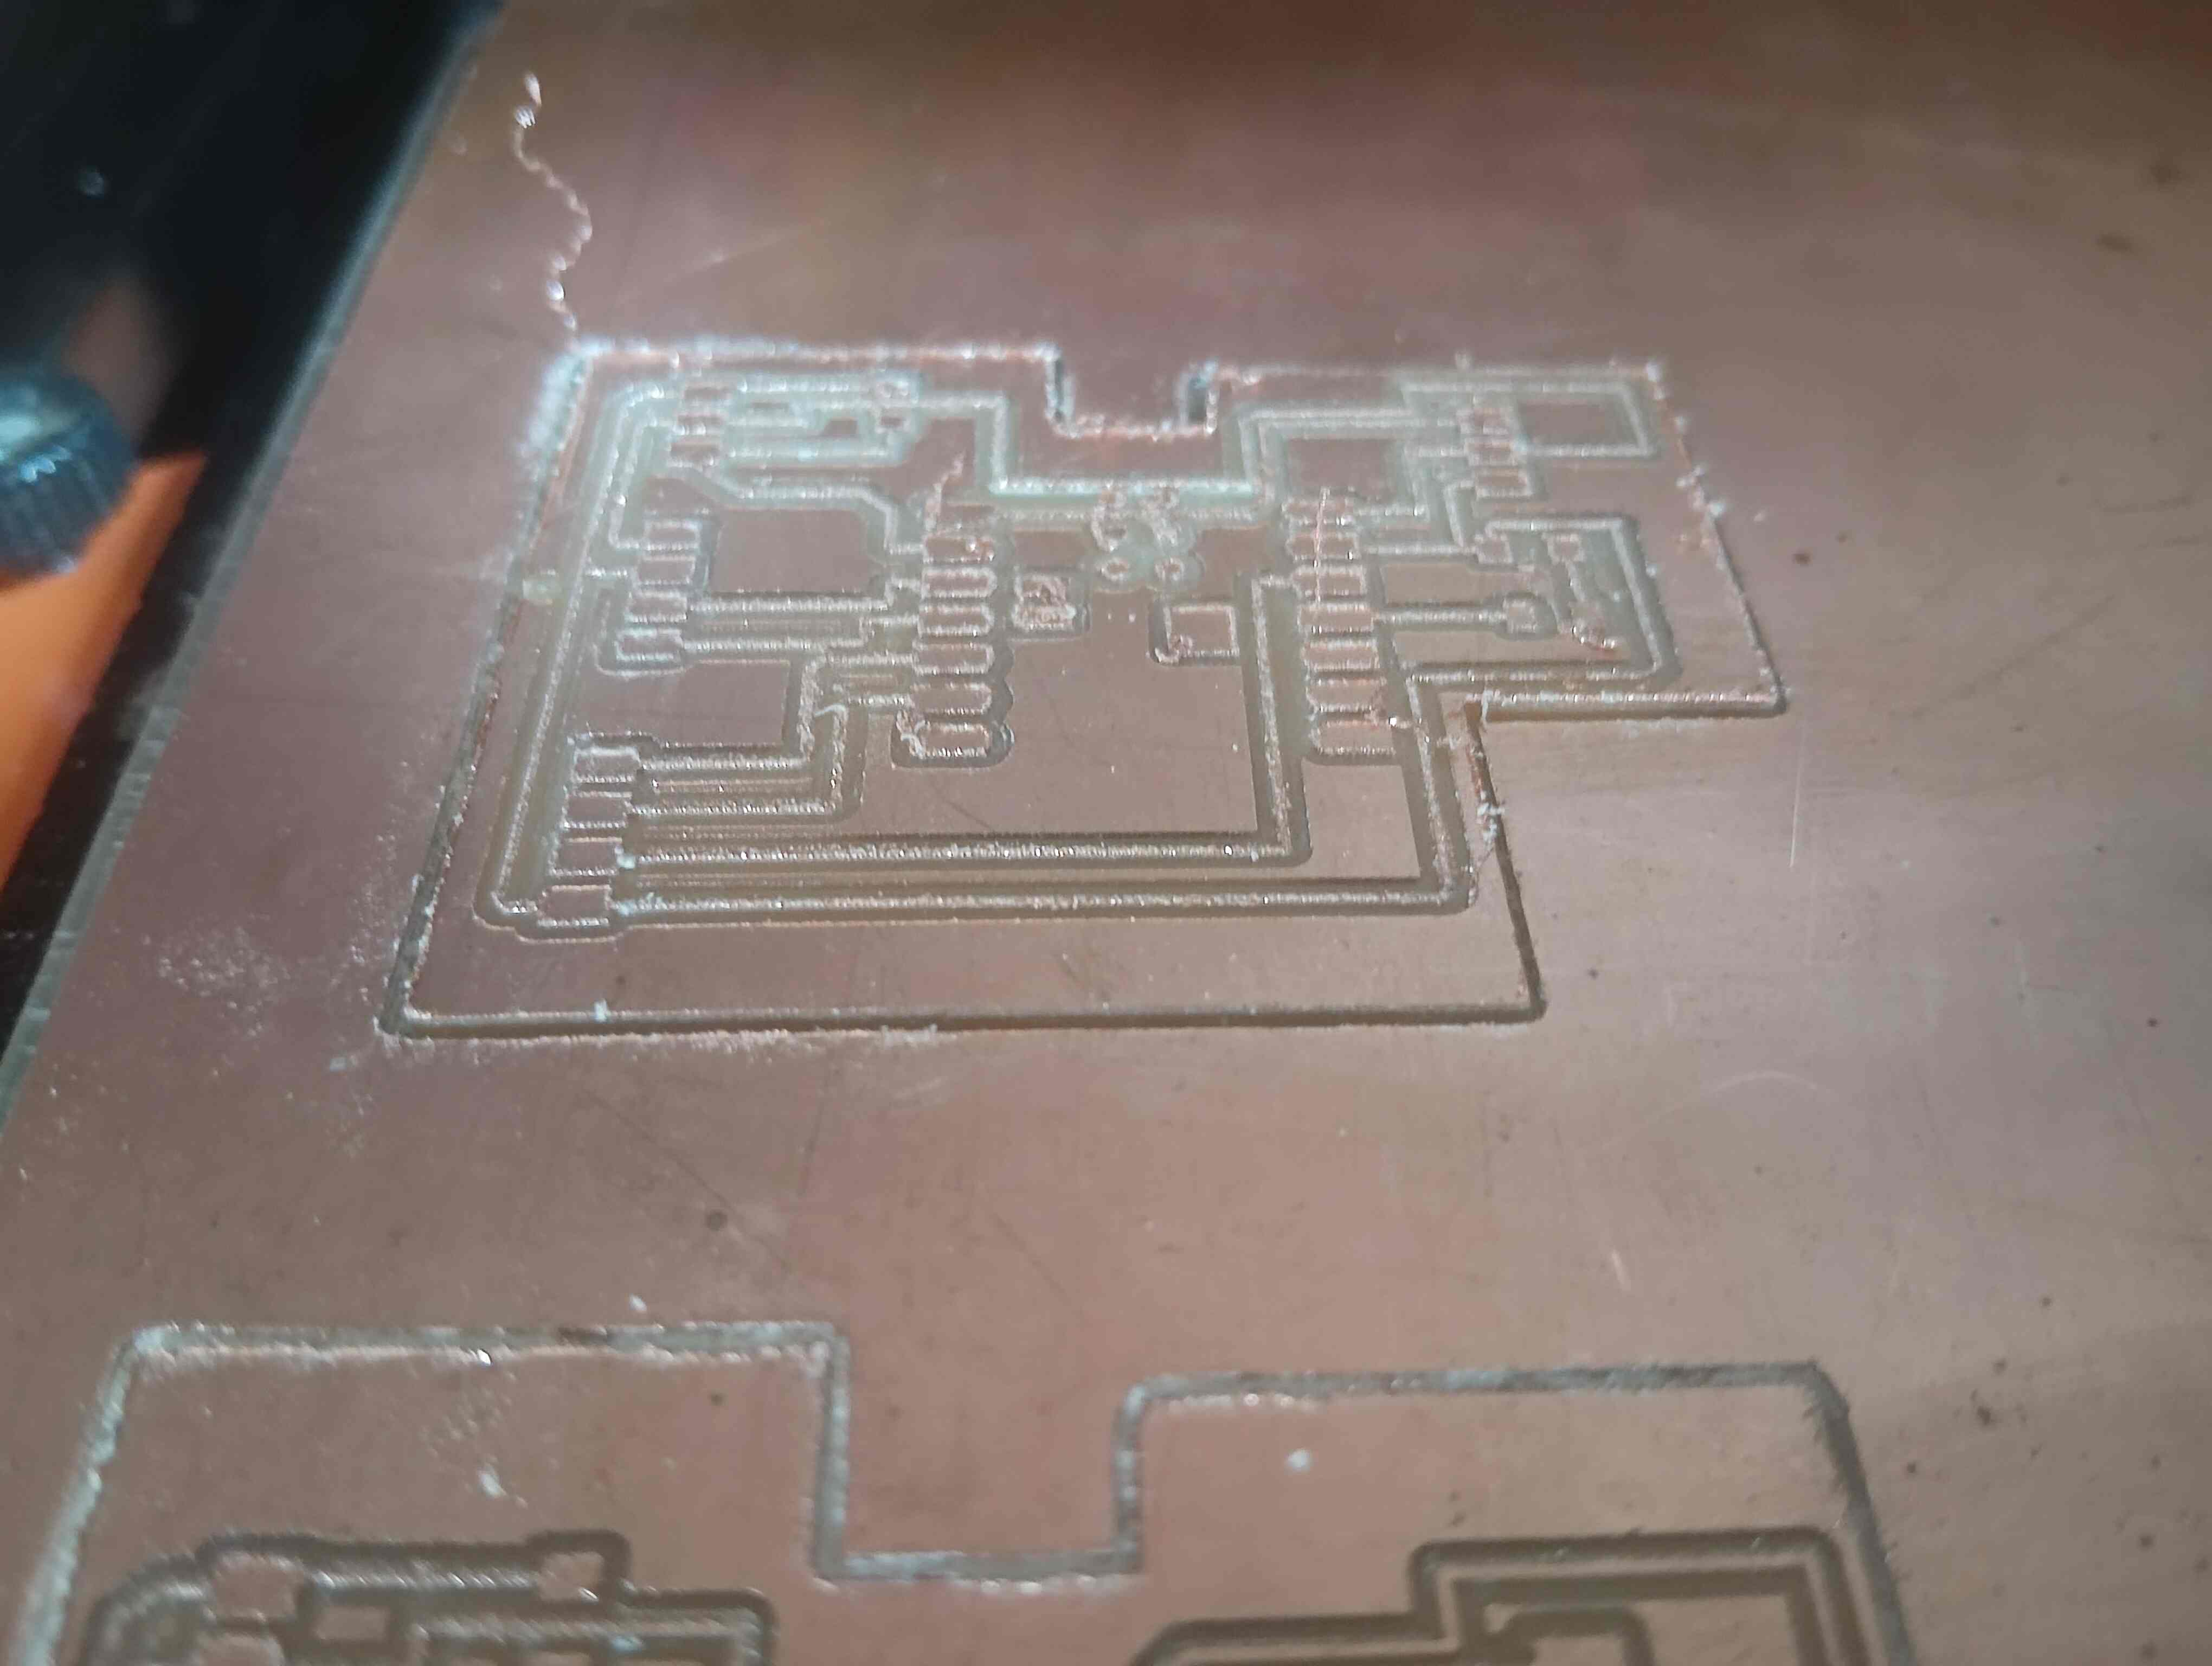
This mistake led to unwanted cuts in my design, as shown in the image below. I will carefully analyze the issue to understand the cause of the error. It could be due to incorrect toolpath settings or misalignment. I will make the necessary adjustments to avoid this problem in my next attempt.
I understood my mistake and analyzed what went wrong in the cutting process. Now, I am ready to make a second attempt with adjustments to reduce errors. I will carefully check the alignment and toolpath before starting the next cut. This time, I will ensure precise cutting without overlapping the inside and edge cuts. With these corrections, I aim for a successful PCB fabrication.
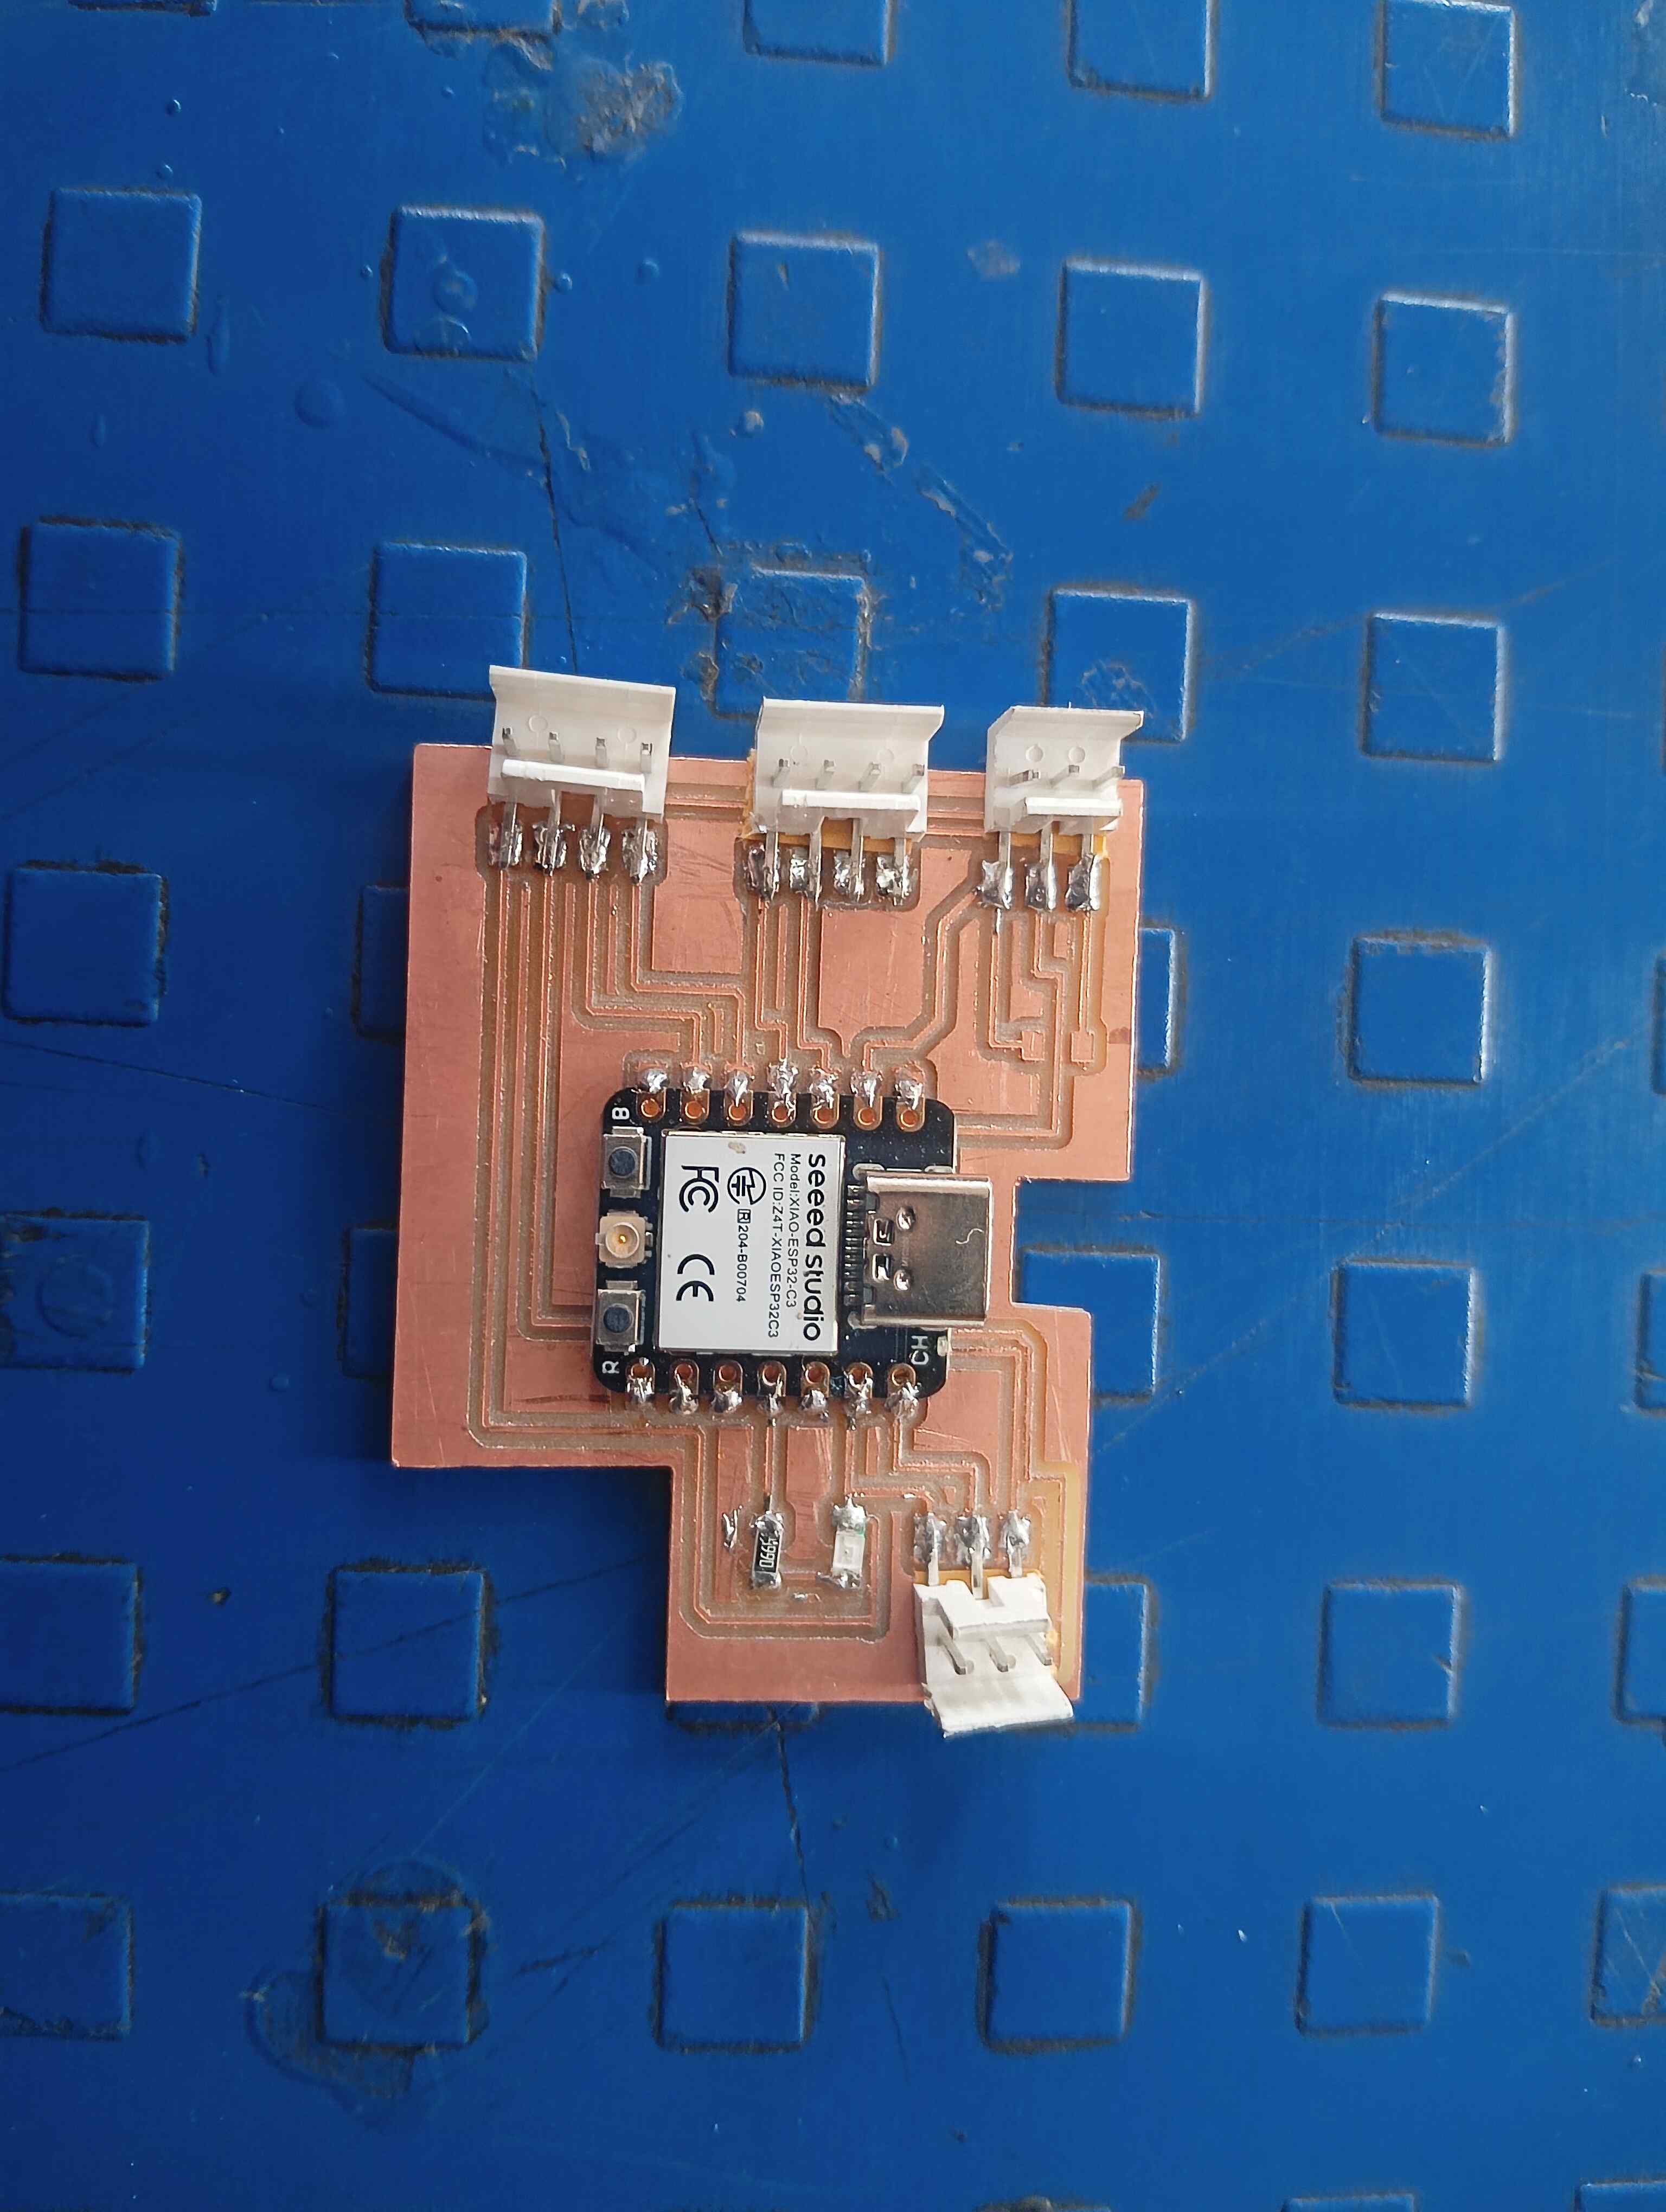
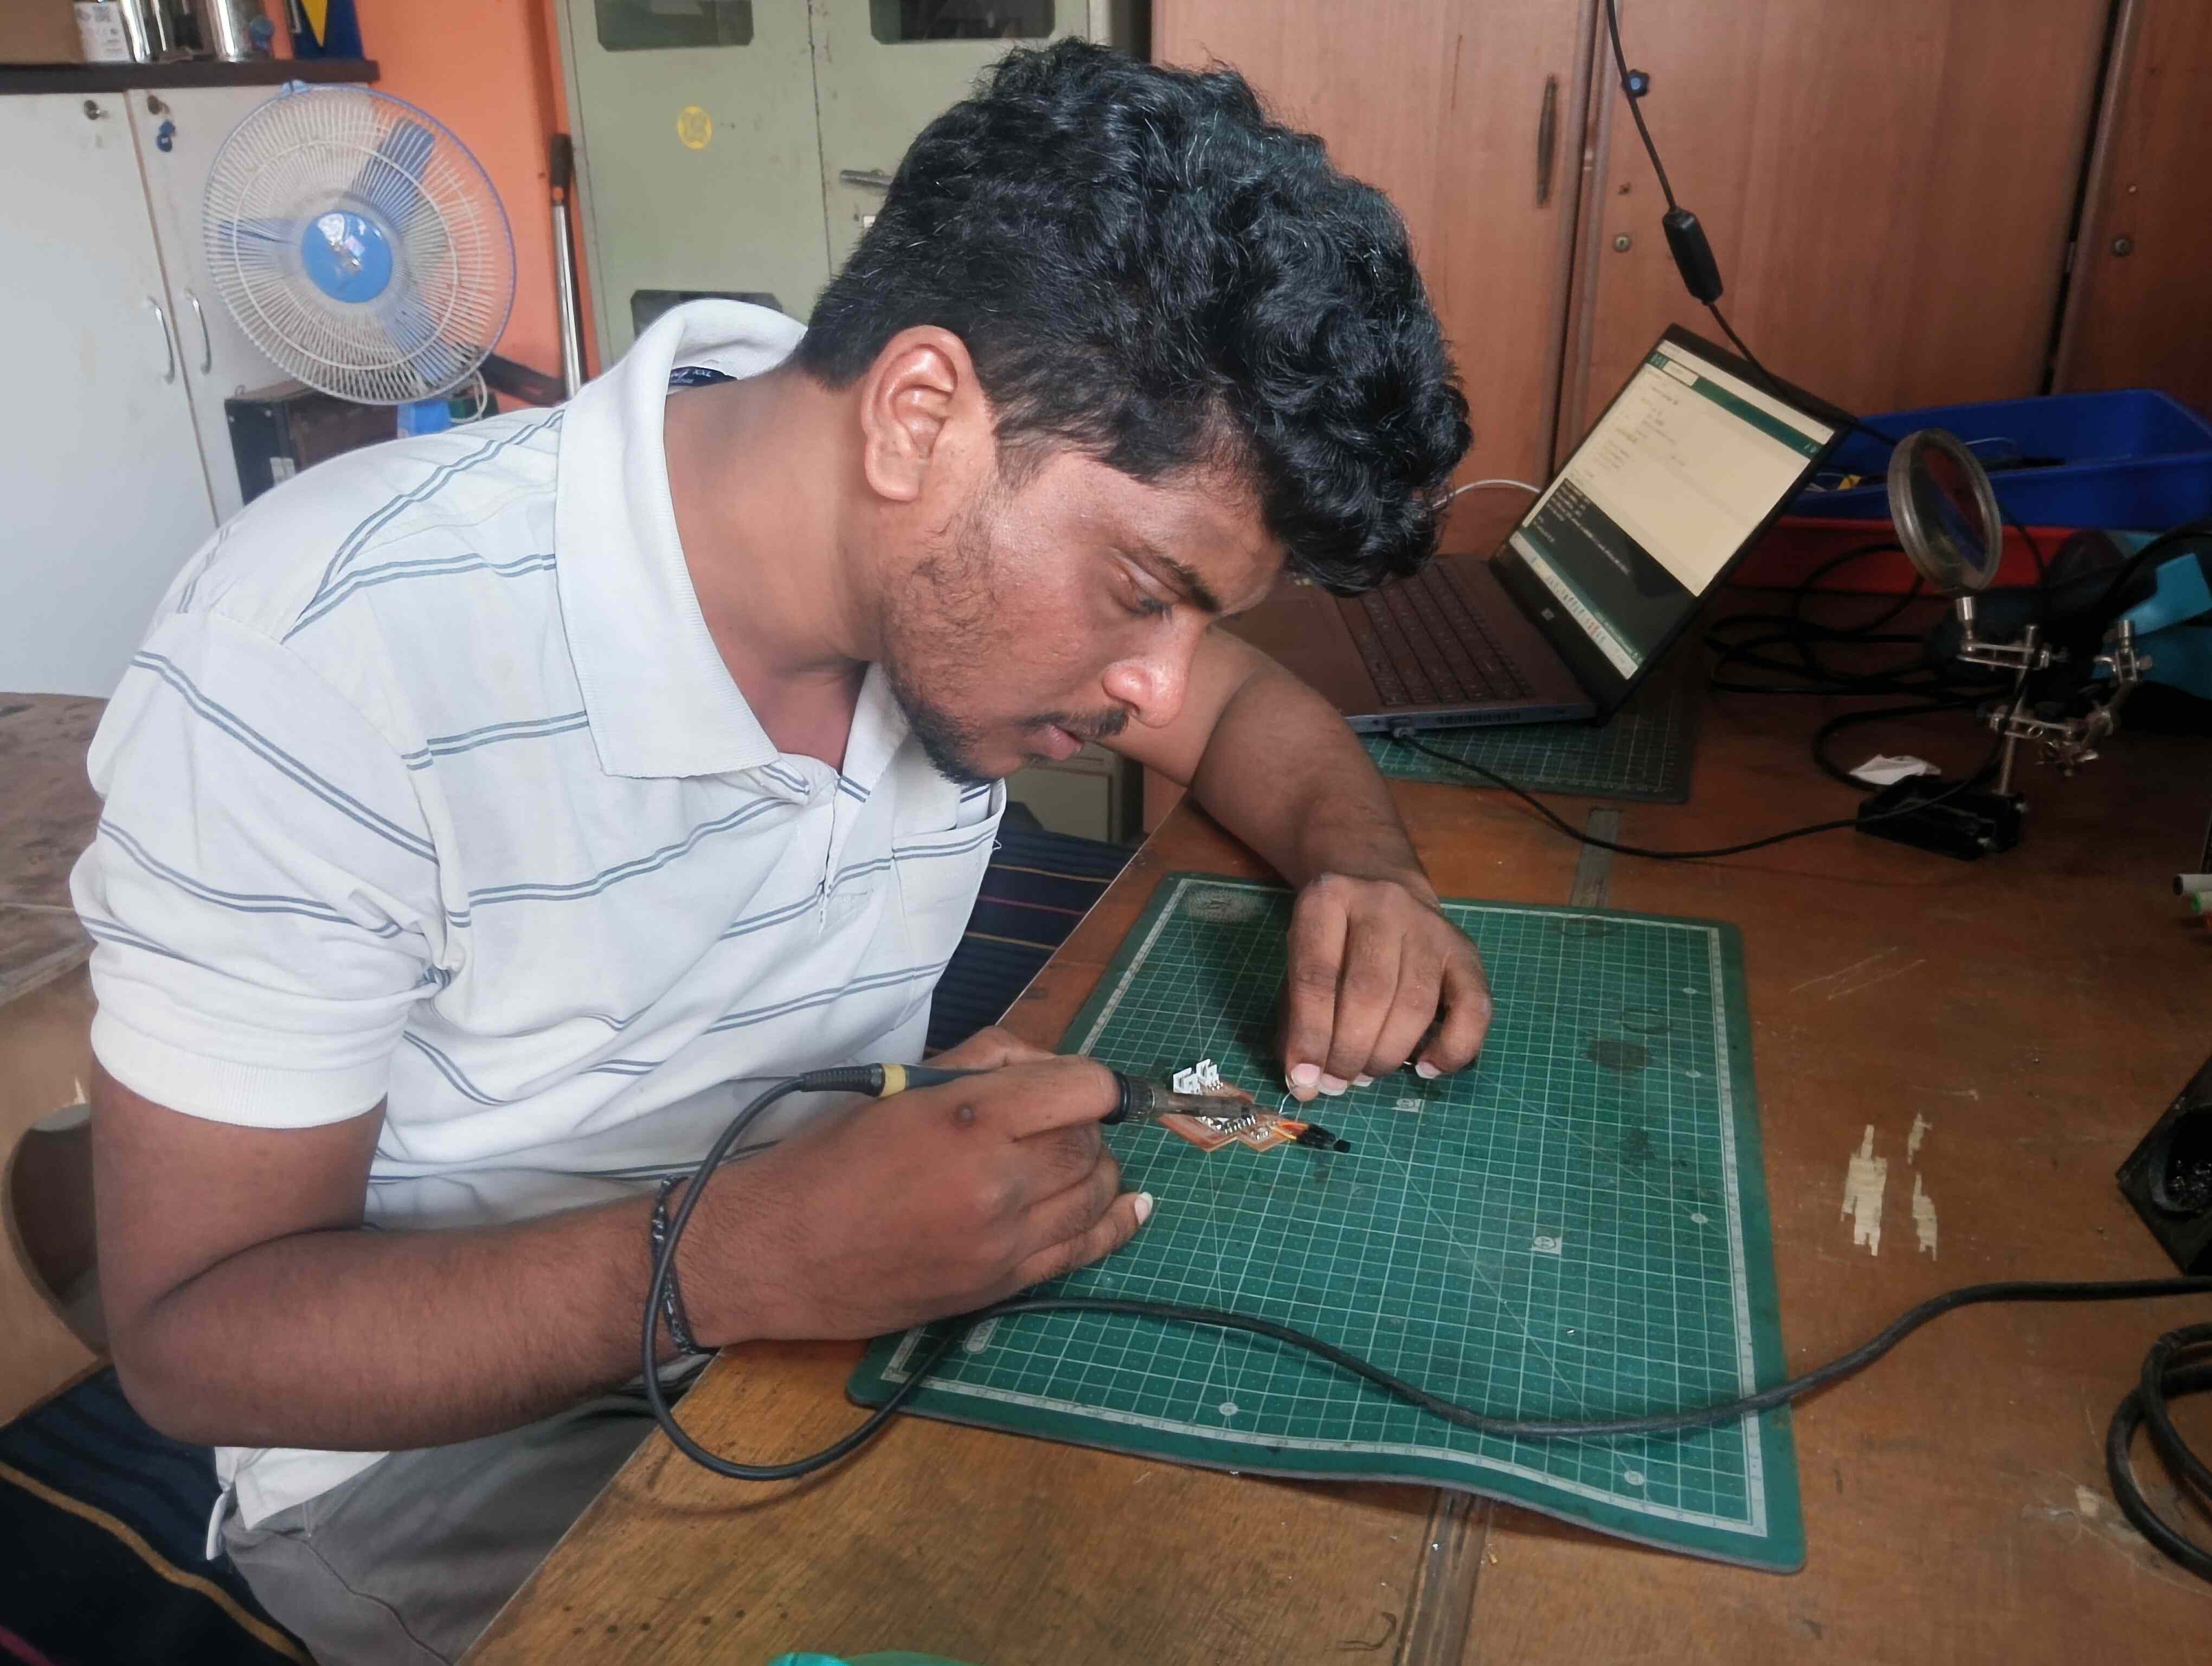
Now, I have successfully completed my PCB milling process. Next, I will move on to soldering the required components onto my board. I have gathered all the necessary components and prepared my tools. I will carefully solder each component, ensuring proper connections. This step is crucial to make my board fully functional.
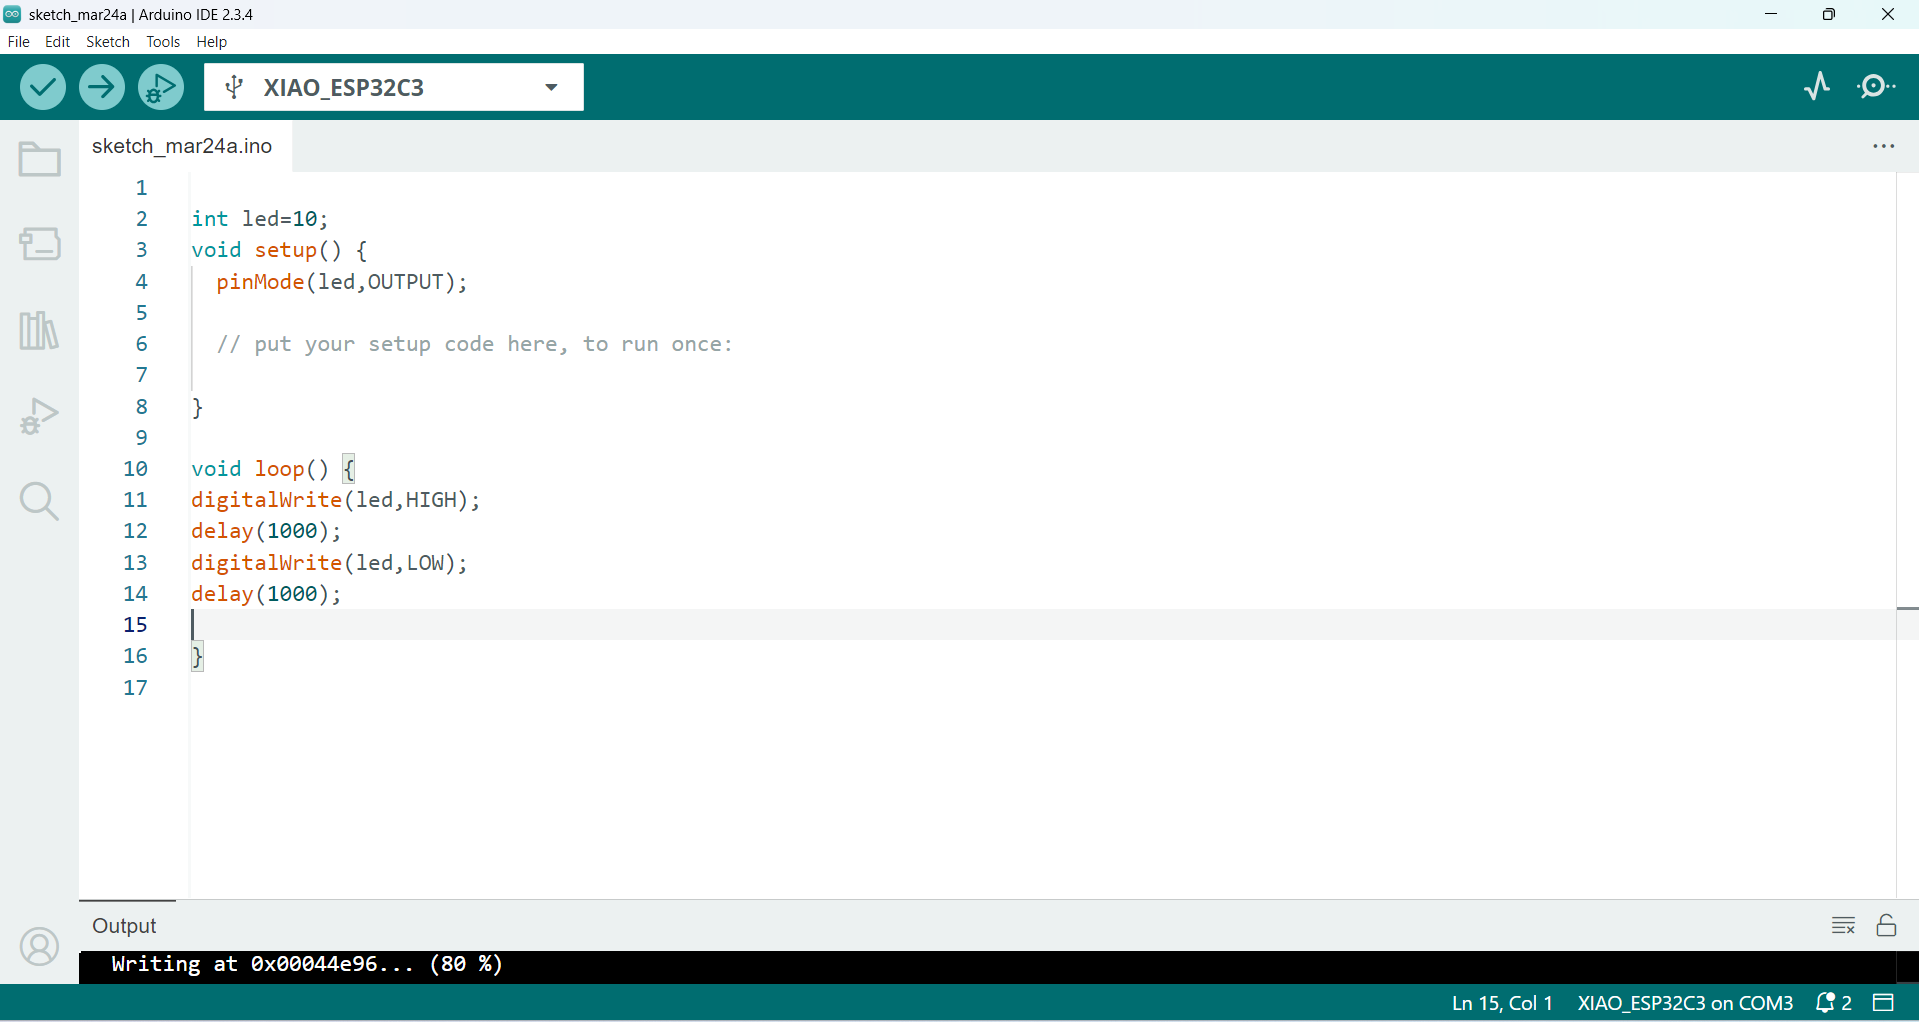
After completing the soldering, I carefully checked all the connections to ensure they were properly made. Then, I tested my board using a blink code to verify if it was functioning correctly. I used Arduino IDE for programming my microcontroller. Since excessive heat during soldering can sometimes damage components, I wanted to confirm that everything was working as expected. After successfully testing the board and ensuring it was functioning properly, I proceeded with my project.
Then, I started assembling all the input components onto my board. I carefully connected each sensor and ensured proper wiring. This step was crucial to make my board fully functional for testing.
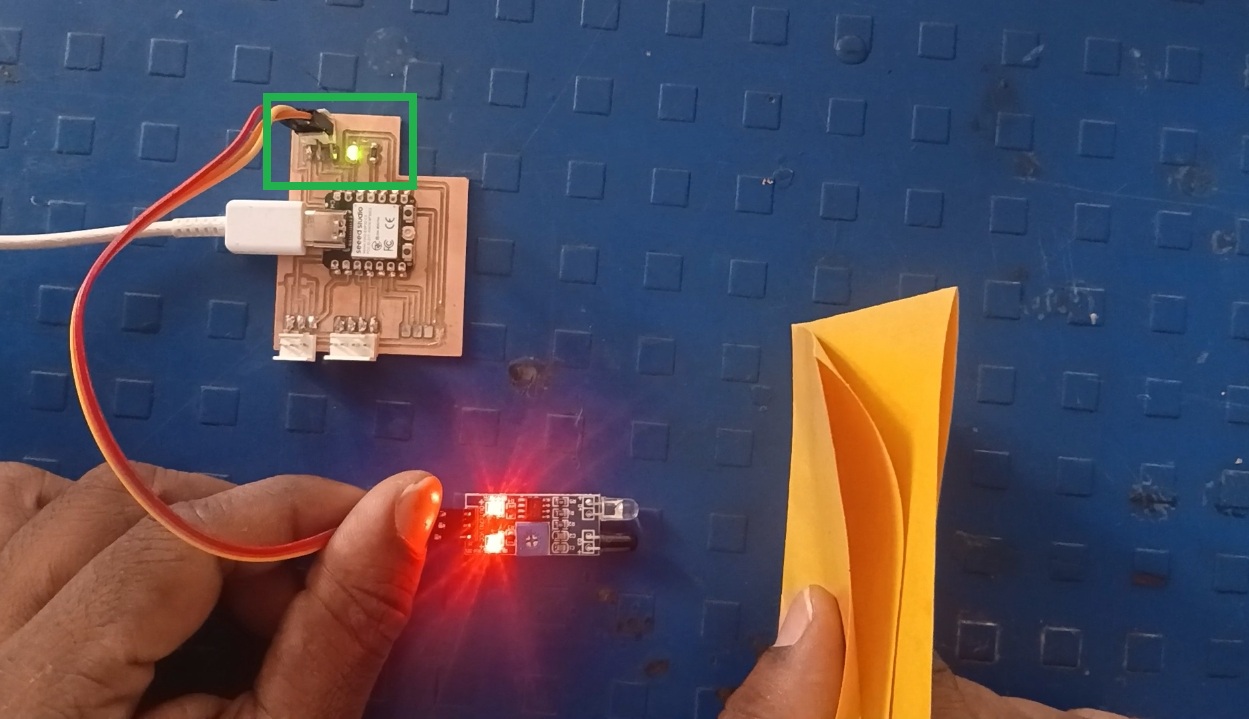
1.Using First Input Device with My Custom Board
I started working with an IR sensor as my first input device and connected it to my custom board. My initial step was to read the sensor values to detect objects at different distances. The board processed the IR sensor's output and determined the presence of an object. To make use of this data, I wrote a program that allowed the sensor readings to control an LED based on object proximity. When an object was detected within a set distance, the LED turned ON, and when the object moved away, the LED turned OFF. I fine-tuned the distance threshold to improve accuracy and ensure reliable detection. Through multiple tests and debugging, I optimized the setup for better responsiveness and real-time control, making it an important step in my project development.
Below, we can see the live readings from my input device in real time. The sensor continuously detects and processes data, displaying the measured values. This demonstrates the working of my input device and its accuracy in capturing readings.
In the observed videos, the LED turns on when an object approaches the sensor. This indicates that the sensor detects the object's presence and triggers the LED. The LED remains on as long as the object stays within the sensor's detection range.
Arduino Code:
                #define ir A0  // Change this to your actual ADC pin
                int led = 10;

                void setup() {
                    Serial.begin(115200); // Initializes serial communication at 115200 baud rate.
                    pinMode(led, OUTPUT); // Sets pin 10 as an OUTPUT to control the LED.
                    delay(1000); // 1-second delay before starting.
                }

                void loop() {
                    int IR = analogRead(ir); // Reads the analog value from the IR sensor.
                    Serial.print("IR="); // Prints "IR=" to the serial monitor.
                    Serial.println(IR); // Prints the sensor reading.
                    delay(100); // 100ms delay to control the frequency of readings.

                    if (IR <= 300) {
                        digitalWrite(led, HIGH); // Turns the LED ON.
                        Serial.print("led onn");
                    } else {
                        digitalWrite(led, LOW); // Turns the LED OFF.
                        Serial.print("led off");
                    }
                }
Explanation of the Code:
1. Defining Variables and Pin Configuration
I The IR sensor's output is connected to analog pin A0.
II The LED is connected to digital pin 10.
2.Setup Function
III Serial communication is started for debugging.
IV Serial communication is started for debugging.
V LED pin is set as an output.
VI A 1-second delay allows the system to stabilize before running the main loop.
3.Main Loop (Repeated Execution)
VII The IR sensor value is read using analogRead(ir).
VIII The value is printed to the Serial Monitor for debugging.
IX A 100ms delay is added to prevent excessive readings.
4.LED Control Based on IR Sensor Readings
X If the IR sensor value is ≤ 300, the LED turns ON.
XI If the IR sensor value is > 300, the LED turns OFF.
XII IThe LED state is also printed to the Serial Monitor.
2.Using LM35 Temperature Sensor with My Custom Board
After completing the connection of my first sensor with my board, I connected the LM35 temperature sensor to it. Then, I started coding to read temperature values from the LM35. After successfully receiving the readings on the serial monitor, I modified my code to include an LED control feature. The LED turns ON or OFF based on temperature conditions. The final setup, including the sensor and LED, is shown in the picture below.
Below, we can see the live readings from my input device in real time. The sensor continuously detects and measures temperature data, displaying the values on the serial monitor. This demonstrates the functionality of my input device and its ability to capture accurate readings. The real-time updates ensure that temperature changes are monitored instantly. This confirms the accuracy and reliability of the sensor in detecting temperature variations.
In the observed videos, the LED turns ON when the temperature reaches 40 degrees Celsius. This indicates that the sensor detects the temperature and triggers the LED accordingly. The LED remains ON as long as the temperature stays above 40 degrees. Once the temperature drops below 40 degrees, the LED turns OFF. This demonstrates the sensor’s accuracy in monitoring temperature changes.
Arduino Code:
                #define sensorPin A0
                int led =10;
                void setup() {
                    Serial.begin(9600);
                    pinMode(led,OUTPUT);
                }

                void loop() {
                    int reading = analogRead(sensorPin);
                    float voltage = reading * (5.0 / 1024.0); // Convert ADC value to voltage (assuming 5V reference)

                    float temperature = voltage * 15.5; // LM35 outputs 10mV per °C (5V = 500°C)
                if (temperature >=40)
                {
                    digitalWrite(led,HIGH);

                }
                else
                {
                    digitalWrite(led,LOW);
                }
                    Serial.print("Temperature: ");
                    Serial.print(temperature);
                    Serial.print(" \xC2\xB0");
                    Serial.println("C");

                    delay(1000);
                }
Explanation of the Code:
1. Define the Sensor Pin
I #define is a preprocessor directive that defines sensorPin as A0.
II A0 refers to Analog Pin 0 on the Arduino, where the LM35 temperature sensor is connected.
III The LM35 outputs an analog voltage proportional to the temperature.
2. Define the LED Pin
I Creates an integer variable led and assigns it to pin 10.
II This pin controls an LED, which turns on or off based on the temperature.
3. Setup Function (Runs Once)
I setup() is executed once when the Arduino starts.
II Serial.begin(9600); initializes the serial communication at a baud rate of 9600.
III This allows data to be sent to the Serial Monitor for debugging.
IV pinMode(led, OUTPUT); sets the LED pin as an output, so we can control it.
4. Loop Function (Runs Continuously)
I loop() is executed repeatedly in an infinite cycle.
5. Read Analog Sensor Value
I analogRead(sensorPin); reads the analog voltage from the LM35 sensor.
II The value ranges from 0 to 1023 (10-bit ADC on Arduino).
III The result is stored in the integer variable reading.
6. Convert ADC Value to Voltage
I Converts the ADC value (reading) to voltage.
II Since Arduino uses a 10-bit ADC (0-1023) with a 5V reference, the formula is:
III Voltage=ADC value× 5.0V/1024
IV The result is stored in voltage.
7. Convert Voltage to Temperature
I This converts the measured voltage into Celsius temperature.
8. Check Temperature Condition
I If temperature is 40°C or more, the LED turns ON (HIGH).
I Otherwise, the LED turns OFF (LOW).
III This can be used as a temperature warning system.
9. Print Temperature to Serial Monitor
I Serial.print("Temperature: "); prints text "Temperature: " to the Serial Monitor.
II Serial.print(temperature); prints the temperature value.
III Serial.print(" \xC2\xB0"); prints the degree symbol (°).
IV Serial.println("C"); prints "C" for Celsius and moves to the next line.
10. Delay Before Next Reading
I delay(1000); pauses the loop for 1000 milliseconds (1 second).
II This prevents the sensor from updating too frequently.
Positive Outcomes:
This week, I explored the working principles of various input devices and gained a deeper understanding of how sensors collect and process data. I learned the basics of analog and digital input signals and successfully interfaced multiple sensors with microcontrollers. Through hands-on experimentation, I analyzed sensor data using serial communication and visualization tools, which helped me understand the importance of calibration and accuracy in sensor readings. Additionally, I experimented with different input devices to enhance my practical knowledge. This experience has strengthened my foundation in sensor-based systems and applications, preparing me for more advanced projects in the future.
Challenges Encountered:
This week, I faced an issue with the ultrasonic sensor after uploading the code. The port was not showing in the IDE, and even after resetting the board, the port reappeared, but the code still did not work. I had to troubleshoot the issue by checking the connections, power supply, and baud rate settings. Another challenge I faced was with PCB engraving—I engraved my PCB properly, but when cutting the outline (edge cut), it mixed with the inside cut (engraved traces). This affected the precision and alignment of the board. I realized that proper design constraints and tool settings are crucial for accurate cutting. I also learned the importance of verifying cutting paths in CAM software before execution. Through these challenges, I gained valuable troubleshooting experience in both electronics and fabrication.