Final Project
Week 0: Digital Fabrication Principles and
Practices
Week 1:
Collaborative Technical Development, Documentation and Project
Management
Week 2:
Computer Aided Design
Week 3:
Computer Controlled Cutting
Week 4:
Electronics Production
Week 5:
3D Scanning and Printing
Week 6:
Electronics Design
Week 7:
Moulding and Casting
Week 8:
Embedded Programming
Week 9:
Computer Controlled Machining
Week 10:
Input Devices
Week 11:
Composites
Week 12:
Interface and Application Programming
Week 13:
Output Devices
Week 14:
Networking and Communications
Week 15:
Mechanical Design and Machine Design
Week 16:
Applications and Implications
Week 17:
Invention, Intellectual Property and Income
Week 18:
Project Development
Week 19:
Final Project Presentation
|
Interface and Application Programming
This
week's assignment is to write an application that interfaces with the
input devices that I constructed in Week 11. For this I decided
to use the Processing programming language to attempt to visualize the data from the sensor on your input device board.
The idea is to create sketches that use the Processing serial libaries
to read sensor input from my hello input devices boards. For my
final project I was thinking about trying display values from multiple
sensors on a graph against time, whilst logging the data which can then
be downloaded and analysed further independently to understand any
patterns or correlations of the input being received.
Using Processing:
I began by running through the tutorials
that are present in the processing website, initially to enable correct
functioning of Processing it is nessary to create a directory and add a
permission key. This was achieved in Terminal by typing:
sudo mkdir -p /var/lock
sudo chmod 777 /var/lock
Once the permissions were set I tested a couple sample sketches to
ensure that the sensor input was working correctly. Altering the
sample sketches found here
was easy enough to alter the graphical representation of the variable
input received from the sensor board. I initially started with
the hello light board sketch and found it fairly easy to alter the
rudimentary elements of the GUI, without radically altering the
processing code.
Using Python:
I began to look at the Python code we used to check the sensor board
was working and began trying to look at the code and understand the
fundamentals of what was happening. To modify the code I downloaded TextWrangler as a basic code editor as the Xcode freely available for OSX crashed on a regular basic - I found TextWrangler to be the most stable application. Looking through the Python example
for hello.temp.45, I could understand the code or at least I could see
what areas of the code related to which part of the program apart from
the 'idle routine' and find 'framing command routine' see below.
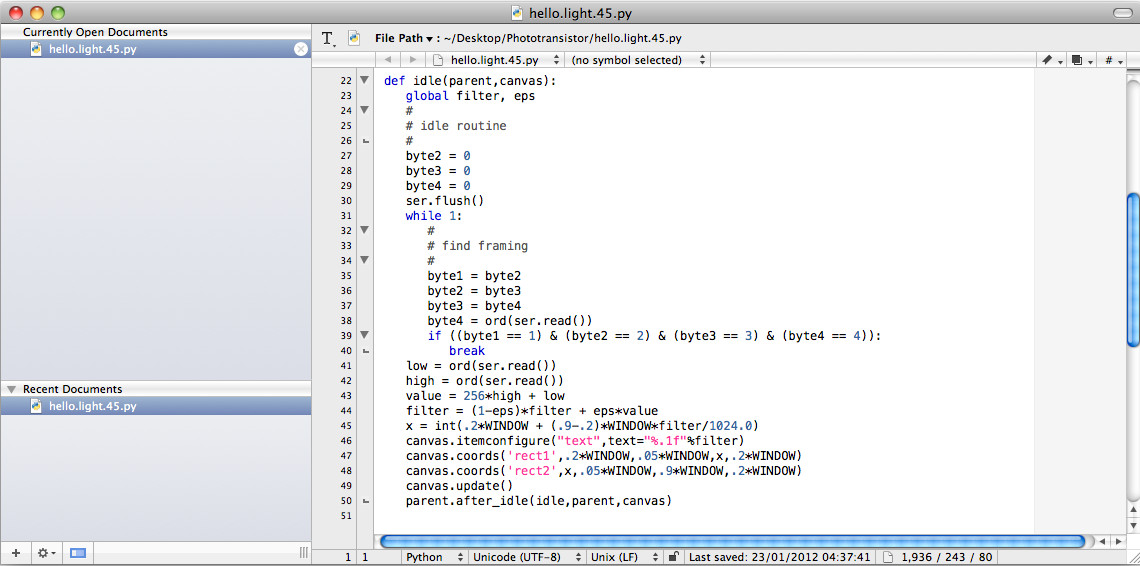
|
These routines relate to the processing of the data coming directly
from the attiny45 chip. The data received from the chip is in the
form of 8 bit bytes that are sent with a low and a high data set which
are then formed into a 16bit equivalent of a 10bit number by
multiplying the high part by 256 and adding it to the low bit
value. Note this 256 value is the arbitary value for 8bit
processors - this value will change depending on the amount of bytes
being delievered from the chip.
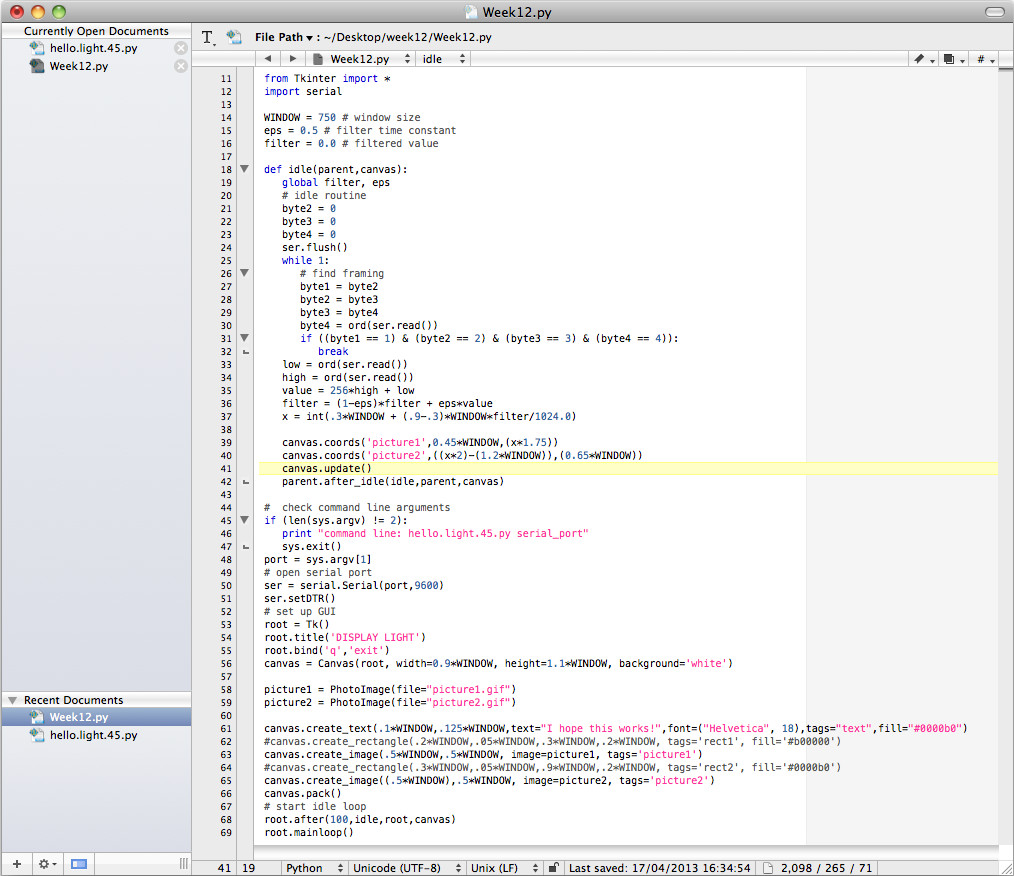
After understanding the processes involved I began altering the interface using the combination of Tkinter
and Python to create alter the example already provided by attempting
to insert pictures into the interface. A handy page for the
necessary commands using the Tkinter widget within Python is found here.
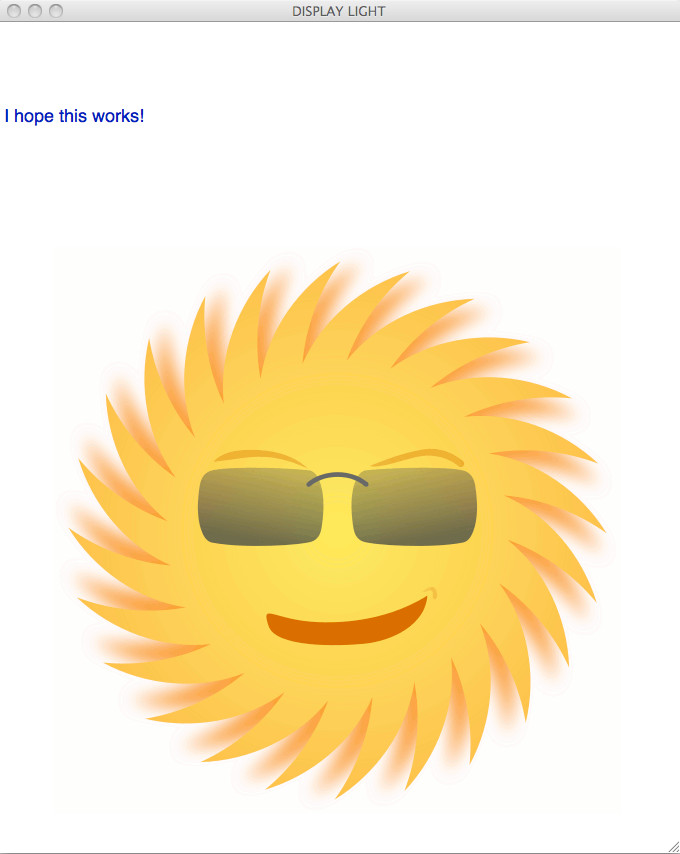
I developed the code using the commands for the widget and picked to
simple pictures from the internet to display the the extremes of the
values (i.e.light & dark). This process was fairly time
consuming and needed some fine tuning to allow for a smooth transistion
for the coordinate values between light and dark, which will depend on
the size of the picture you are using. The code I developed from
the hello.light.45.py is shown below.
|
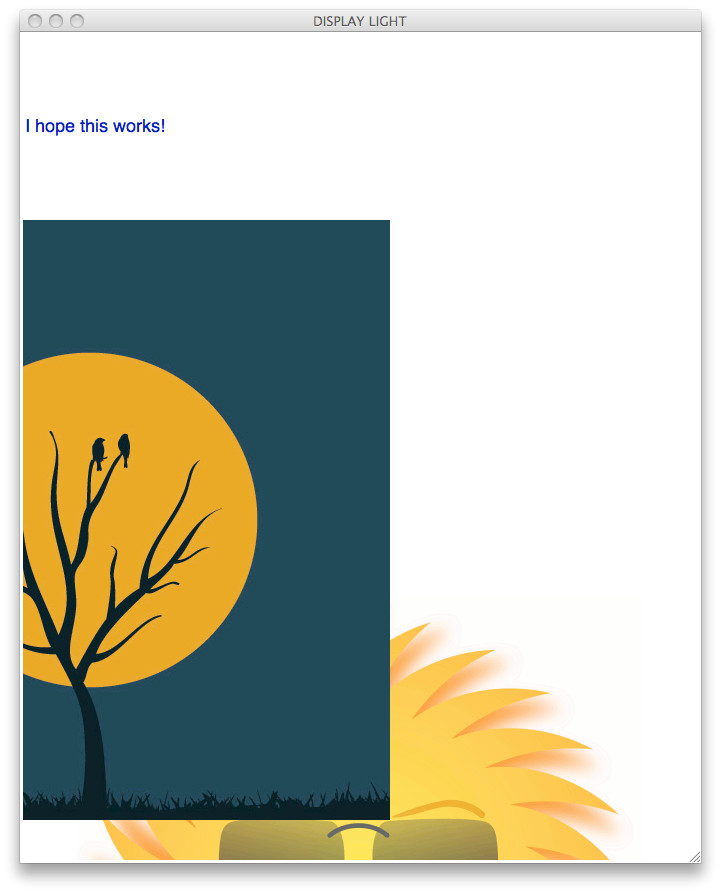
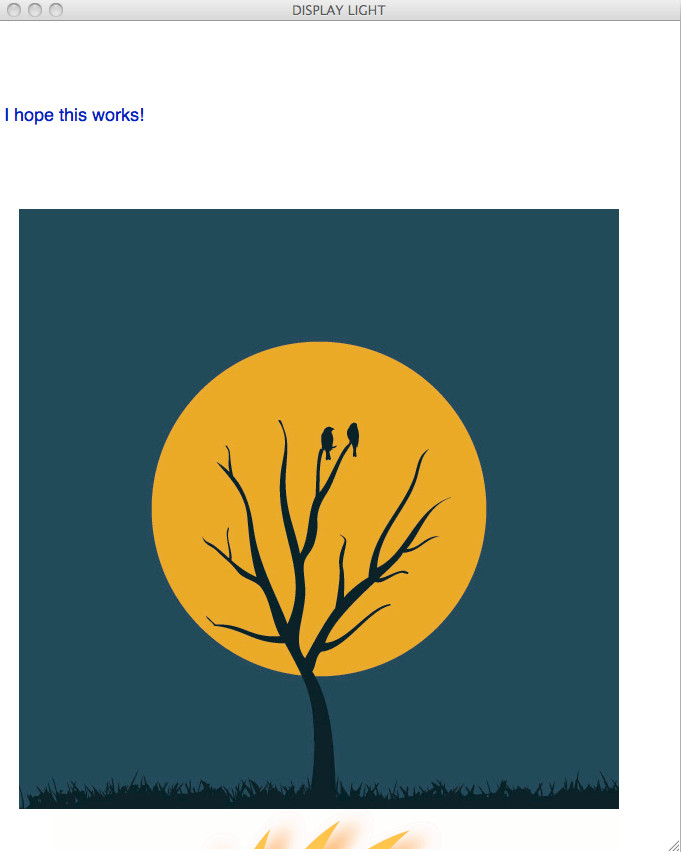
Here is three snapshots of the graphical representations at three different light levels, showing light to dark respectively.
Using Matplotlib:
With
a view of what I might do in my final project I decided to see if I
could get a realtime graphical update for the data coming from the
input sensor serial port against time in a x and y graph. To do
this I began by downloading Matplotlib,
an ensuring it was tethered to the correct version of Python by
constructing an example graph. At present I am having difficulty
in trying to get the data into the correct format for plotting on a
graph format, after reviewing the necessary processes needed to extract
the correct data from the chip (i.e. the transformation formula
above), I am fairly confident that I should be able to develop a
rudimentary system for displaying real time data, that could be
potentially implemented in my final project.
|