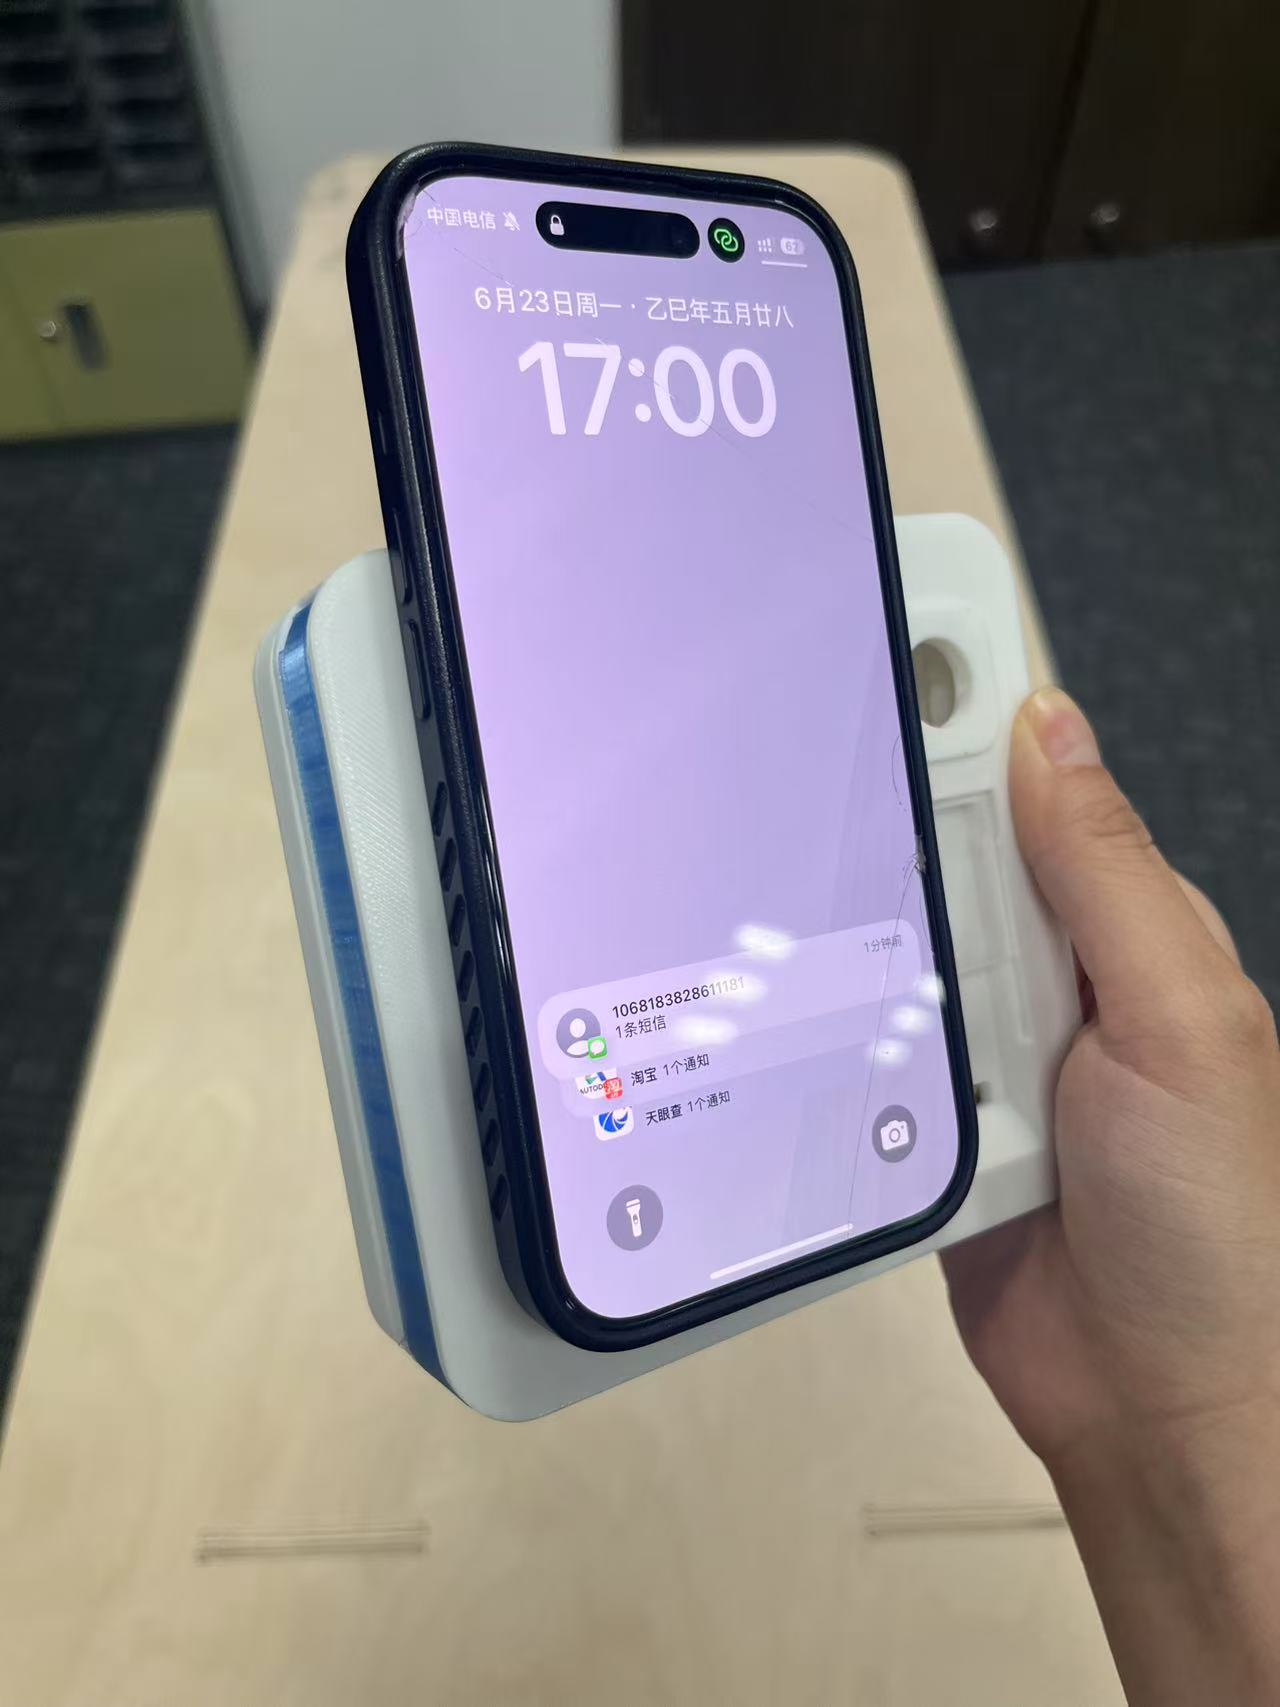
Appearance
Week 16 - System Integration
Assignment
- Design and document the system integration for your final project
Project development Gantt chart
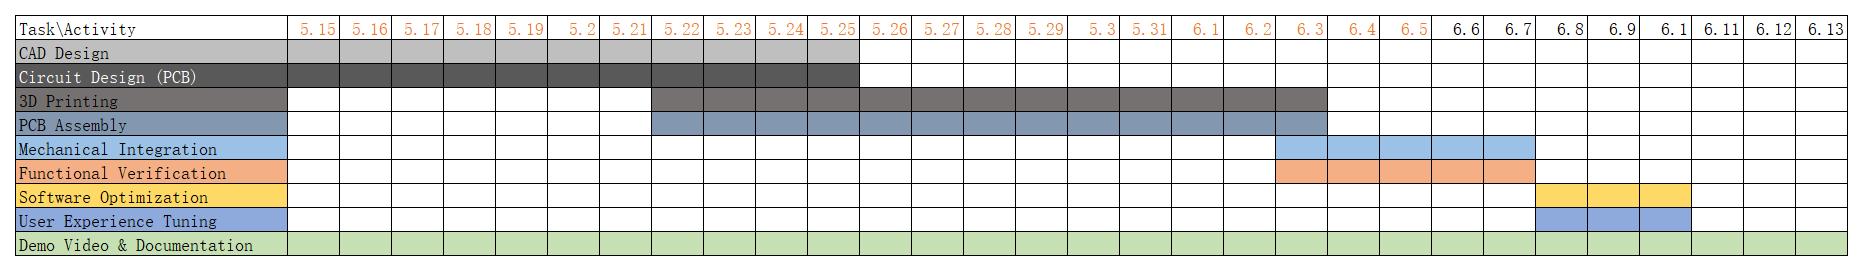
This Gantt chart outlines the project management timeline for the driver stress and mood monitoring device. It illustrates task progress across key phases, from CAD design and circuit development to 3D printing, PCB assembly, mechanical integration, functional verification, software tuning, and user experience optimization. The timeline highlights each task's duration, providing a clear visual roadmap to guide the development process from start to final validation and media production.
Project Tasks and Timeline Overview
The development of this driver stress and mood detection system is divided into two main stages, each focusing on different sensing strategies and hardware integration. Stage 1 centers on visual emotion recognition using a camera module, while Stage 2 expands the system's capability by incorporating a sodium ion biosensor for stress assessment and cross-verification. The system outputs include LED light feedback and an IoT-connected mobile interface for takeover strategy suggestions.
Stage 1: Visual Emotion Detection and System Framework (May 15 – June 5)
Step 1: Design & Preparation (May 15 – 21)
CAD Design: Designing sensor housings and the overall form factor using Fusion 360.
Circuit Design (PCB): Designing and simulating PCB layouts to support camera-based mood sensing and LED output indicators.
Step 2: Fabrication (May 22 – 25)
3D Printing: Printing PLA enclosures for housing the camera module, LEDs, and magnetic mounting hardware.
PCB Assembly: Soldering ESP32S3 breakout boards and verifying Wi-Fi data communication between modules.
Step 3: Assembly & Alpha Testing (May 26 – June 5)
Mechanical Integration: Magnetically assembling the device for easy mounting to the car’s air vent and aligning camera placement.
Functional Verification: Testing facial emotion detection, LED mood response, and Wi-Fi latency for transmitting takeover readiness alerts to mobile UI.
Stage 2: Biosensor Integration and Data Cross-Validation (June 5 – June 13)
Step 4: Biosensing & Sensor Calibration (June 3 – 7)
Sodium Ion Sensor Setup: Integrating a solid-state Na⁺ sensor for saliva-based stress monitoring.
Sensor Fusion: Cross-validating biosensor readings with camera-detected facial data to ensure reliable driver state estimation.
Step 5: Refinement & UX Optimization (June 7 – 10)
Software Enhancement: Refining facial recognition logic and implementing data fusion algorithms on the ESP32.
User Interface Tuning: Enhancing the output screen UI and mobile feedback interface to reflect stress severity and takeover recommendations.
Step 6: Final Validation & Media Production (June 10 – 13)
System Validation: Full-system testing with real inputs to simulate takeover conditions and evaluate output responses.
Demo & Documentation: Producing a short video demonstration and compiling final technical documentation for submission.
Motivation
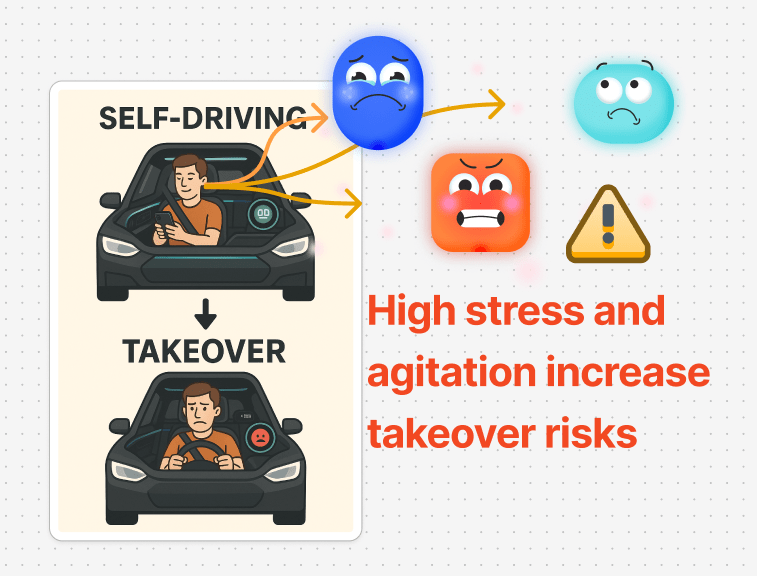
Modern vehicles are equipped with advanced autonomy and driver assistance, yet human physiological and emotional states remain critical to safe driving. This system integrates biometric data—including stress levels and mood —to dynamically assess the driver’s readiness for takeover. When elevated stress is detected, the system issues alerts like "High stress detected: relax and prepare for vehicle handover," or delays manual control to ensure the driver is calm before takeover. Integrating physiological awareness into driver monitoring not only improves takeover timing but also helps protect drivers from making unsafe decisions during critical handovers.
Idea Sketch
A smart stress and mood detection device for autonomous vehicles that uploads data to the cloud and provides real-time feedback to support safer driver takeovers. It continuously monitors emotional and physiological signals to predict driver readiness and guide smooth transitions from autonomous to manual control.
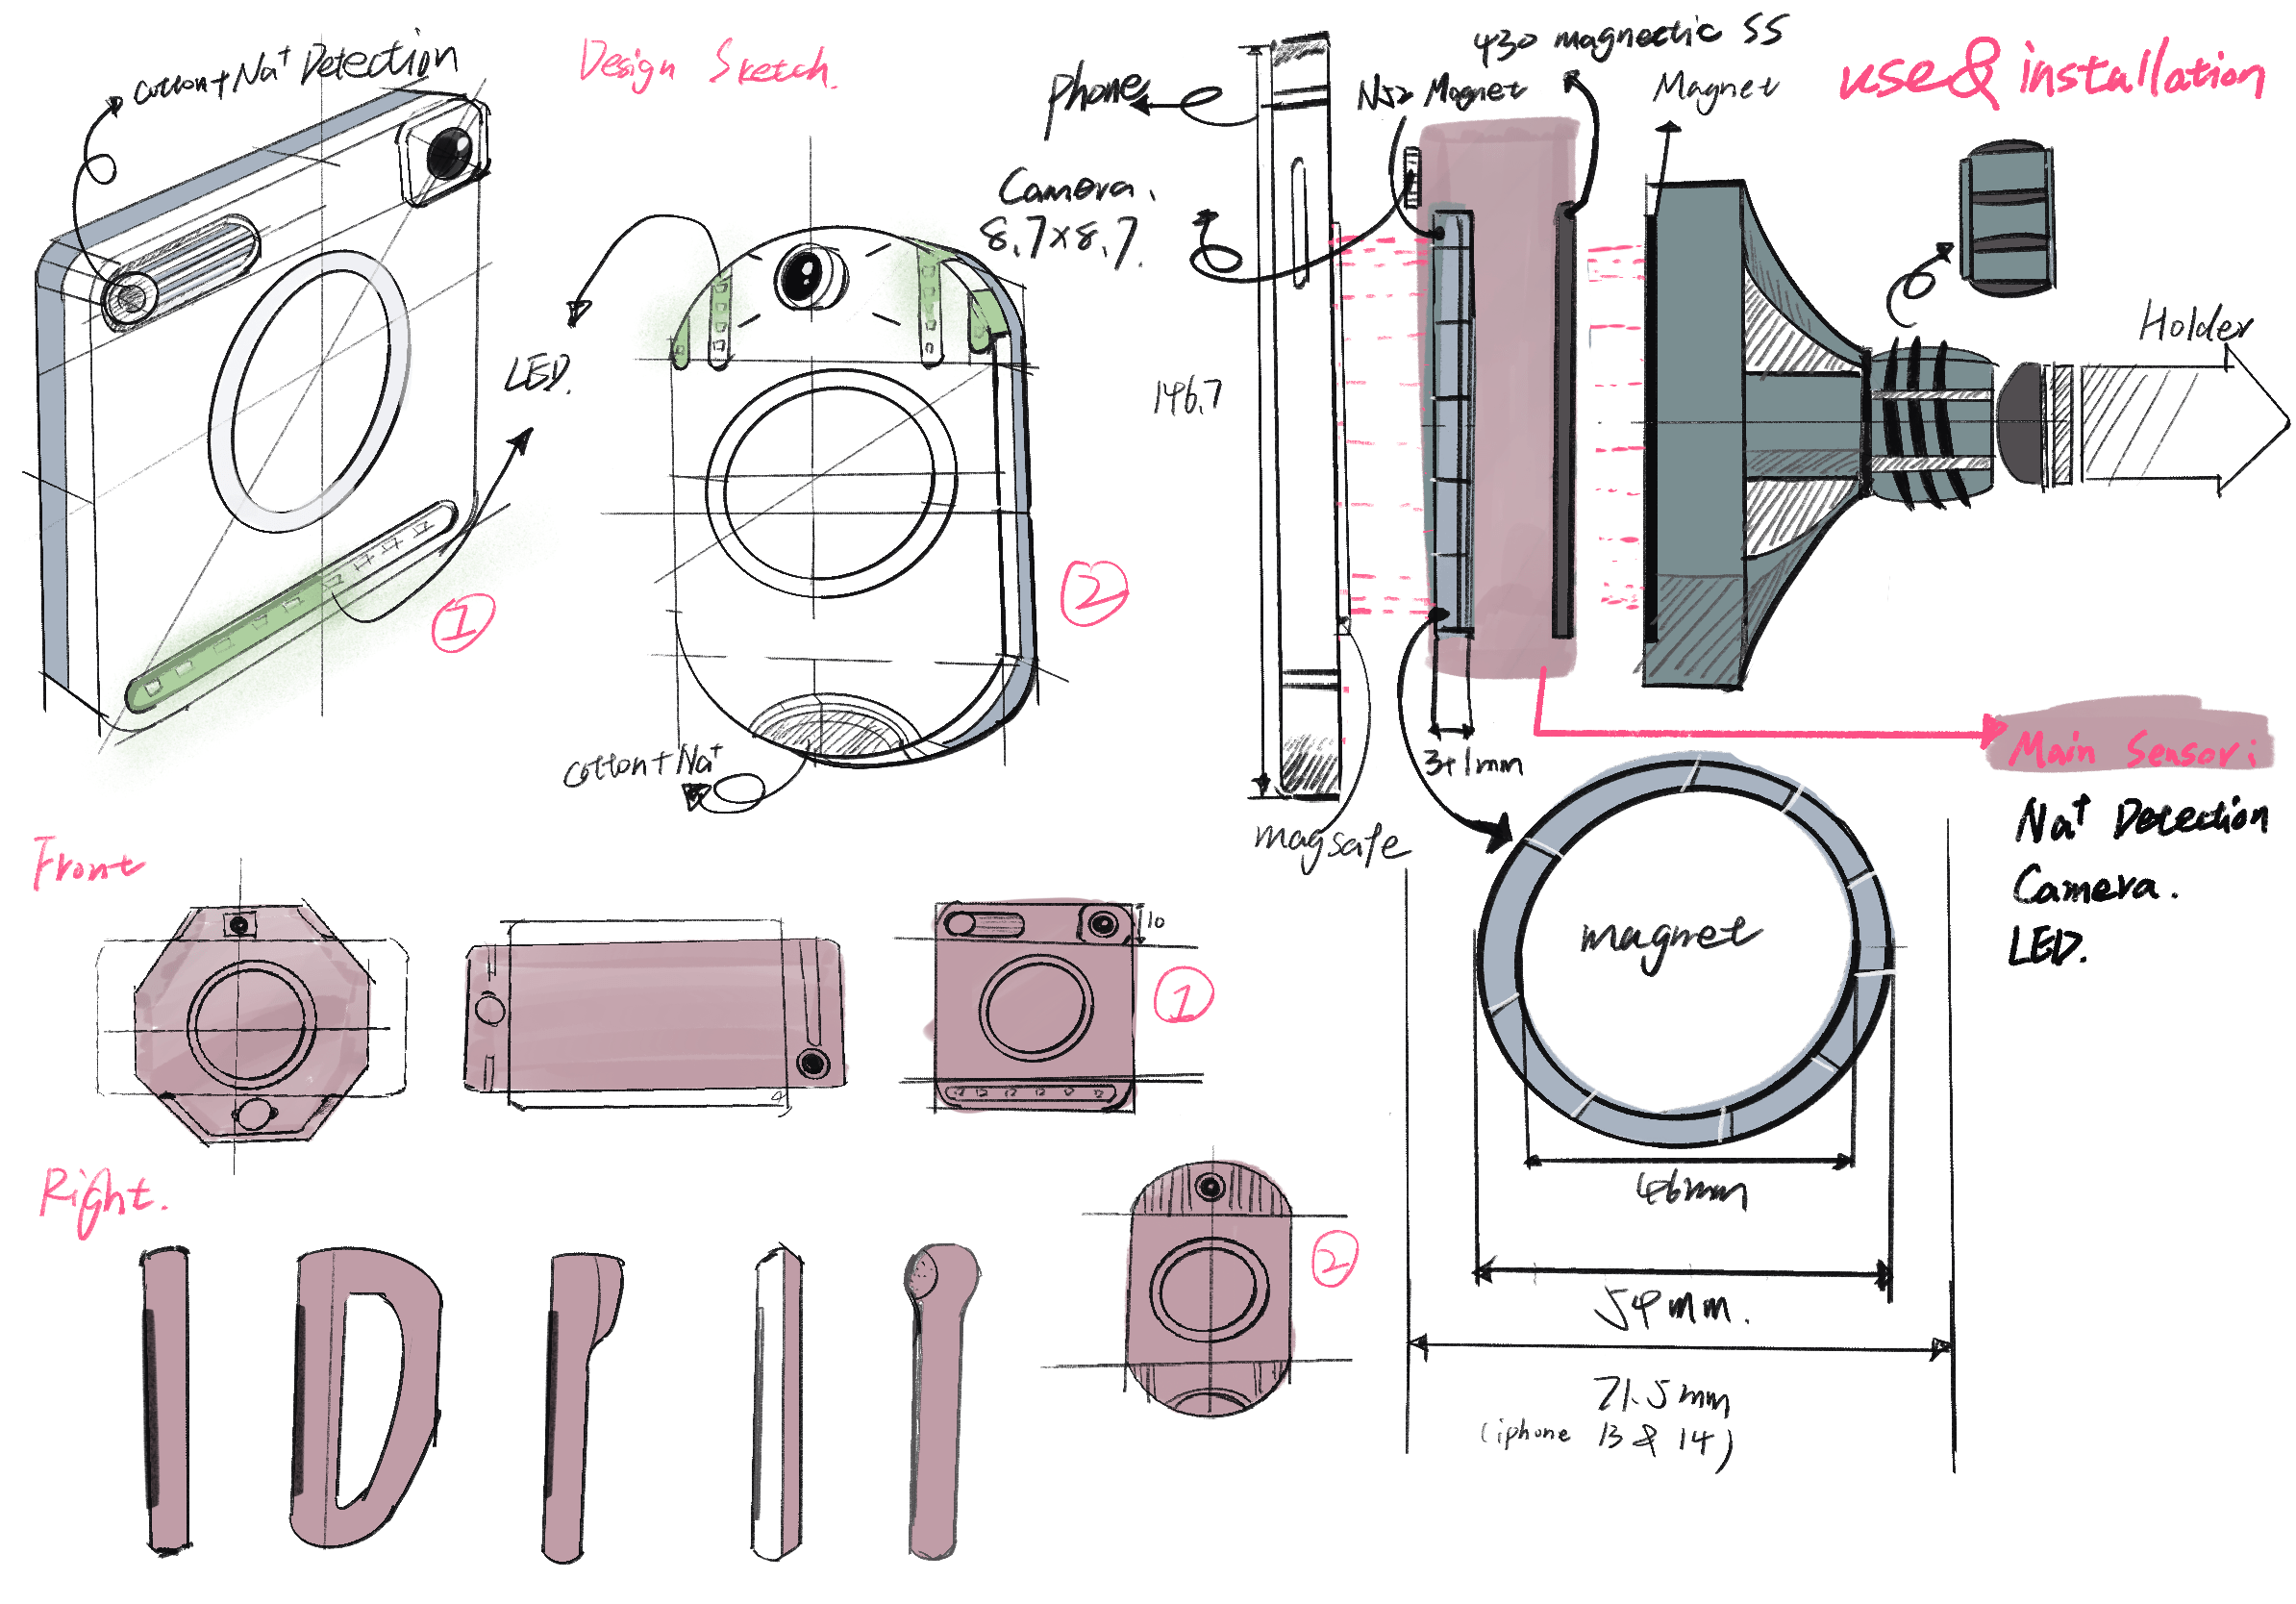
Design Sketch Overview:
Right Side: Shows the modular structure—air vent holder, magnetic sensor module, and smartphone—which attach magnetically for flexible use both mounted and handheld.
Left Side: Displays early concept sketches exploring ergonomic design and integrated functionality.
System Integration Summary
This section outlines how all hardware, electronics, sensors, and software modules were physically and functionally integrated into a compact, working prototype. While detailed processes (e.g. PCB design, programming, CAD) are linked in the respective pages, this summary ensures that the overall system assembly is clearly demonstrated here.
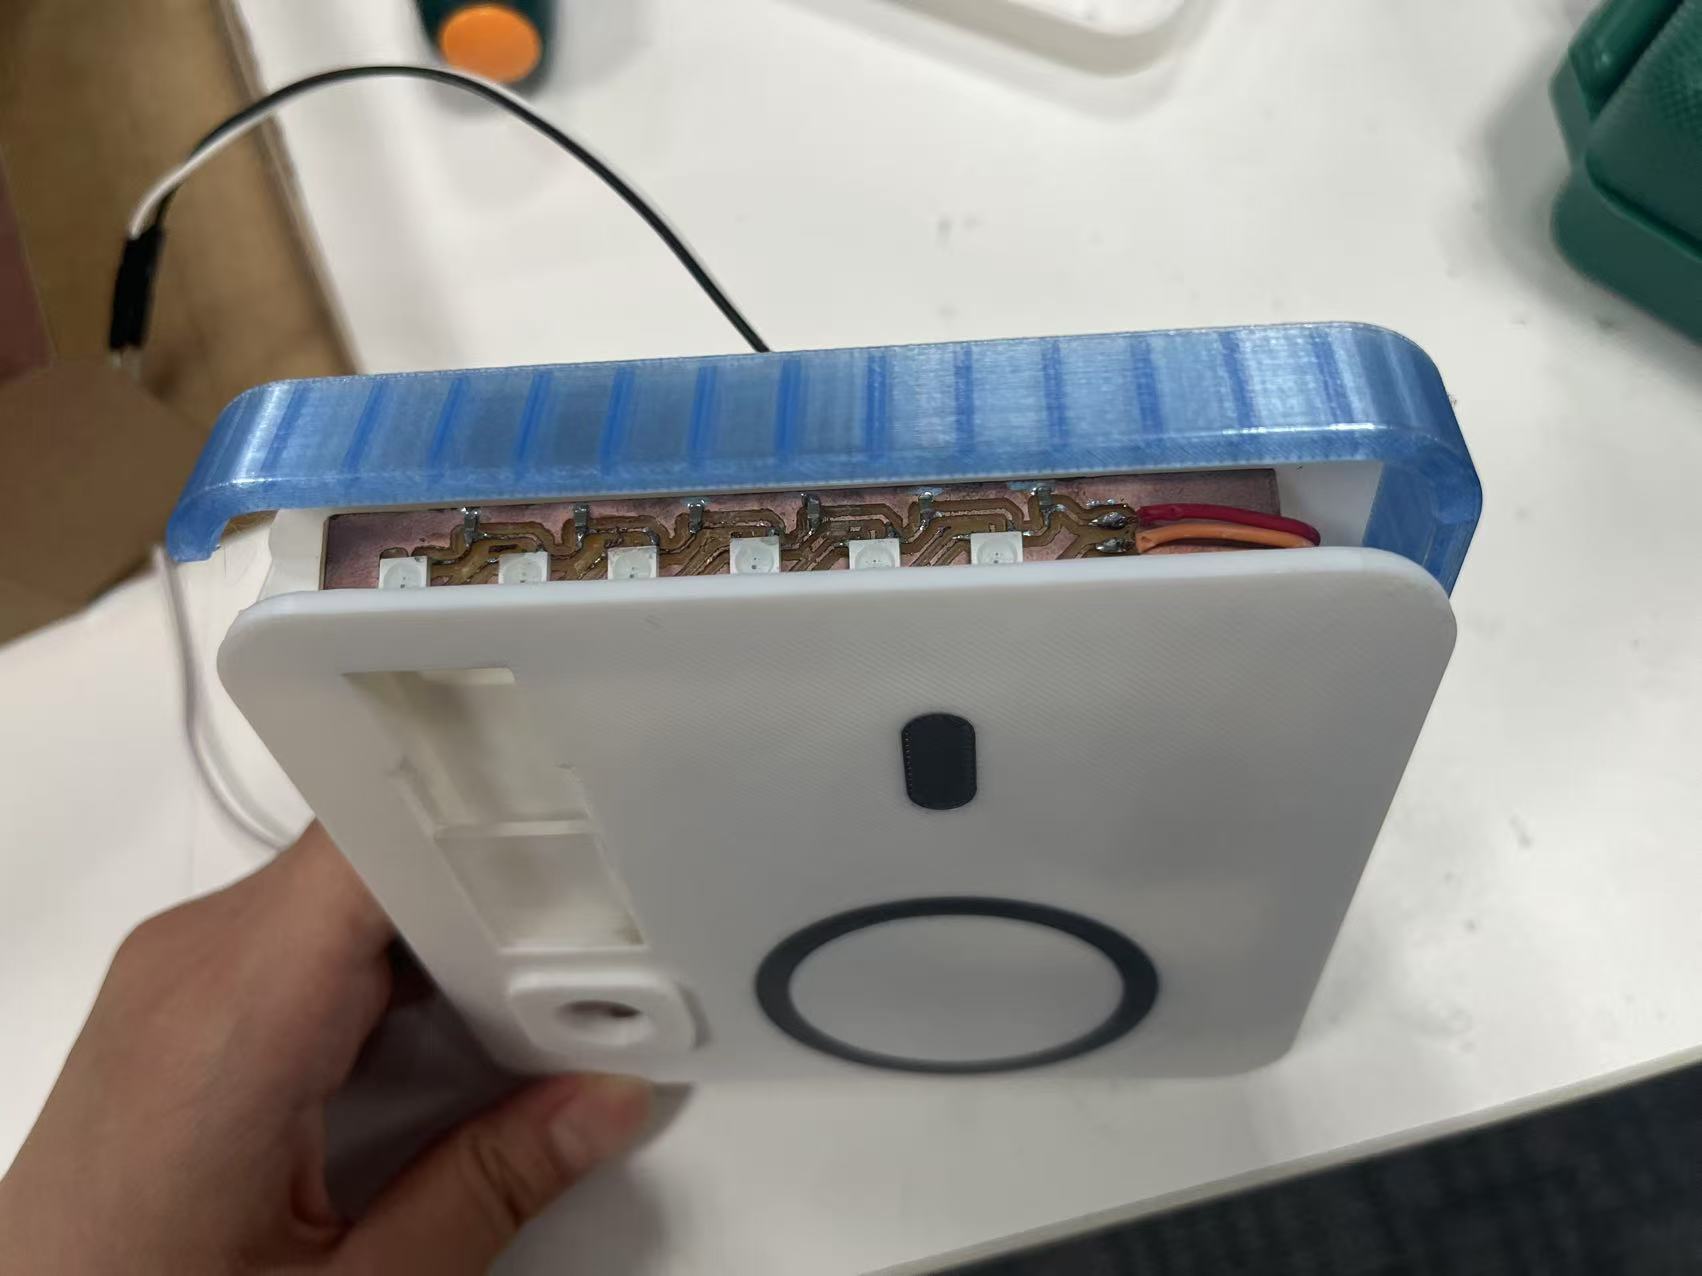
Physical Assembly & Packaging
All sensor modules and the main control PCB were enclosed in a compact, FDM-printed PLA shell, designed in Fusion 360.
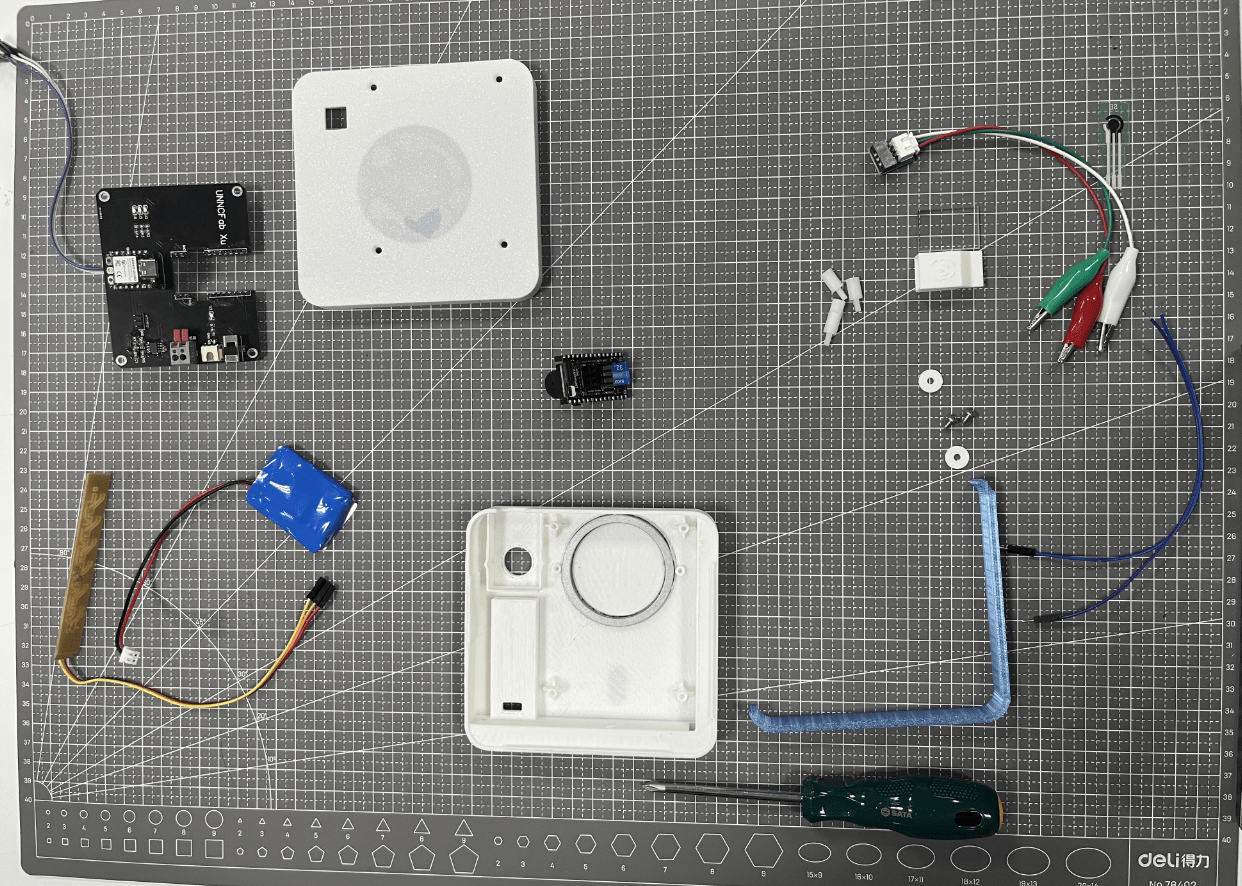
Magnetic components allowed the enclosure to dock on a vehicle air vent or attach behind a smartphone for handheld use.
LED light rings and electrodes were routed via hidden cable channels for minimal clutter and safe wiring.
Wiring & Interconnection
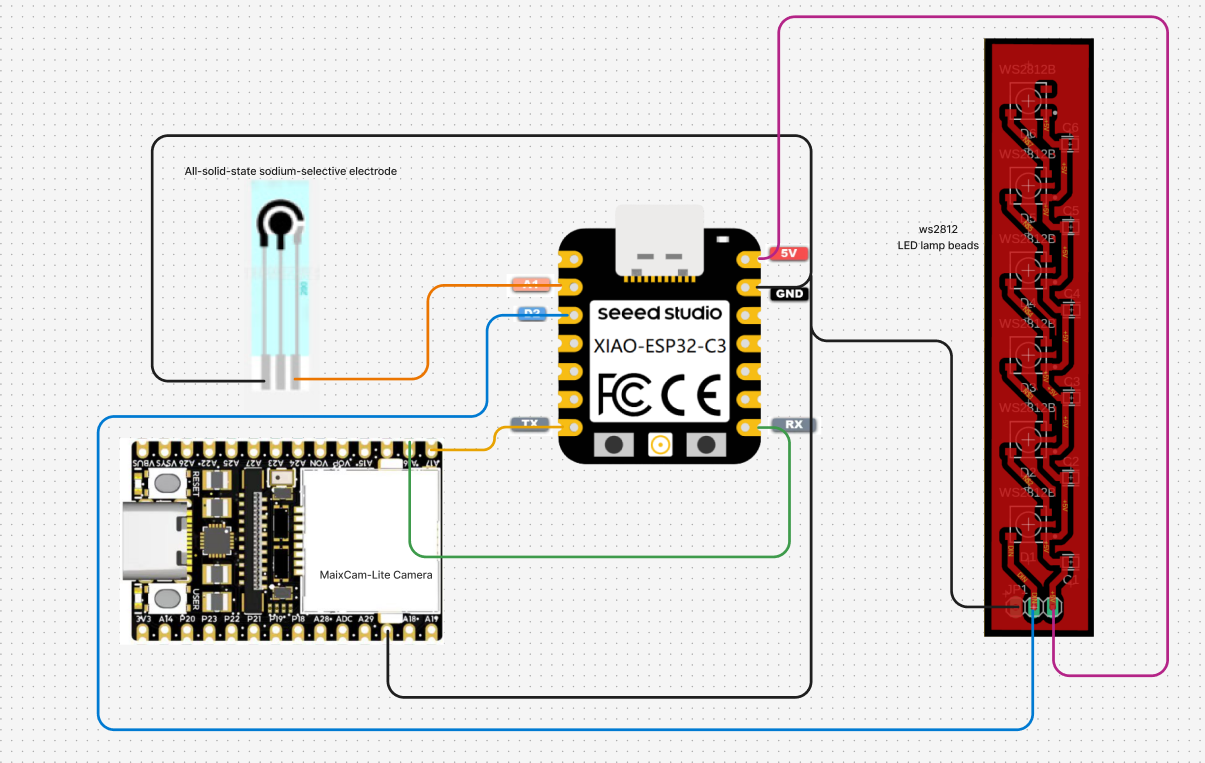
The XIAO ESP32C3 board interfaces directly with:
A solid-state sodium ion biosensor (via ADC)
A camera module (via UART)
RGB LED strip (via digital IO)
All components are powered via regulated 5V lines on the custom PCB.
Dataflow and Subsystem Interaction
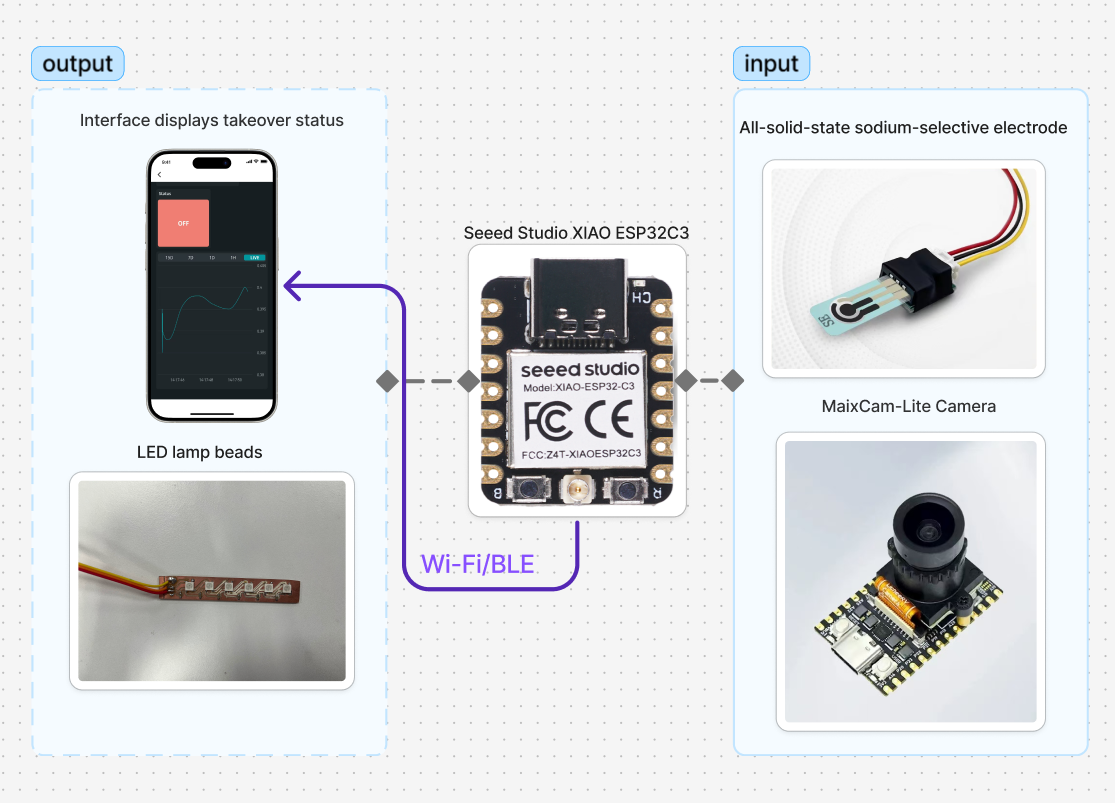 1.Input: The system receives two types of data:
- Analog: Sodium concentration from the salivary biosensor (stress indicator)
- Digital: Facial expression classification from the ESP32 camera (emotion indicator)
2.Processing:
- A real-time embedded algorithm fuses stress and emotion data.
- The combined data is compared against thresholds to assess “takeover readiness”.
3.Output:
- Visual: An LED ring shows green/red cues based on emotional state.
- Cloud: Processed values are uploaded to an Arduino Cloud dashboard, where a mobile app displays the current emotion and safe-to-takeover status.
Final System Integration Tests
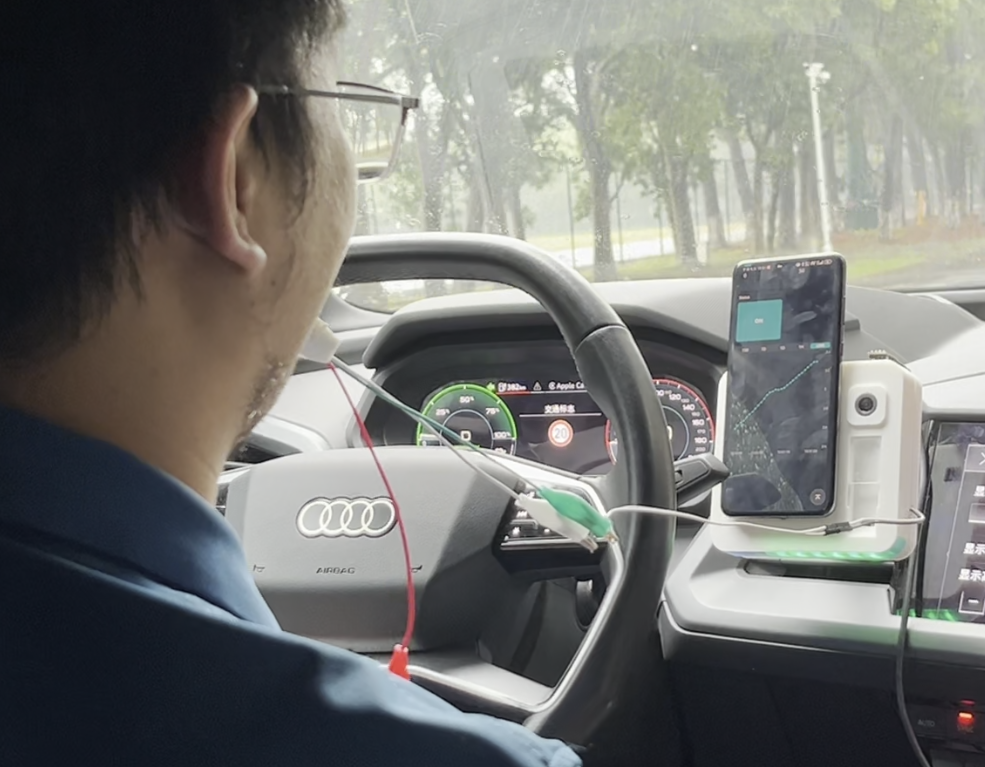
The system was mounted and tested in:
- A driving simulator setup
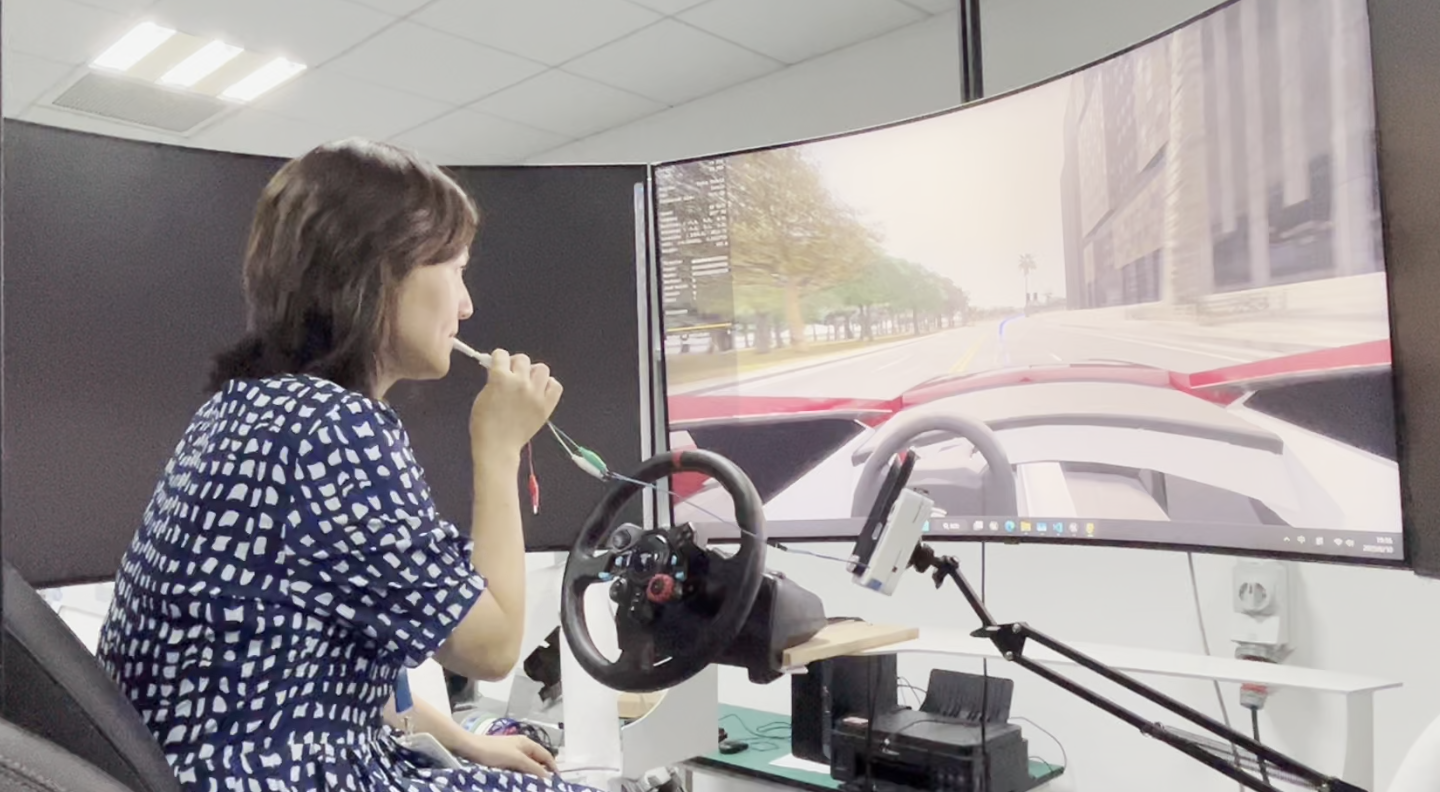
- A real car interior, attached to the air vent
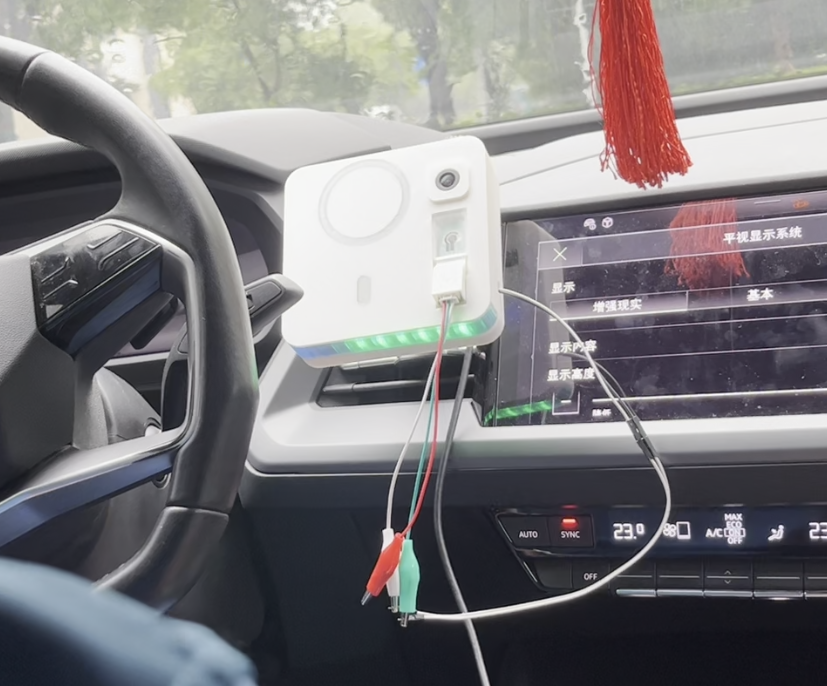
- All functions—sensor readings, LED feedback, mobile interface updates—were successfully demonstrated in real-time
- The prototype maintains low latency, intuitive UX, and strong modularity
System Integration Process Navigation
This is a record of the project production process, covering the complete process from design, processing, programming to testing. Click on any item below to jump to the corresponding detailed page:
Table of Contents
| Section | Description |
|---|---|
| Concept | Motivation, Idea sketch, and system summary |
| Design | CAD, electronics, and code architecture |
| Manufacture | How physical and electronic components were made |
| Assemble & test | Final integration steps of all subsystems |
| Results | Slide and Video |
Material BOM List
| Name | Quantity | Unit Cost (CNY) | Total Cost (CNY) | Vendor |
|---|---|---|---|---|
| Vehicle-mounted magnetic bracket | 1 | 14.70 | 14.70 | Taobao |
| 430 magnetic conductive stainless steel plate | 2 | 2.94 | 5.88 | Taobao |
| MagSafe transmitter magnet | 1 | 12.00 | 12.00 | Taobao |
| 32GB memory card | 1 | 25.90 | 25.90 | Taobao |
| 3M adhesive magnetic patch | 1 | 3.50 | 3.50 | Taobao |
| MAIXCAM camera module | 1 | 244.00 | 244.00 | Taobao |
| XIAO ESP32C3 | 1 | 50.00 | 50.00 | Taobao |
| PLA filament (for 3D printing) | 2 rolls | 60.00 | 120.00 | Taobao |
| JLCPCB fabrication cost | 1 order | 5.00 | 5.00 | JLCPCB |
| Screen-printed carbon electrode | 10 | 30.00 | 300.00 | Taobao |
| Sodium ion-selective membrane solution | 1 | 100.00 | 100.00 | Taobao |
| Lithium battery (3.7V 1000mAh) | 1 | 18.00 | 18.00 | Taobao |
| Jumper wires (DuPont cable, 40pcs) | 1 set | 5.00 | 5.00 | Taobao |
| Resistors and capacitors (assorted pack) | 1 pack (100 pcs) | 6.00 | 6.00 | Taobao |
| WS2812B RGB LED (8-LED ring/module) | 1 | 9.00 | 9.00 | Taobao |
Total Cost : 918.98 CNY