
Assignment#14: Interface and Application Programming
This assignment is about documenting what I learned in the week of Interface and Application Programming. I always wanted to develop apps but I was not able to. However, with this assignment, I first started learning different platforms and programming languages to develop project specific applications. Since I am working on IoT based onion storage system using temperature and humidity control mechanism, I thought of developing my app that would gather sensor data (temperature and humidity) of two of the DS18B20 sensors that I am going to use in my project. I have documented how I developed my applicaiton and how it is collecting and publishing data on the UI. This week, I worked on two different application development tools. I have used MIT app inventor and Google firebase for one application and Processing to visually display temperature readings in second application. I am also documenting what went well, what went wrong, how I would do things differently in next assignment and my learning outcomes.
My Hero shots for this week
1. Collecting DS18B20 Temperature sensor data on application.
 |
 |
.jpg) |
 |
2. Displaying DS18B20 Temperature sensor data on Processing.
 |
My Hero videos for this week
1. Collecting DS18B20 Temperature sensor data on application.
2. Collecting Temperature sensor and MQ2 gas data on application.
3. Displaying DS18B20 Temperature sensor data on Processing.
Click here to go back to the top
Group Assignment Brief
This assignment is about documenting what we learned in Interface and Application Programming week that includes understanding different tools for developing applications and interface programming. We also learned how to use these tools, their features and and their purposes.
Objectives of the Group Assignment:
- Compare as many tool options as possible
For the purpose of this group assignment, we learned different application tools like MIT app Inventor, Processing, etc. We have explained brief about each of these tools and how did we use them.
1. Processing:
Processing is the language; with the help of this, we can learn to code with visual arts. Processing is helpful for students, artists, designers, researchers, and hobbyists who use Processing for learning and prototyping. Processing is the programming language for learning how to code in the context of the visual arts and visual literacy within technology. Processing is a free graphical library and integrated development environment (IDE) that facilitates computer programming in a visual setting for learners with limited programming knowledge. Processing employs the Java programming language; we can add classes, mathematical function operations, etc. It also includes a graphical user interface to help with the compilation and execution stages. Click here to go to the Processing Website.
The graphical user interface of the Processing IDE is just like the Arduino IDE. We downloaded Processing software from the Download section on the Processing website.
Features of Processing:
- Processing includes a sketchbook, a minimal alternative to an integrated development environment (IDE) for organizing projects.
- Every Processing sketch is actually a subclass of the PApplet Java class (formerly a subclass of Java's built-in Applet) which implements most of the Processing language's features.
- When programming in Processing, all additional classes defined will be treated as inner classes when the code is translated into pure Java before compiling.
- Processing also allows for users to create their own classes within the PApplet sketch.
- Interactive programs with 2D, 3D, PDF, or SVG output
Credits and Reference: Click here.
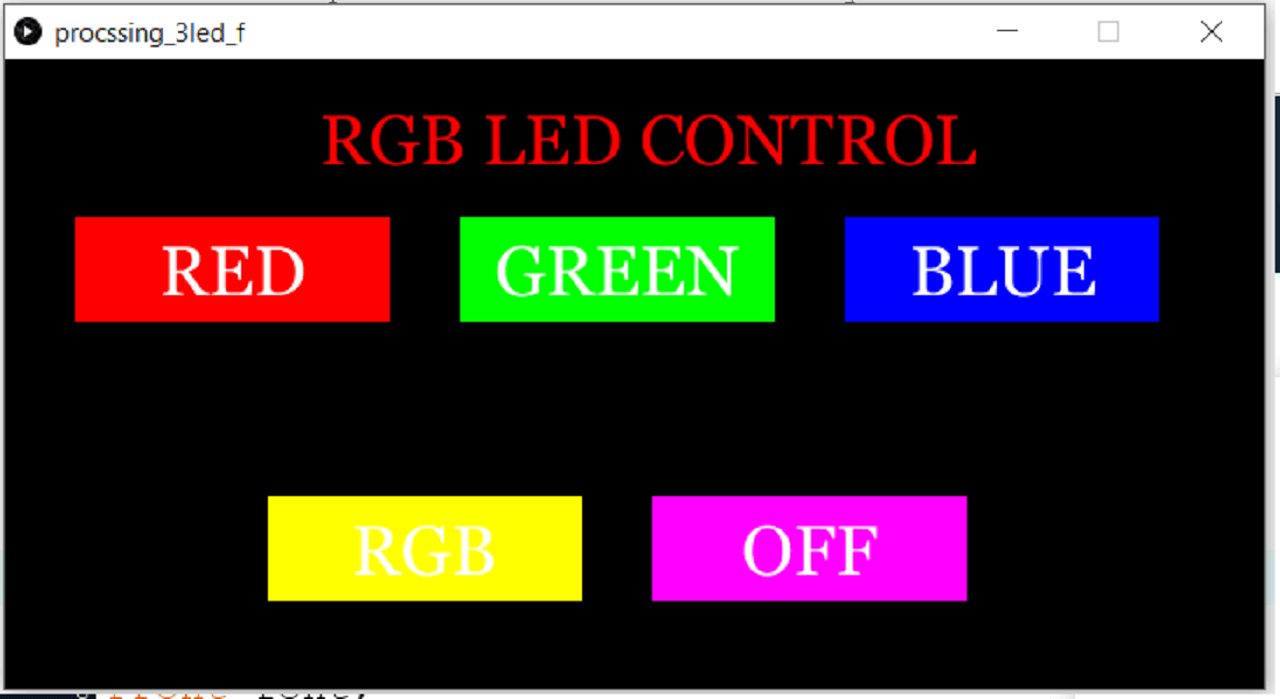
1a. Using Processing for controlling RGB LED ON/OFF:
For this assignment, we have developed an application that consists of 5 buttons, three for individual LEDs, one for ON all LEDs at the time, and one for off all lEDs as shown below.
 |
1b. Using Processing to develop Temperature Monitor GUI:
We also have developed an application to graphically display the Temperature monitor for one of our projects using DS18B20 sensor as shown below.
|
2. MIT App Inventor:
MIT App Inventor is a block-based programming tool through, which one can create fully functional apps for Android devices such as smartphones, tables, etc. It was originally provided by Google, and now maintained by the Massachusetts Institute of Technology (MIT). MIT App Inventor is an open source software, which can be easily used by everyone as it is a simple tool for beginner for making their first application. Go to MIT app inventor website by clicking here.
The graphical user interface of the Processing IDE is just like the Arduino IDE. We downloaded Processing software from the Download section on the Processing website.
Features of MIT App inventor:
- MIT App Inventor is an open source software.
- We can create more than one project in MIT App Inventor and can make changes in it whenever required.
- In MIT App Inventor, we have to write a code by connecting the blocks as it has block level programming.
- We can generate QR code of our project and scan it using MIT AI companion app to open our application on any android device. We can also download .apk file and install on that android device instead of scanning through AI companion app everytime.
Collecting DS18B20 Temperature sensor data on application developed through MIT app inventor and Google Firebase.
|
Click here to read more about our Group Assignment.
Click here to go back to the top
Individual Assignment
Objectives of Individual Assignment:
- Write an application that interfaces a user with an input &/or output device that you made.
1. Application development through MIT app inventor and Google Firebase:
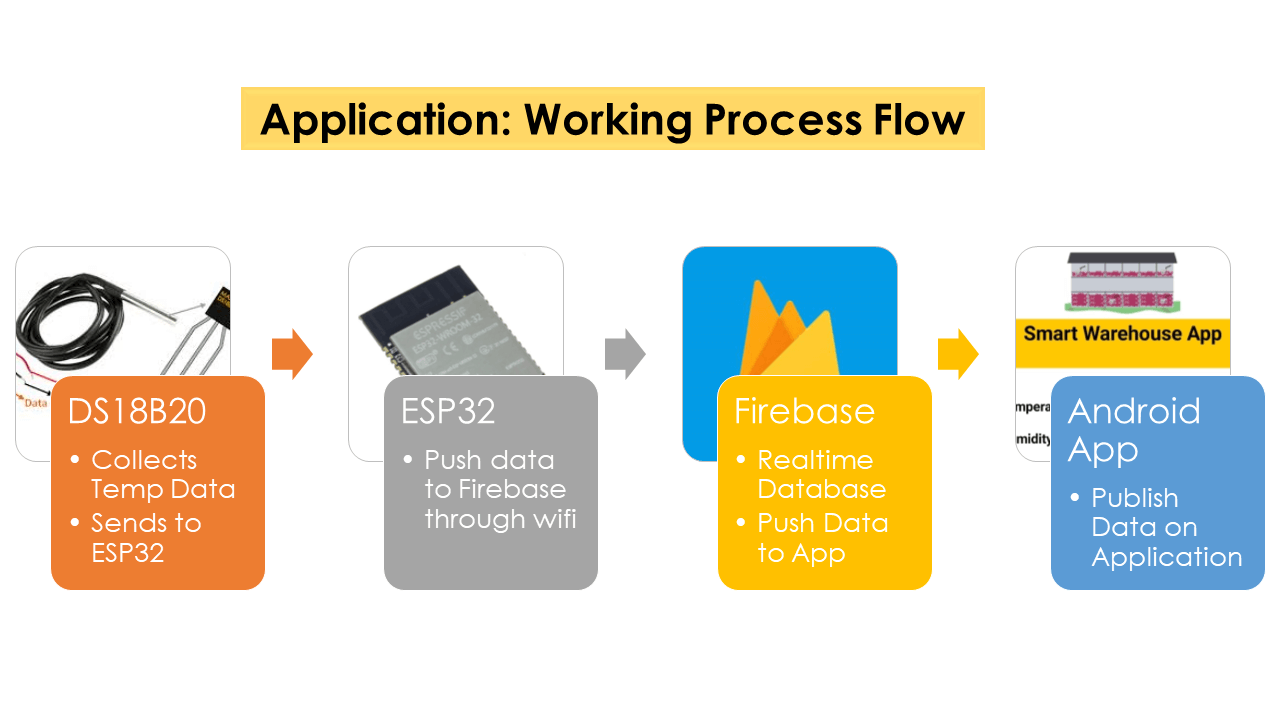
As a first outcome for this assignment, I have developed android app using MIT app inventor. To do this, I am sending sensor data to the Android app through Google Firebase using Arduino IDE. The application displays sensor readings on our smartphone. The sensor readings could be accessed anywhere and anytime conveniently. I have used Arduino IDE to program my project board (ESP32- Wroom), which is be connected to multiple DS18B20 sensors. The sensor readings are sent to the Google Firebase database, which will push the sensor readings in real-time through my app which that I built using MIT App Inventor.
Following is a work process flow of the application:
 |
1. Setting up Google Firebase:
Go to https://firebase.google.com. Click 'Go to Console' as highlighted in the red rectangular box top right.
.png) |
It will take you to a new page with the welcome message. Click the button 'Create a Project' as shown below.
.png) |
The following page will open up. Step#1: Write name of your project. Remember to tick the Firebase term agreement. Now click 'Continue'.
.png) |
Step#2: Enable 'Google analytics for this project'. Click 'Continue' to proceed further.
.png) |
Step#3: Select your country, tick the required boxes click and then 'Create Project'.
.png) |
After a few moments, your project will be created. Click 'Continue'.
.png) |
2. Obtaining Firebase authorization key and Firebase host:
Your newly created project will now open. Go to the settings icon and click 'Project Settings'.
.png) |
Step#4: Now, go to 'Service Accounts' and inside it, go to 'Database secrets'. Then, click 'Generate new private key'.
.png) |
Step#5: Read the warning message popped up on the screen. Then, click 'Generate key' button as shown.
.png) |
The text file with the 'key' generated has been downloaded in your computer as shown in the bottom left part of the picture below.
.png) |
Then go to 'Database secrets' again, you will be able to view a secret key associated with your project. This is the unique authorization key that you will save and use later on in the program code. Keep this key as a secret and do not share it with anyone or your project security will be compromised.
.png) |
Step#6: Next, go to 'Realtime Database' under the 'Build' tab. Then click 'Create Database' as shown below.
.png) |
Select location of the database for your project.
.png) |
Next, check 'Start in Lock mode' and then click the 'Enable' button. Your database settings are now completed.
.png) |
Copy your project's Firebase host link as shown below. Save it as well, this will act as your Google Firebase host, which will be incorporated in the program code.
.png) |
3. Setting up Arduino IDE:
Installing Google Firebase ESP32 Library:
To be able to use Google Firebase with my ESP32 board, I have installed Firebase library in my Arduino IDE. To download the library, click here. Click on 'Code' and then 'Download Zip'.
Inside Arduino IDE, go to Sketch > Include Library > Add .zip Library to add the library to the program.
.png) |
4. Arduino Sketch to Send Sensor Data to Google Firebase:
Click here to see/copy my project program after adding app portion to it or download sketch from the cloud screen below.
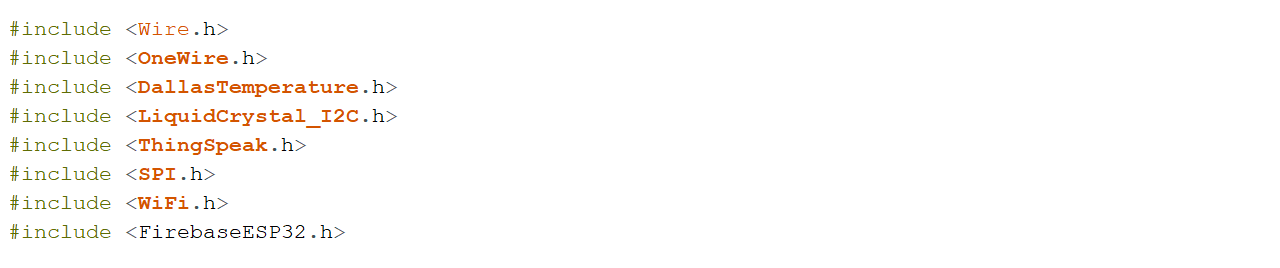
Code explaination:
I first included the necessary libraries at the beginning of the code, e.g. wire library for I2C device communication (LCD in my case), the OneWire and DallasTemperature for the DS18B20 temperature sensor, LiquidCrystal_I2C for I2C serial interface adapter used with 16x2 LCD screen, ThingSpeak library for communicating data to ThingSpeak cloud and wifi library for using wifi. I also have added Firebase library that I downloaded in the step above.
 |
Then, I declared a LiquidCrystal 12C object with 12C address, the number of columns, the number of rows (16 columns and 2 rows in my case)
 |
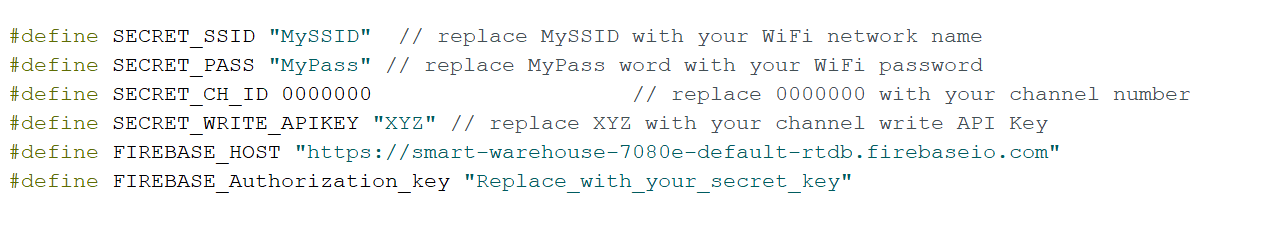
I defined SSID and password for my wifi network along with Channel ID and Secret Write API key for my ThingSpeak IoT channel. I have also added Firebase host and Firebase authorization key that I had saved in the step above for setting-up Google Firebase.
 |
After that, I created two char variable called char ssid[] and char pass[] to save the SSID and password.
 |
Through WiFiClient, I created a client that can connect to a specified internet IP address and port as defined in client. int keyIndex = 0; is network key Index number (needed only for WEP).
 |
I also created one unsigned long variables (extended size variables) for storing my Thingspeak Channel ID along with const char* to declare Write API key for my channel.
 |
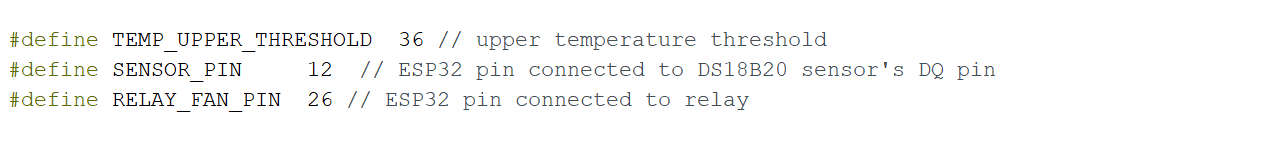
I defined upper threshold temperature for my project above, which the exhaust fans will be switched ON. I defined GPIO 12 for onewire bus for DS18B20 sensor and GPIO 26 for Relay pin.
 |
After defining the DS18B20 sensor pin I created objects OneWire and DallaTemperature to make it work.
 |
I then defined the FirebaseData object as 'firebaseData'. This will be used later on in the code to access the sensor readings.
 |
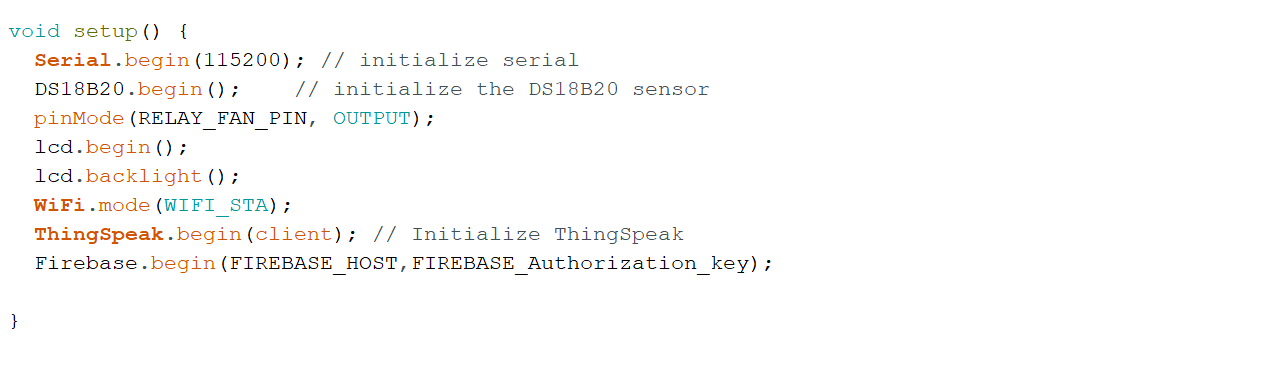
In the setup(), set the RelayPin as an output. Then, added lcd.begin() to initialize the interface to the LCD screen, DS18B20.begin() function to search for connected sensors on the bus and sets bit resolution (12 bits) for each one of them. Also added lcd.backlight() function to start the LCD backlight. WiFi.mode(WIFI_STA) sets up station mode for ESP32 to connect to an access poin. Lastly added ThingSpeak.begin(client) to initialize ThingSpeak.
Additionally for Firebase, I will connect my board with Google Firebase by using the Firebase.begin() function. It takes in two parameters. The first is the Firebase host and the second is the authorization key. I have defined both of them earlier on in the program code. Through correct credentials, a successful connection will be made.
 |
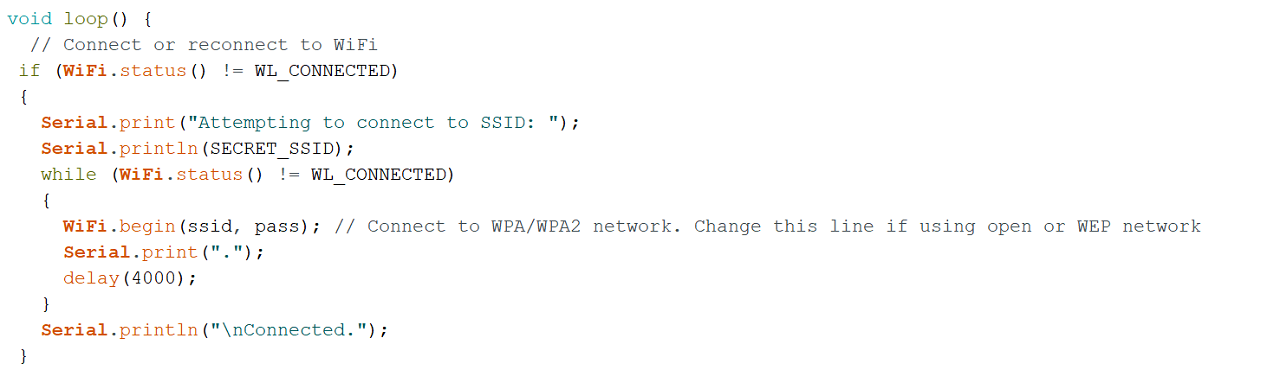
In the loop(), wifi connection is made. Connecting to a Wi-Fi network can take a while, so we usually add a while loop that keeps checking if the connection was already established by using WiFi.status(). When the connection is successfully established, it returns WL_CONNECTED. To get the status of the Wi-Fi connection, I used WiFi.status(). This returns WL_CONNECTED value, when it is connected to a WiFi network. I then used WiFi.begin() to connect to a network.
 |
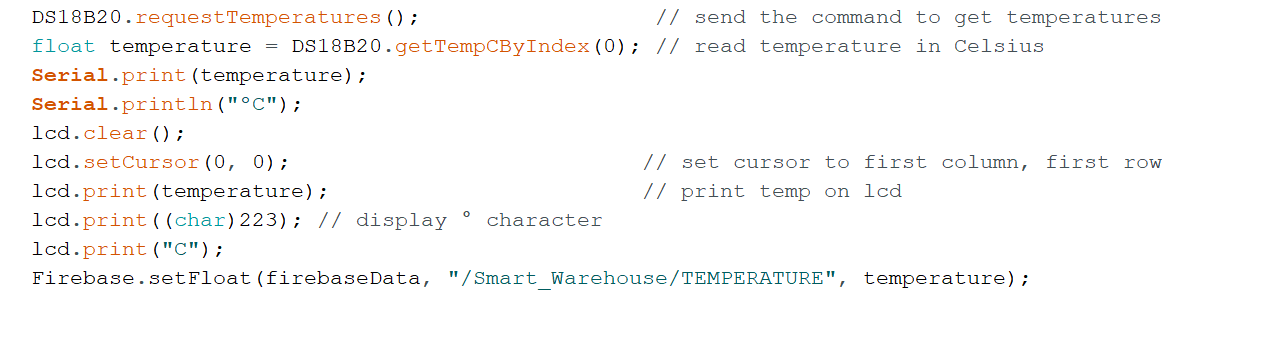
DS18B20.requestTemperatures() function is used to send command for all sensors on the bus to perform a temperature conversion. Defined 'temperature' as a float. DS18B20.getTempCByIndex(0) function reads and returns temperature reading from the sensor. deviceIndex is nothing but the location of the sensor on the bus. If you are using only one DS18B20 on the bus, set it to 0. The additional ones will be 1, 2, 3 and so on after the first one as 0.
Then, lcd.setCursor(0, 0) Move cursor to the desired position (column_index, row_index), (0, 0) in this case. lcd.print(temperature) prints Temperature value read by the sensor.
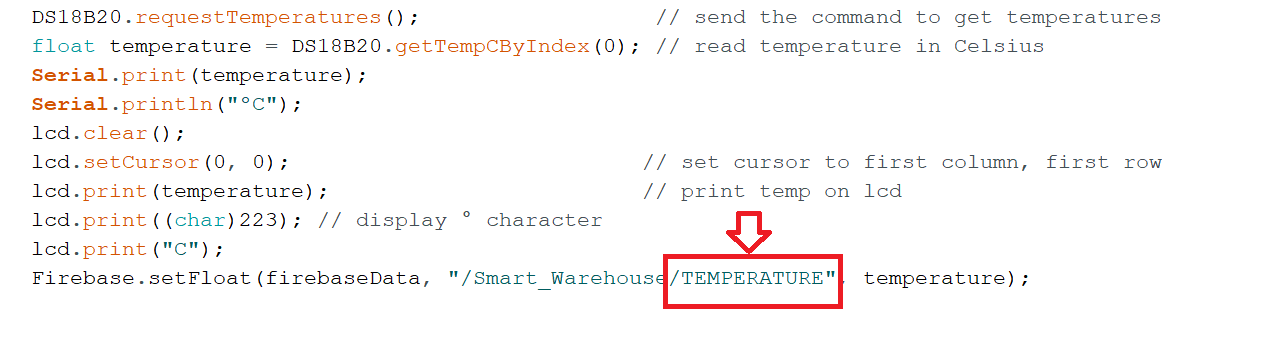
Through Firebase.setFloat() my app will be updated with the current temperature readings. This function will take in three parameters. The first is the FirebaseData object which I have already created. The second is the 'project name/the name of the tag', which I will set in my MIT app inventor block. I have given it a name 'Smart_Warehouse', which I will explain in detail in the steps below. Lastly, I have specified the variable 'TEMPERATURE' in, which I am saving my updated sensor variables i.e., 'temperature'. This variable 'TEMPERATURE' will appear in MIT app design inside blocks workspace.
 |
The if statement in the code reads the temperature values and takes appropriate action with regard to the Relay pin. The logic works like this, if the temperature goes above the upper threshold value defined earlier in the code, the microcontroller turn relay's GPIO pin HIGH and LOW if it is below the upper threshold value.
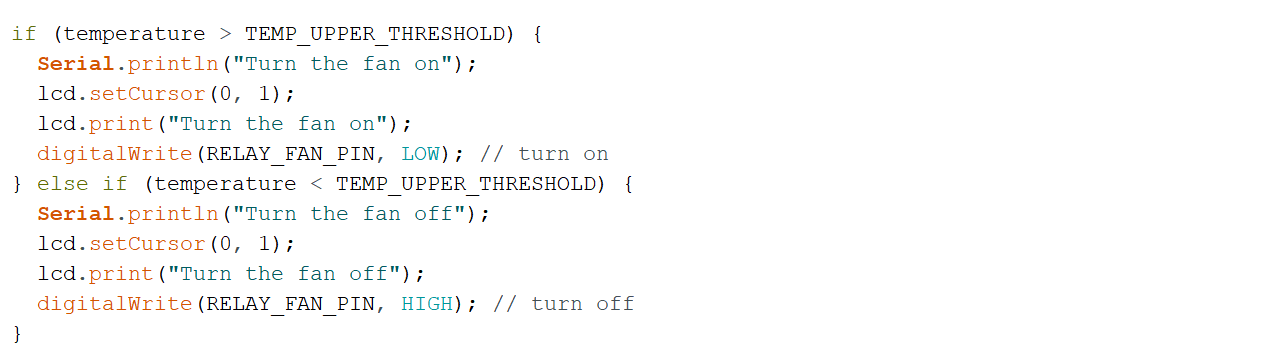 |
Lastly, I defined an int x to push the temperature values on to the field#1 I have created on my ThingSpeak channel. The channel ID and myWriteAPIKey are already declared in the code above.
 |
5. Building App with MIT APP Inventor to Display Sensor Data from Google Firebase:
MIT App Inventor is a block-based programming tool through, which one can create fully functional apps for Android devices such as smartphones, tablets, etc. I had no prior experience in programming and I could easily learn how to use this application efficiently. As mentioned earlier, I have used this tool to build my Smart Warehouse sensor-based app. I am explaining the steps that I followed to develop this app in the subsequent section.
Steps to Create Android App through MIT App inventor:
Following are the steps I used to create my application.
Go to http://appinventor.mit.edu/ and click the 'Create Apps!' button.
.png) |
You will be redirected to a new window, where you will be asked to sign in with your account. After signing in, accept the terms as shown below.
.png) |
You will receive a welcome message. You can visit the link to get more information on how to install the inventor on your smartphone. Press 'Continue' to proceed. If you want, you can have a look at the tutorials being specified. Otherwise, go to 'Start a blank project' to start your app development.
.png) |
Specify your project name. Choose an appropriate name. I have named my app to be 'Smart_Warehouse'. Click 'OK'.
.png) |
Following page will be opened. It is basically a Designer screen. This is, where I have designed the user interface of my app. We can add text, buttons, images and various other functionalities to our app by dragging and dropping components from the palette (the one on the left) to the viewer area (second from the left). Then we can set their attributes through the 'Properties' area on the very right side of the screen. The selected components will be listed in the second column from right as highlighted in the image below.
.png) |
Creating User Interface:
To begin designing the Graphical User Interface (GUI) for my app, I started adding an image appropriate to my project.
.png) |
Here, I added an image of onion warehouse related to my project. You can upload media files as shown below.
.png) |
Go to Palette > User Interface and head over to 'Label'. Now click and drag the label. Drop it on the Viewer side. Now you will be able to view it in the viewer as well as in the components list. I added a label to add a title for my app. The label has properties by default as shown in the right.
.png) |
I modified the properties of the lable like background color to the lable, font size, making it bold, etc. The label will be automatically updated in the viewer. The viewer section will show you the final look of your app, which will appear on your smartphone immediately after modifying the properties of any components. I added name for my application to be 'Smart Warehouse App' in to the text section of the label properties.
.png) |
I added an empty label (set with an empty text) just below the App title to add a space between the title and other content of my app that will be added below the title. The label has properties by default as shown in the right. We can change the spacing dimension by changing the width and height of this empty label.
.png) |
I modified the properties of label as per my app GUI requirement as shown in the right to adjust the spacing as per my requirements.
.png) |
Adding Temperature Sensor Readings:
Next, I added a block for the temperature readings. I went to Palette > Layout > HorizontalArrangement. Clicked and dragged HorizontalArrangement and dropped it in the Viewer.
.png) |
Again, I went to Palette > User Interface and headed over to 'Label'. Then, clicked, dragged and dropped it inside the HorizontalArrangement. The label has properties by default as shown in the right.
.png) |
I went to the 'Properties' and set its text as 'Temperature' and changed the styling according to my preference. I set the width to 50% and the height will be set automatically. Additionally, I chose the font type, size and colour as well.
.png) |
Next, I added another label beside 'Temperature' label to display the temperature reading from sensor. Again, I followed the same procedure of creating a label. I renamed this label as 'Tempertaure_value'. I set it as an empty text and make its width 50% as well.
.png) |
This field for 'Temperature_value' will take this space in my app as shown below.
.png) |
Again, I added an empty label (set with an empty text) just below 'Temperature' field to add a space between 'Temperature' field and other content of my app that will be added below this field. The label has properties by default. We can change the spacing dimension by changing the width and height of this empty label.
.png) |
One more time, I added a block for the Humidity readings. I went to Palette > Layout > HorizontalArrangement. Clicked and dragged HorizontalArrangement and dropped it in the Viewer.
.png) |
Then, I went to Palette > User Interface and headed over to 'Label'. Then, clicked, dragged and dropped it inside the HorizontalArrangement. I went to the 'Properties' and set its text as 'Humidity' and changed the styling according to my preference. I set the width to 50% and the height will be set automatically. Additionally, I chose the font type, size and colour as well.
.png) |
I added another label beside 'Humidity' label to display the humidity reading from sensor. Again, I followed the same procedure of creating a label.
.png) |
I renamed this label as 'Humidity_value'. I set it as an empty text and make its width 50% as well.
.png) |
This field for 'Humidity_value' will take this space in my app as shown below.
.png) |
Adding and linking FirebaseDB to MIT App Inventor:
I went to Palette > Experimental, clicked and dragged FirebaseDB in the viewer. This is a non-visible component of the app and will let me connect it with my Firebase database of the project.
.png) |
After this, I added the secret key authorization key of my Google firebase project which I had saved earlier. I pasted the key where FirebaseToken is written in the properties section of FirebaseDB1. The Firebase token is the same as the secret key. I also added the complete URL of my project in place of the Firebase URL as shown below.
This completes setting-up of the GUI of my application. I then clicked 'Blocks' button on the top right to design the working logic for the application.
.png) |
Working in Blocks layout:
A new editor opened up. Here I designed how my app will respond. I assembled different blocks in this workspace by clicking and dragging them as explained in details below.
.png) |
First, I clicked 'FirebaseDB1' and a series of blocks got opened. I clicked and dragged the 'DataChanged' block in the workspace as shown below.
.png) |
.png) |
Then I went to Built-in > Control and chose the 'if-then' block.
.png) |
I clicked and dragged the 'if-then' block in the workspace and placed it as shown below.
.png) |
Next, I went to Built-in > Logic and chose the block highlighted as shown below.
.png) |
I clicked and dragged this block in the workspace and placed it connecting to the 'if-then' block as shown below.
.png) |
I went to Built-in > Variables and chose the 'get' block as shown below.
.png) |
I clicked and dragged the 'get' block in the workspace and placed it connecting to the 'if-then' block and selected 'tag' inside the 'get' tab as shown below.
.png) |
Next, I went to Built-in > Text and chose the block highlighted as shown below.
.png) |
I clicked and dragged this block in the workspace and placed it connecting to the 'get' block and added Text 'TEMPERATURE' inside this text block as shown below. This 'TEMPERATURE' is the same variable, I had defined in the program in arduino IDE. Please see the second image below to relate.
.png) |
 |
Next, I went little below to Screen1 > HorizontalArrangement > Temperature_value and chose the block highlighted as shown below.
.png) |
I clicked and dragged this block in the workspace and placed it connecting to the 'if-then' block.
.png) |
Again, I went to Built-in > Text and chose 'join' block as highlighted below.
.png) |
I clicked and dragged 'join' block in the workspace and placed it connecting to the 'set' block as shown below.
.png) |
Next, I went to Built-in > variables and chose 'get' block as highlighted below.
.png) |
I clicked and dragged 'get' block in the workspace and placed it connecting to the 'join' block as shown below. I then selected 'value' inside the 'get' tab as shown below.
.png) |
Next, I went to Built-in > Text and chose the block highlighted as shown below.
.png) |
I clicked and dragged 'text' block in the workspace and placed it connecting to the 'join' block as shown below. I then added text 'Deg C' inside the 'text' block.
.png) |
This completes block programming for collecting 'Temperature' data on the app. I duplicated this entire set of blocks for collecting and publishing 'Humidity' readings.
.png) |
.png) |
I placed this second set of blocks connecting to 'FirebaseDB1' block as shown below.
.png) |
For the second set of blocks for 'Humidity', I replaced 'TEMPERATURE' variable with that of 'HUMIDITY' variable. I also replaced 'Deg C' text with that of '%' sign for humidity values. This completes my block programming for my application.
.png) |
After completing block programming, I again went to the Designer workspace. I clicked on 'Connect > AI companion' tab on the top.
.png) |
This opened up the QR code and 6 digit code on the screen for me to be able to connect to the AI companion app on android.
.png) |
Go to playstore and install the 'AI companion app' and once installed, scan the QR code on the computer screen by clicking on 'scan QR code' button on AI companion app or use 6 digit code to connect as shown below.
.jpg) |
.jpg) |
Once the AI companion app is connected, the progress bar will be seen on the screen as shown below. Once this connection is done, it will open the app GUI screen on our mobile.
.png) |
In my case the AI companion app got connected to my project. However, I got this FireBaseError on my app screen for which I started fiding resolution and I found following solution (the second image below).
.jpg) |
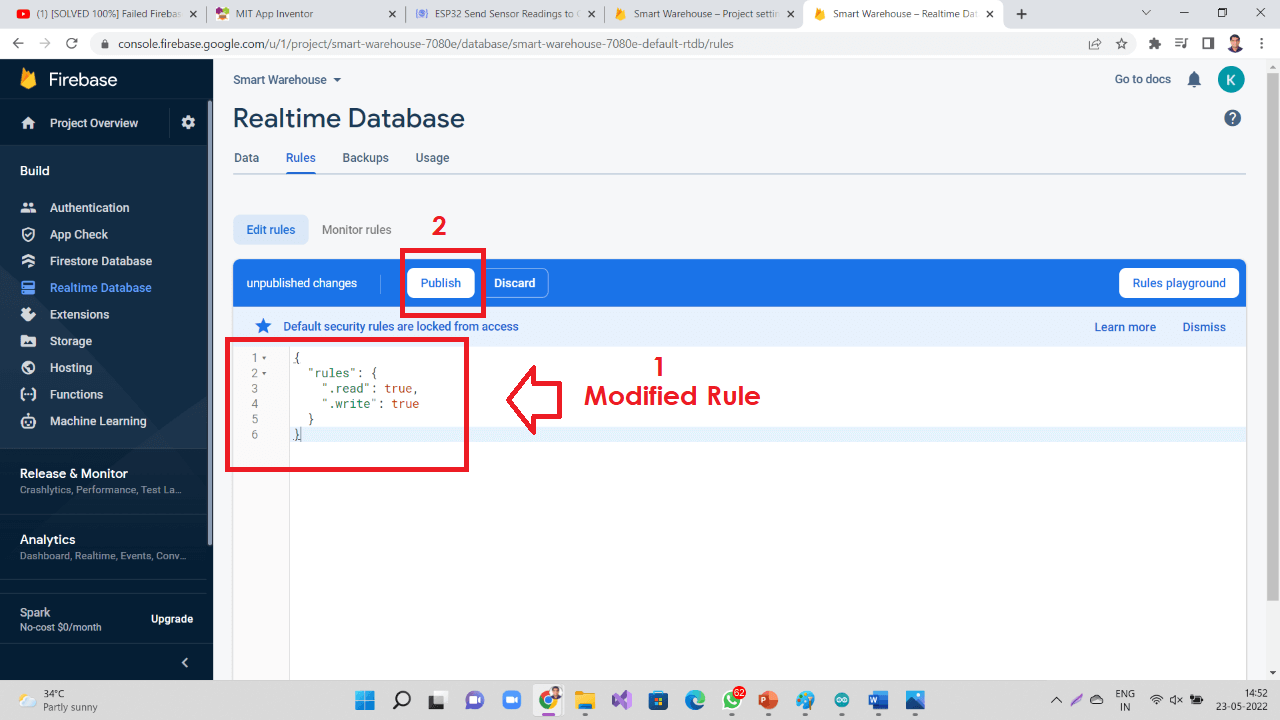
I again went to my project's Google Firebase console, went to 'Realtime Database > Rules'.
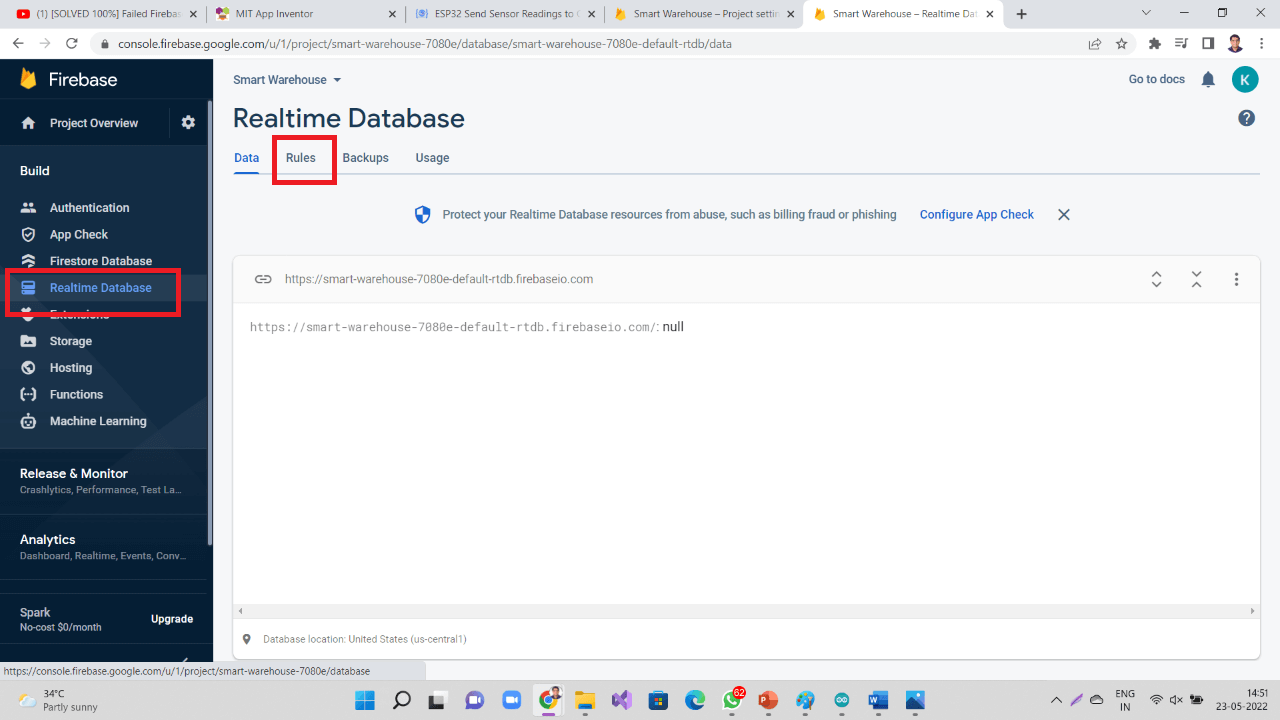 |
I clicked on Edit Rules. It shows 'false' values read and write by default.
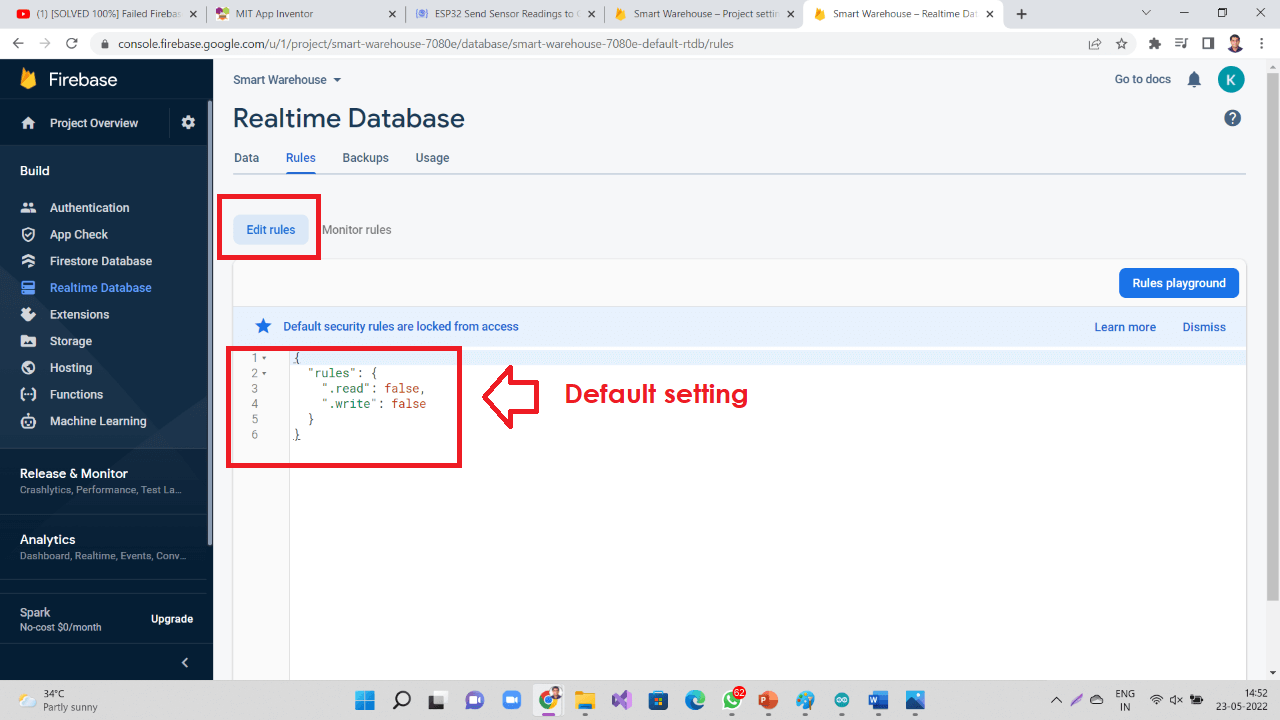 |
I made them 'true' for both read and write and clicked on 'Publish' button above.
 |
I updated my code with gas sensor integrated in to the system. You can copy/download the code from the cloud.
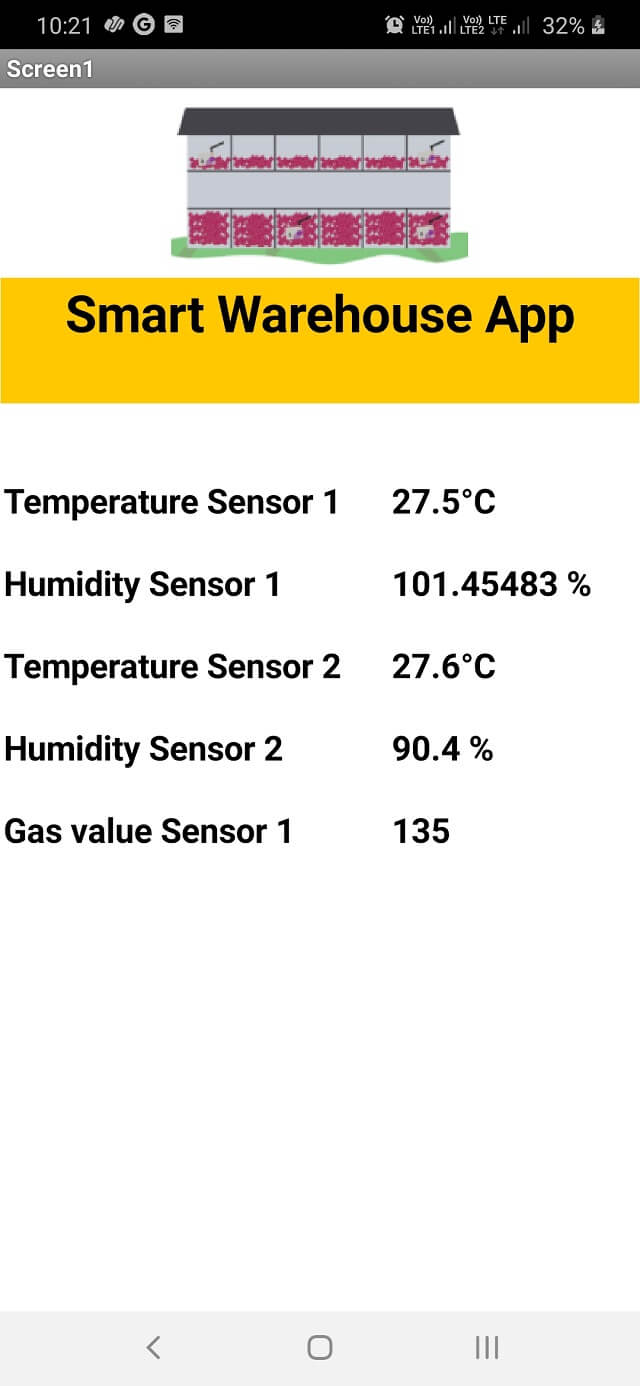
Wow, my app started displaying the temperature values as shown in the left image below. The left-most image is taken after I added temperature and humidity values for second sensor. The right-most image is taken after I added MQ2 gas sensor analog values.
|
|
This is how my app started working:
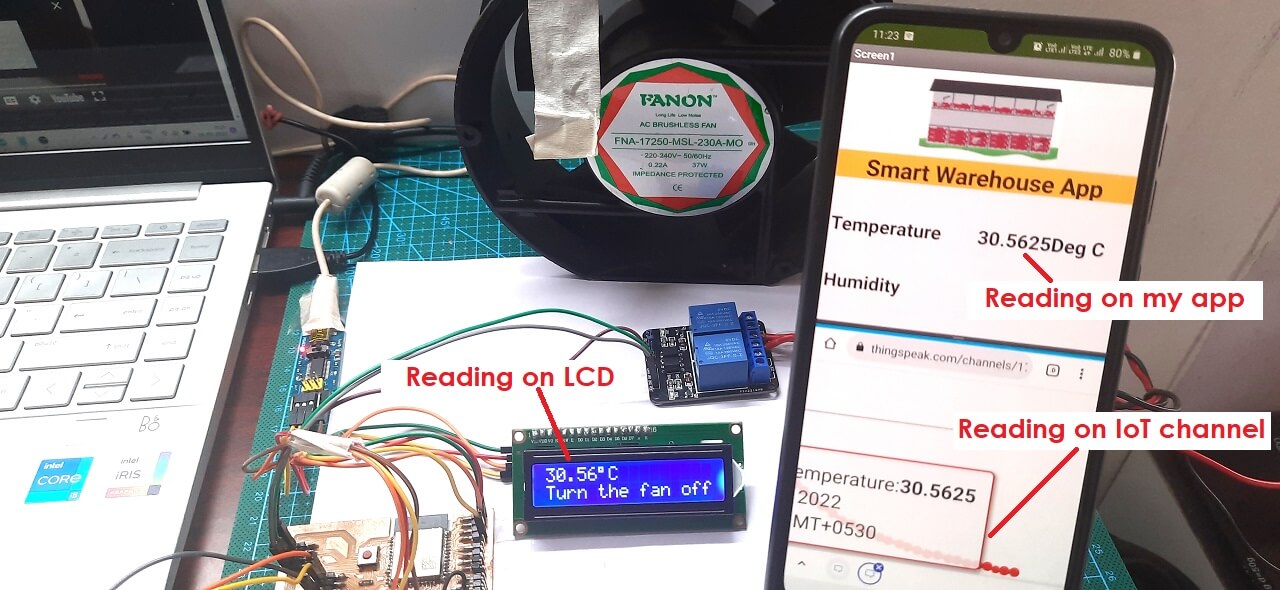
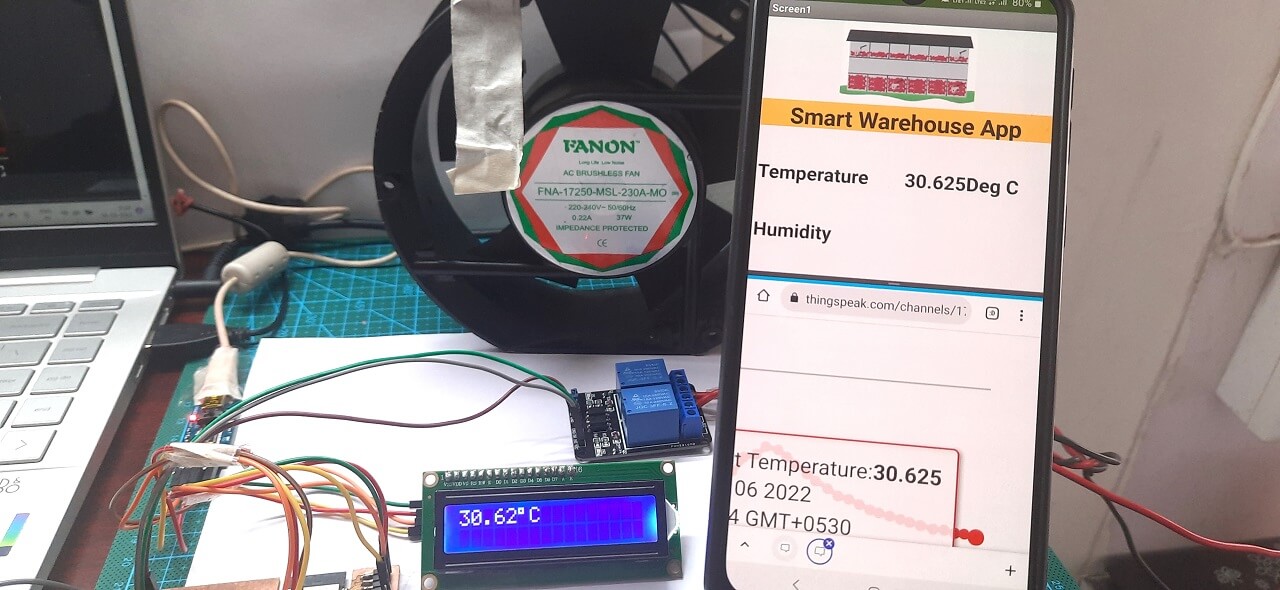
Following images are showing my final project set-up with DS18B20 temperature sensor connected to my project board. Along with it, I have connected LCD, relay. The temperature values are seen displayed at a time on LCD, my app and ThingSpeak IoT channel I had established in my last assignment.
|
|
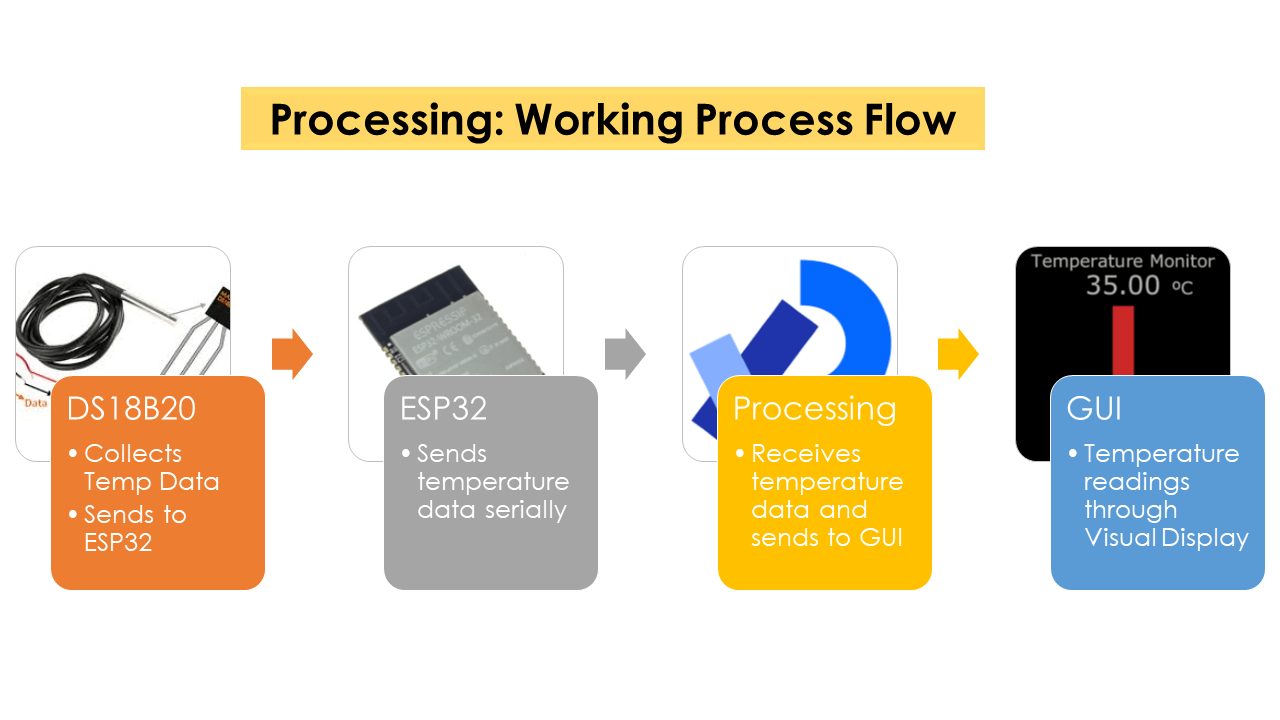
2. Application development through Processing:
As a second task in this assignment, I worked on Processing to design a graphical user interface to visually display temperature readings collected by DS18B20 temperature sensor. To do this, I connected one DS18B20 temperature sensor to my final project board and ran one program through arduino IDE for the sensor to start reading and sending temperature readings to the serial monitor. At the same time, I used processing IDE to use this data received serially by my board and visually display this data.
Following is a work process flow of the application:
 |
Brief about Processing:
Processing is a free graphical library and integrated development environment (IDE) built for the electronic arts, new media art, and visual design communities with the purpose of teaching non-programmers the fundamentals of computer programming in a visual context.
Processing uses the Java language, with additional simplifications such as additional classes and aliased mathematical functions and operations. It also provides a graphical user interface for simplifying the compilation and execution stage. The Processing language and IDE have been the precursor to other projects including Arduino, Wiring and P5.js. However, the graphical user interface of the Processing IDE is just like the Arduino IDE.
Features of Processing:
- Processing includes a sketchbook, a minimal alternative to an integrated development environment (IDE) for organizing projects.
- Every Processing sketch is actually a subclass of the PApplet Java class (formerly a subclass of Java's built-in Applet) which implements most of the Processing language's features.
- When programming in Processing, all additional classes defined will be treated as inner classes when the code is translated into pure Java before compiling.
- Processing also allows for users to create their own classes within the PApplet sketch.
- Interactive programs with 2D, 3D, PDF, or SVG output
Credits and Reference: Click here.
Download processing application by clicking here.
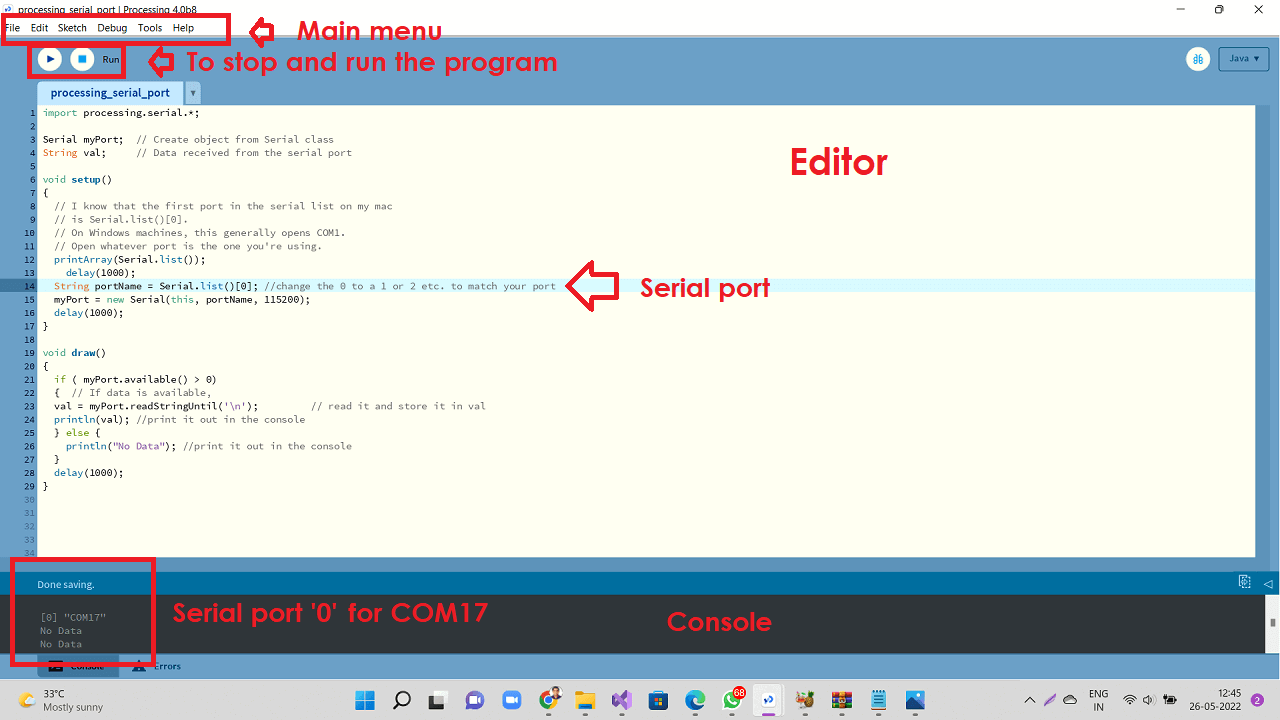
Program to know the serial port number:
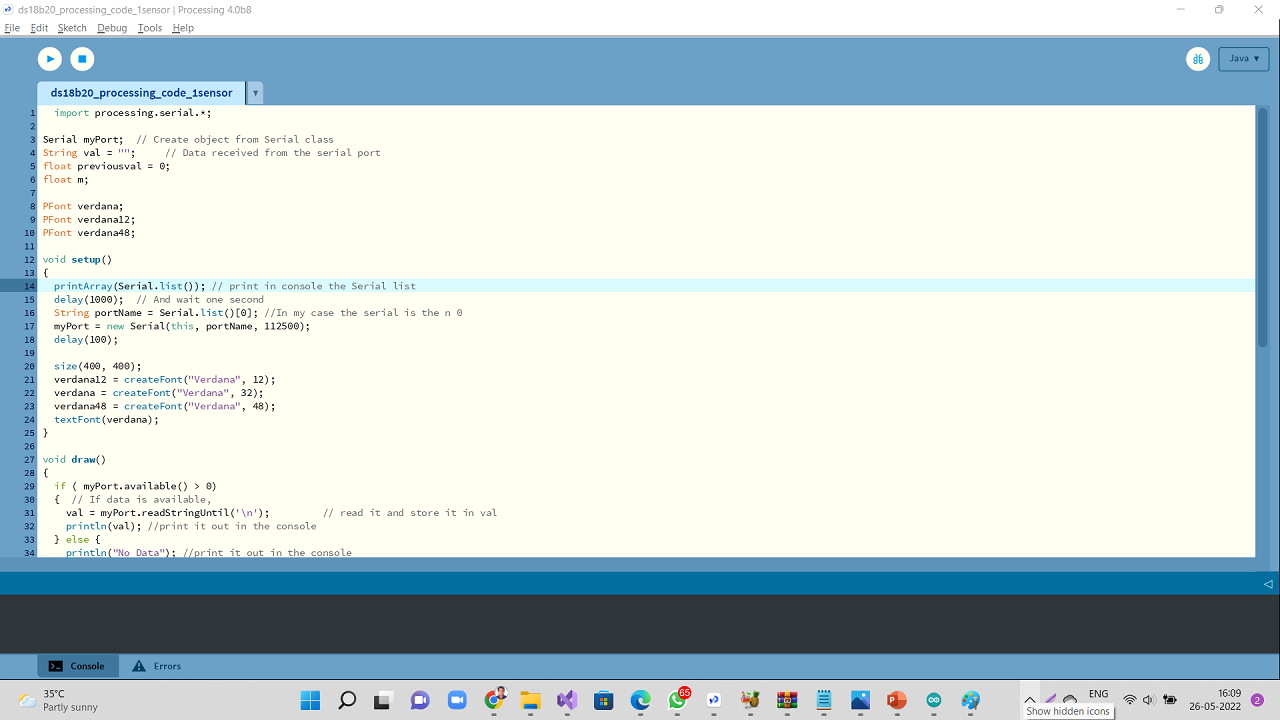
Below picture is to explain the processing IDE interface and to also explain the code to identify the serial port number to, which the microcontroller board is connected to send the data serially.
Similar to Arduino, the Processing code consists of three sections- first, we call the libraries and then declare variables. Import processing.serial.*. After that, we have void with Setup and another with the 'draw' loop. printArray(Serial.list()); command is used to print the list of available COM ports for the serial communication. Then a list of the array is displayed on the console; we need to select the com port that we have selected in the Arduino ide to send the command.
Command used to select the COM port is Serial.list()[0]. I have defined the baud rate of the port, the same as that of Arduino program, 112500. Inside the draw loop, we are checking if it has been correctly connected to the serial port. If so, we get the message that comes through the port and save it in the "val" variable and print it to the console, as we can see in the image.
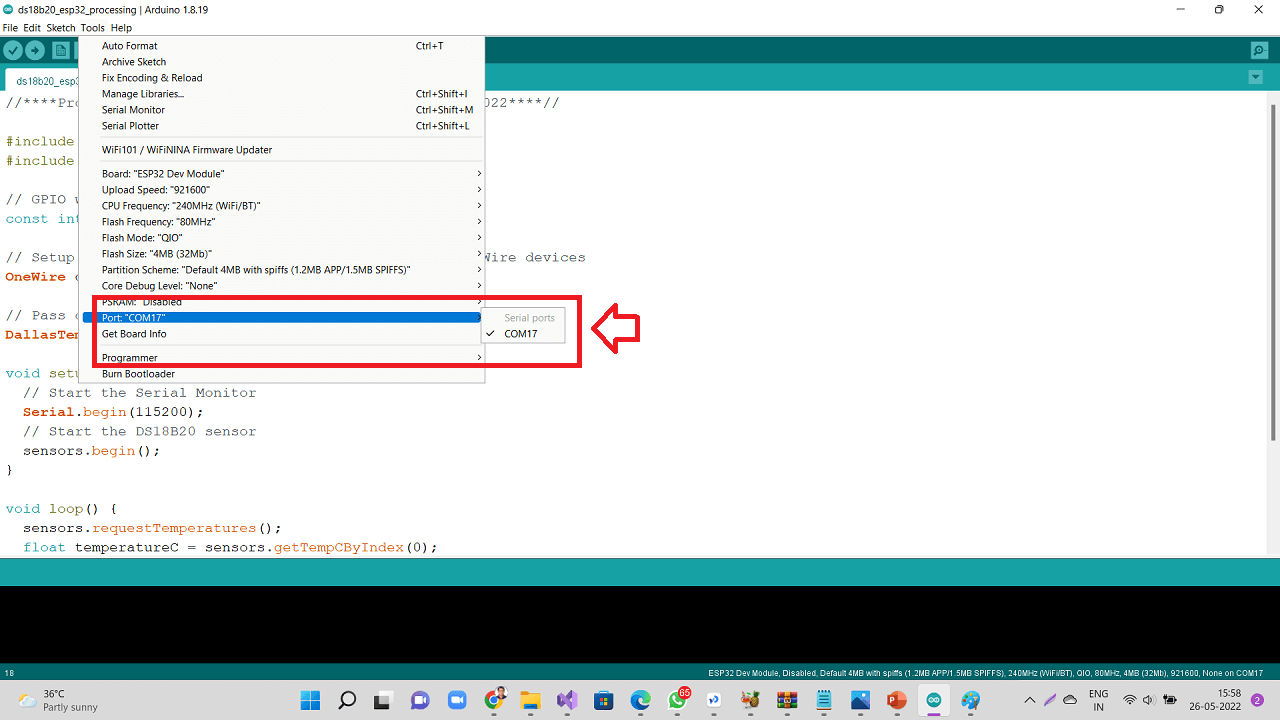
In my case, I am using COM17 for the serial communication through Arduino IDE; the processing console shows the list, and the COM17 index is 0; hence I have added the command Serial.list()[0] and assigned the variable as port name to it. See both the images below.
 |
 |
Copy/Download the processing sketch to know the serial port for communication:
Click here to see/copy the above processing sketch/program to know the serial port for communication.
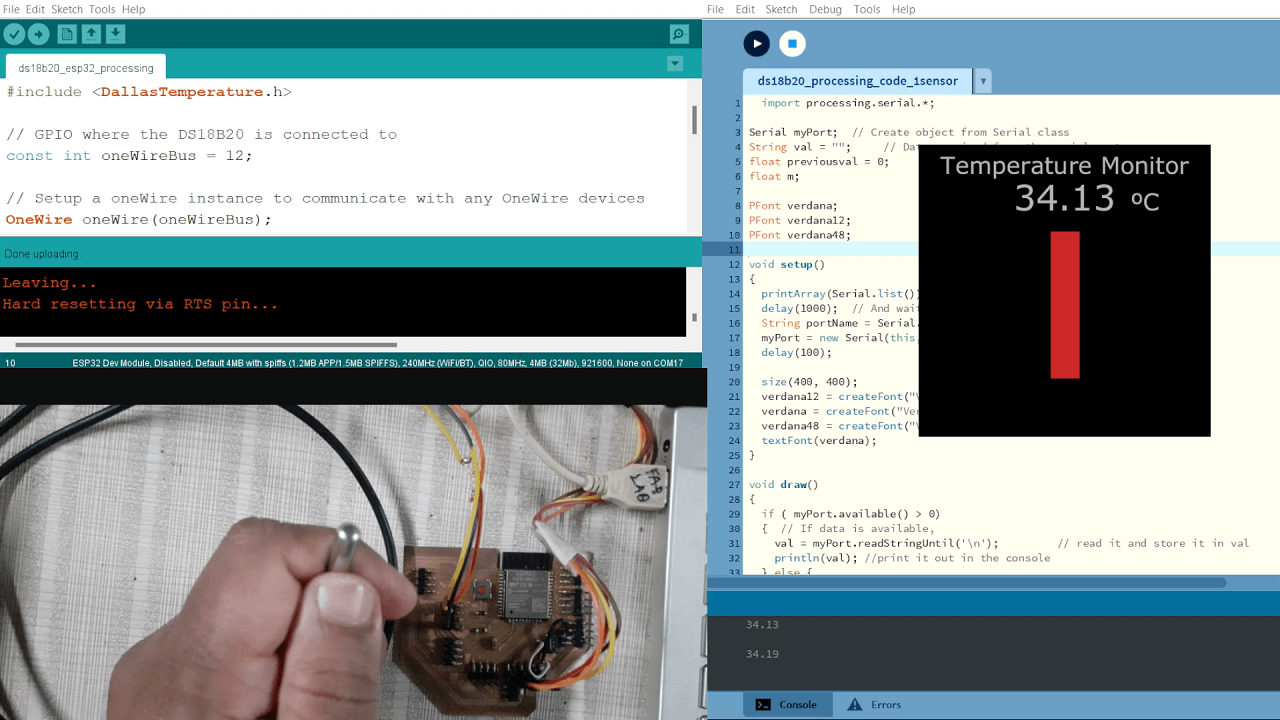
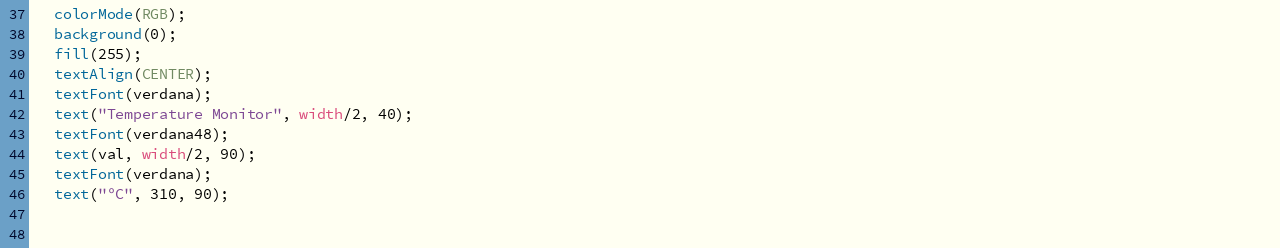
The next task is to make a visual representation of the temperature values from a sensor and display it on the screen . In this case, I have used the Arduino program that I have used in the Inputs devices assignment, in which I read the temperature of the DS1820 sensor using the Serial.print(temperatureC); command as shown in the code below. Below is the code that I have written in Processing IDE for developing the temperature monitor GUI. I will explain the code below. Click here to see/copy the above processing sketch/program for temperature monitor GUI.
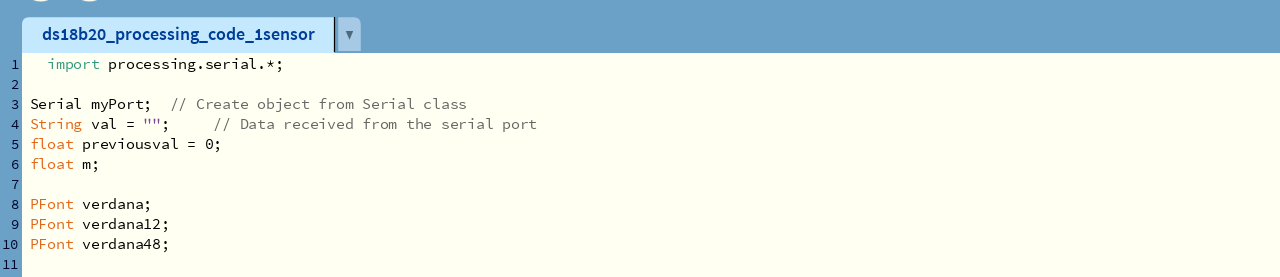
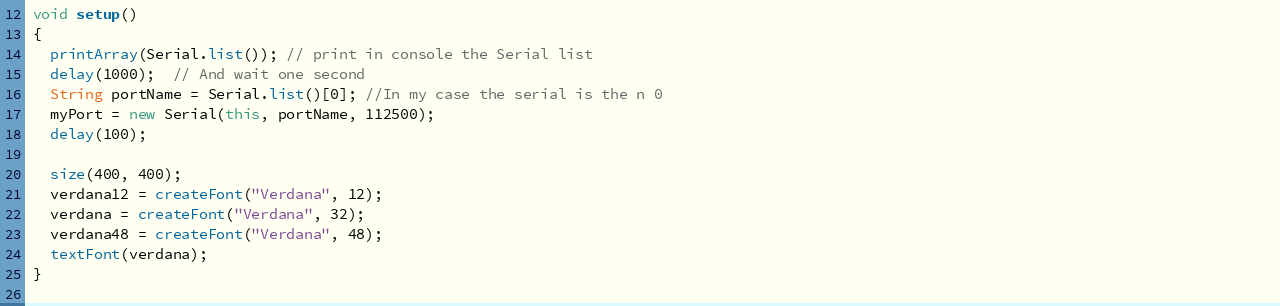
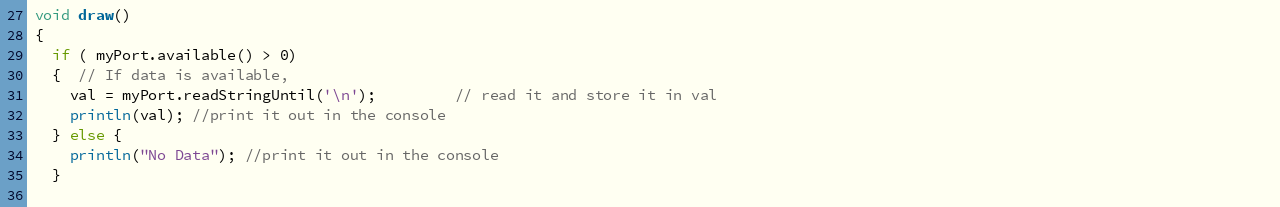
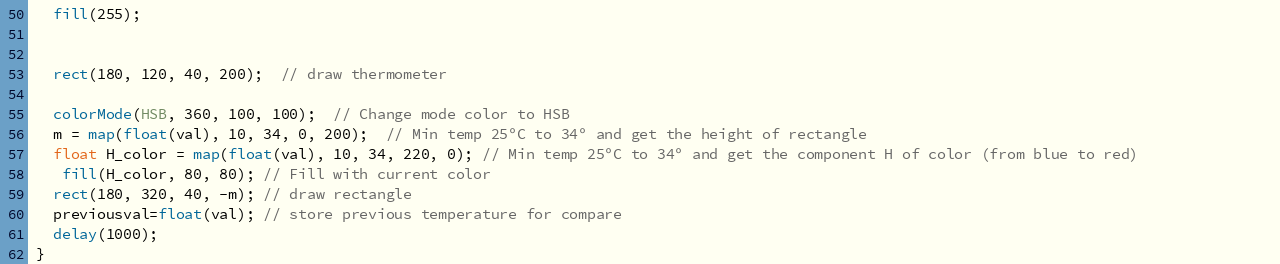
First, I called the processing.serial.* library. Added myPort as an object to be created from the serial class. I defined "val" as a string to store data received from the serial port. Defined floats and other variables for fonts used. In void setup(), added command Serial.list()[0] for port COM17 from, which the data is received from my project board. It is also displayed in to the console with a baud rate of 112500 (same as that of in arduino IDE program). I have also set-up font sizes for the monitor here. A 400x400 pixels screen with size (400, 400) has been set-up for GUI. In void draw(), data received from the serial port is printed against a variable "val" that I had already declared at the beginning of the code. If the port does not receive a data, it will show, 'No Data' in to console. Now, I have defined parameters for the temperature monitor GUI including its background color, font, fontsize, and text to be displayed in to the GUI. In this last section of the code, I have defined Colors for varying temperature values to be displayed on the GUI as per the serial data being received. Following image shows DS18B20 temperature sensor connected to my project board. Top left side is arduino IDE, botton left is board connections, Right side of the picture is Processing IDE and my temperature monitor.Developing Temperature monitor GUI:
Copy/Download the processing sketch for Temperature monitor GUI:
Explaination of the code:
This is how the processing GUI started working:
Adding videos again for this week
1. Collecting DS18B20 Temperature sensor data on application.
2. Collecting Temperature sensor and MQ2 gas data on application.
3. Displaying DS18B20 Temperature sensor data on Processing.
Click here to go back to the top
Download Original Files
Click here to download all original files.
Click here to go back to the topWhat went well
In group assignment- We were able compare different tools for Interface and Application Programming.
In individual assignment- I was able to work on two application tools- MIT app inventor and another one was processing. I learned these two applications this week.
What went wrong
There is nothing major that we went wrong in the group as well as individual assignment.
Click here to go back to the topWhat I would do differently
- I would have tried adding multiple sensor display in Processing GUI.
- I will make this as an attempt in upcoming weeks as time permits from the final project work.
Learning Outcomes
- I learned different tools for interface and application programming
- I learned how to use Google Firebase and MIT app inventor.
- I learned how to use Processing tool for designing GUI.