14. Interface and Application Programming
Group assignment:
- Compare as many tool options as possible.
- Document your work on the group work page and reflect on your individual page what you learned.
Individual assignment:
- Write an application for the embedded board that you made, that interfaces a user with an input and/or output device(s)
Group Assignment
During the group assignment, we studied different tools used for interface and application programming for embedded systems.
The main goal of the group work was to understand how software interfaces can communicate with microcontrollers through Serial Communication and how different platforms work when creating real-time interaction between hardware and software. We explored and compared three different approaches — Processing + G4P, Python + Tkinter, and Node-RED — covering serial communication, graphical interfaces, keyboard interaction, LED control, and real-time visualization. We tested how software interfaces can dynamically react to data received from a microcontroller, and how the underlying communication workflow differs between tools.
Comparing the Three Tools
| Tool | Processing + G4P | Python + Tkinter | Node-RED |
|---|---|---|---|
| Language | Java-like | Python | Visual + JS |
| Install | Processing IDE + G4P | pip install pyserial |
npm + 2 modules |
| Serial | Built-in Serial class |
pyserial |
Serial node |
| Feels like Arduino | Yes — identical structure | Partially — same logic, different syntax | No |
| Time to working result | ~30 min | ~25 min | ~15 min |
| Teaches Serial internals | ✅ | ✅ | hidden inside nodes |
These three tools represented completely different approaches: writing a program and understanding each line of code (Processing, Python) versus assembling a working system using pre-built parts (Node-RED).
For the individual assignment, I chose Processing because I wanted to better understand exactly what the code was doing, and the similarity between Processing and Arduino made the communication workflow much easier to follow.
Possible Improvements
Our comparison only covered the simplest scenario — one button and one LED. A more complete test could include PWM brightness control, sliders, continuous input values, and multiple outputs, which would give a better picture of how each tool handles more complex interaction systems.
One advantage worth highlighting is that the Node-RED dashboard runs in any browser on the local network, so it can be accessed from a phone, tablet, or another computer without installing anything — potentially useful for future remote monitoring systems.
During the Tkinter experiment, we also noticed that updating interface elements directly from a background thread isn’t technically safe. The correct approach is to use root.after() so the interface updates from the main thread instead. The simple test still worked correctly, but this limitation helped us understand GUI programming structure and event handling in Python applications a bit better.
Files: xiao_rp2040_firmware.ino (board firmware), LED_Control_G4P.pde (Processing + G4P sketch), led_control_tkinter.py (Python + Tkinter application), fabacademy_led_flow.json (Node-RED flow).
More complete information about the group assignment, workflows, files, and comparison experiments can be found on the group assignment page.
Individual Assignment
For my individual assignment, I decided to combine embedded programming and interface programming by creating a real-time gas monitoring visualization system using Processing and my custom XIAO RP2040 PCB. This assignment evolved through two experiments and became directly connected to my Final Project.
The first test was a simple keyboard-controlled communication experiment between Processing and my PCB. The second test built on that result and connected the same logic directly to my MQ-7 gas sensor, turning it into a real-time monitoring interface.
Development Environment
The IDE I used for this assignment is called Processing (processing.org), an open-source programming environment built for visual arts and interaction design, closely related to Arduino’s own IDE. Processing lets you write Java-like sketches with built-in graphics, animation, and serial communication support, which made it a natural fit for turning raw sensor data into a real-time visual interface.
I wrote all of my Processing sketches directly in Processing’s own built-in code editor. I downloaded and installed Processing first, tested it with the simple keyboard-controlled LED sketch below, and only afterward downloaded and imported the G4P library to try building a more structured GUI (see below).
One note on deployment: since this interface was built in Processing as a desktop application using the processing.serial library, it runs as a regular program on the computer and isn’t limited to Chrome or any browser — the “only works in a Chromium-based browser” limitation applies to Web Serial API projects built with p5.js in a browser, which isn’t the approach I used here.
First Experiment — Keyboard-Controlled LEDs
Before building the final MQ-7 monitoring interface, I ran a simpler communication experiment between Processing and my XIAO RP2040 board. This was put together with the help of ChatGPT prompts, asking step-by-step how Processing could control LEDs connected to my PCB.
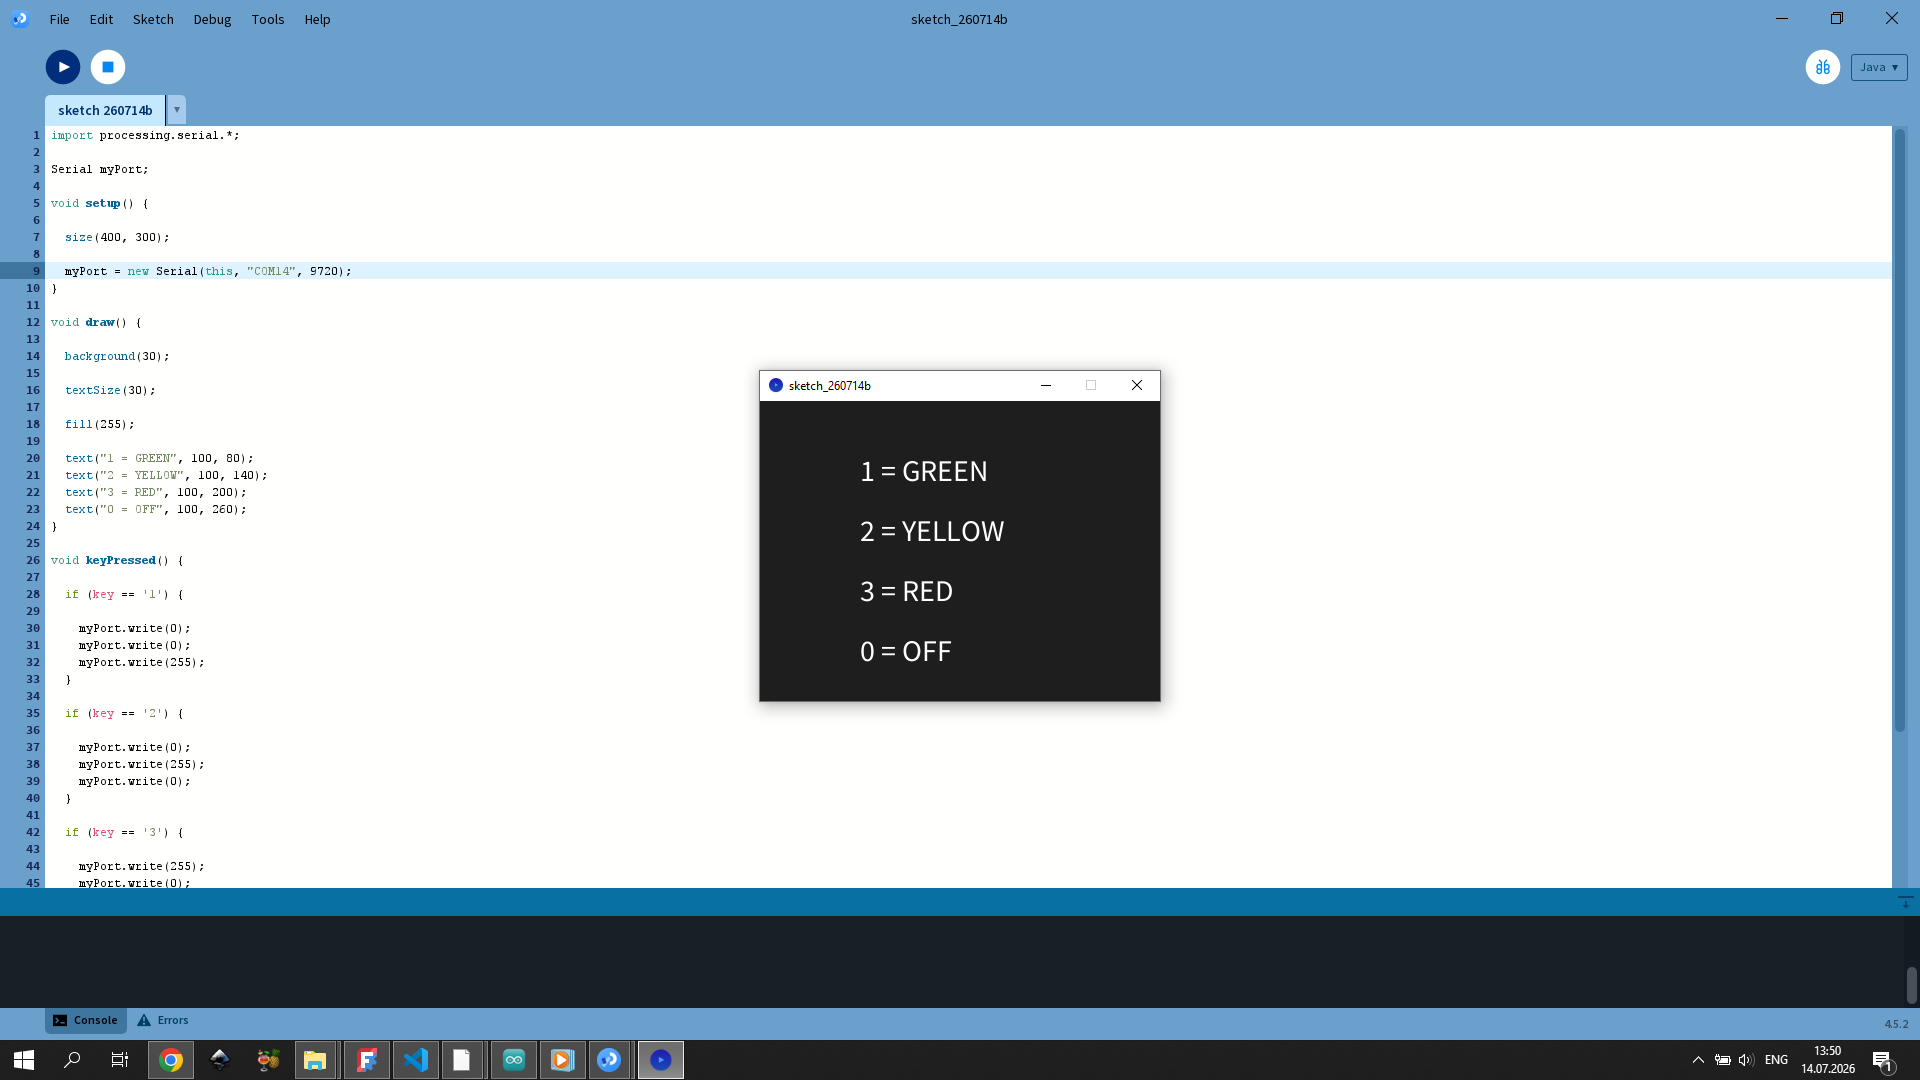
AI platform used: ChatGPT, to write the Processing keyboard-input sketch and the matching Arduino serial-read firmware below.
AI prompt used: “How can I control LEDs connected to my XIAO RP2040 using Processing and Serial Communication?”
The answer showed that Processing could send numeric values over Serial, and Arduino could receive those values and drive the LEDs in real time.
In this test, pressing 1 turned the green LED ON, 2 turned the yellow LED ON, 3 turned the red LED ON, and 0 turned all LEDs OFF. This helped me understand how Processing sends serial data, how Arduino receives it, and how a simple interactive interface can control physical electronics in real time.
import processing.serial.*;

Serial myPort;

void setup() {

  size(400, 300);

  myPort = new Serial(this, "COM3", 9720);
}

void draw() {

  background(30);

  textSize(30);

  fill(255);

  text("1 = GREEN", 100, 80);
  text("2 = YELLOW", 100, 140);
  text("3 = RED", 100, 200);
  text("0 = OFF", 100, 260);
}

void keyPressed() {

  if (key == '1') {

    myPort.write(0);
    myPort.write(0);
    myPort.write(255);
  }

  if (key == '2') {

    myPort.write(0);
    myPort.write(255);
    myPort.write(0);
  }

  if (key == '3') {

    myPort.write(255);
    myPort.write(0);
    myPort.write(0);
  }

  if (key == '0') {

    myPort.write(0);
    myPort.write(0);
    myPort.write(0);
  }
}
On the Arduino side, the board just waits for 3 incoming bytes and writes them straight to the three LED pins:
int redLed = D1;
int yellowLed = D2;
int greenLed = D3;

void setup() {

  Serial.begin(9720);

  pinMode(redLed, OUTPUT);
  pinMode(yellowLed, OUTPUT);
  pinMode(greenLed, OUTPUT);
}

void loop() {

  if (Serial.available() >= 3) {

    int r = Serial.read();
    int y = Serial.read();
    int g = Serial.read();

    analogWrite(redLed, r);
    analogWrite(yellowLed, y);
    analogWrite(greenLed, g);
  }
}
Adding the G4P Library
While building the Processing interface, I realized the default tools (text(), ellipse(), rect()) weren’t enough for the kind of interface I wanted — something more interactive, organized, and closer to a real monitoring panel. That pushed me to explore additional GUI tools for Processing, and I found the G4P library.
It wasn’t bundled with my Processing install by default, so I downloaded it manually and copied it into the Processing libraries folder, then restarted Processing and imported it into my project. With G4P installed, I could experiment with buttons, labels, and other structured GUI elements.
AI platform used: ChatGPT, to write the basic G4P button example below.
AI prompt used: “Show me a simple example of adding a button with the G4P library in Processing that prints a message when clicked.”
import g4p_controls.*;

GButton btn;

void setup() {

  size(400, 300);

  btn = new GButton(this, 140, 120, 120, 40);

  btn.setText("LED ON");
}

void draw() {

  background(200);
}

void handleButtonEvents(GButton button, GEvent event) {

  if (button == btn) {

    println("Button Pressed");
  }
}
In the end, the final MQ-7 visualization interface was built mostly with Processing’s built-in graphical functions rather than G4P, but the experiment was still useful — it gave me a feel for GUI programming, interface organization, and event-based interaction that I could draw on when designing the final interface, and showed how a software interface can grow from a simple visualization into something closer to a usable monitoring system.
Second Experiment — MQ-7 Gas Monitoring Visualization
After testing the MQ-7 sensor with Arduino IDE and watching its raw values in the Serial Monitor, I wanted something more visual and interactive. Processing let me turn that incoming serial data into a real-time graphical panel — colored warning indicators, status text, and a live ppm value — simulating a safety monitoring screen rather than just a column of numbers.
This experiment connects directly to my Final Project: a smart environmental monitoring system for workshop and forge safety. By this point I had already designed the electronics and the core sensor logic in previous weeks, so this was a chance to test and extend that already-working hardware with a real-time visualization layer, and to get a feel for how the complete system might behave once it’s monitoring an actual environment. Tools used: Arduino IDE, Processing IDE, the MQ-7 sensor, USB Serial communication, and my custom XIAO RP2040 PCB.
AI platform used: ChatGPT, to help build the serialEvent() parsing logic and the state-based drawing code.
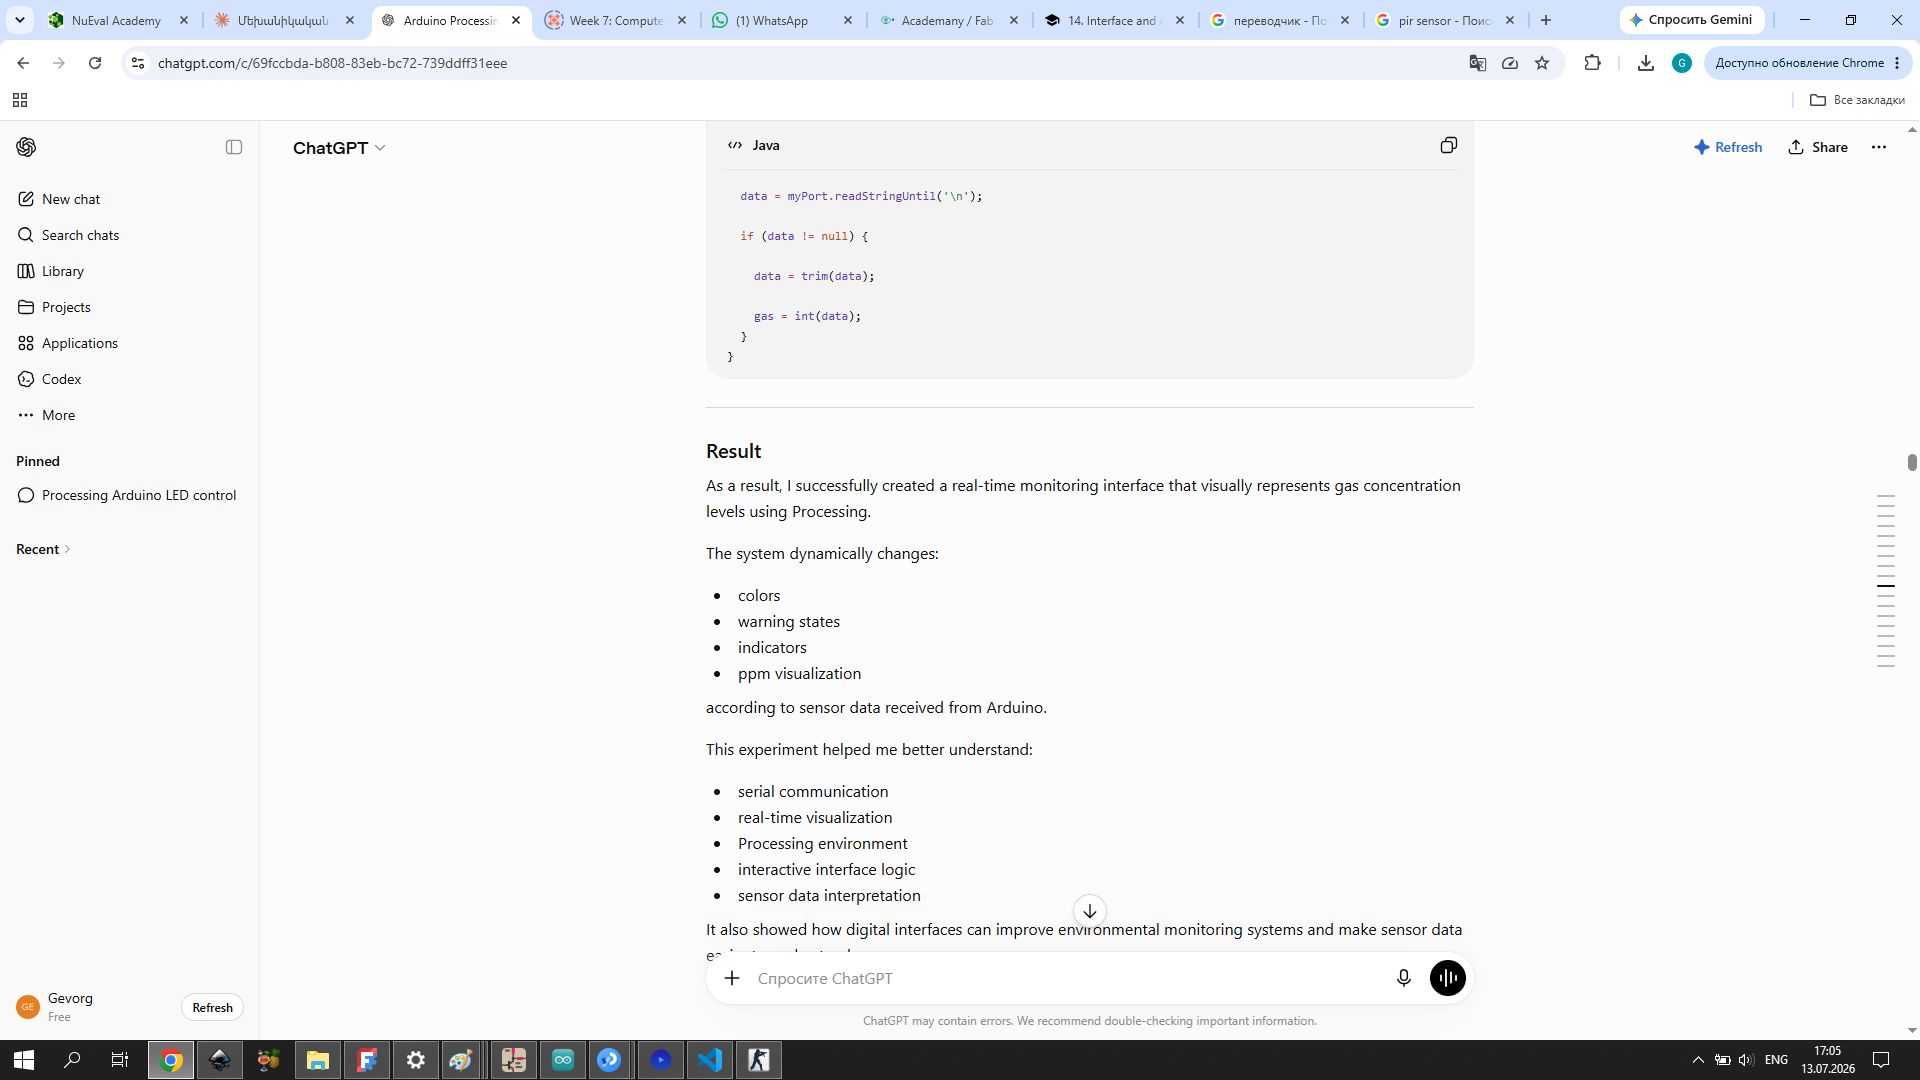
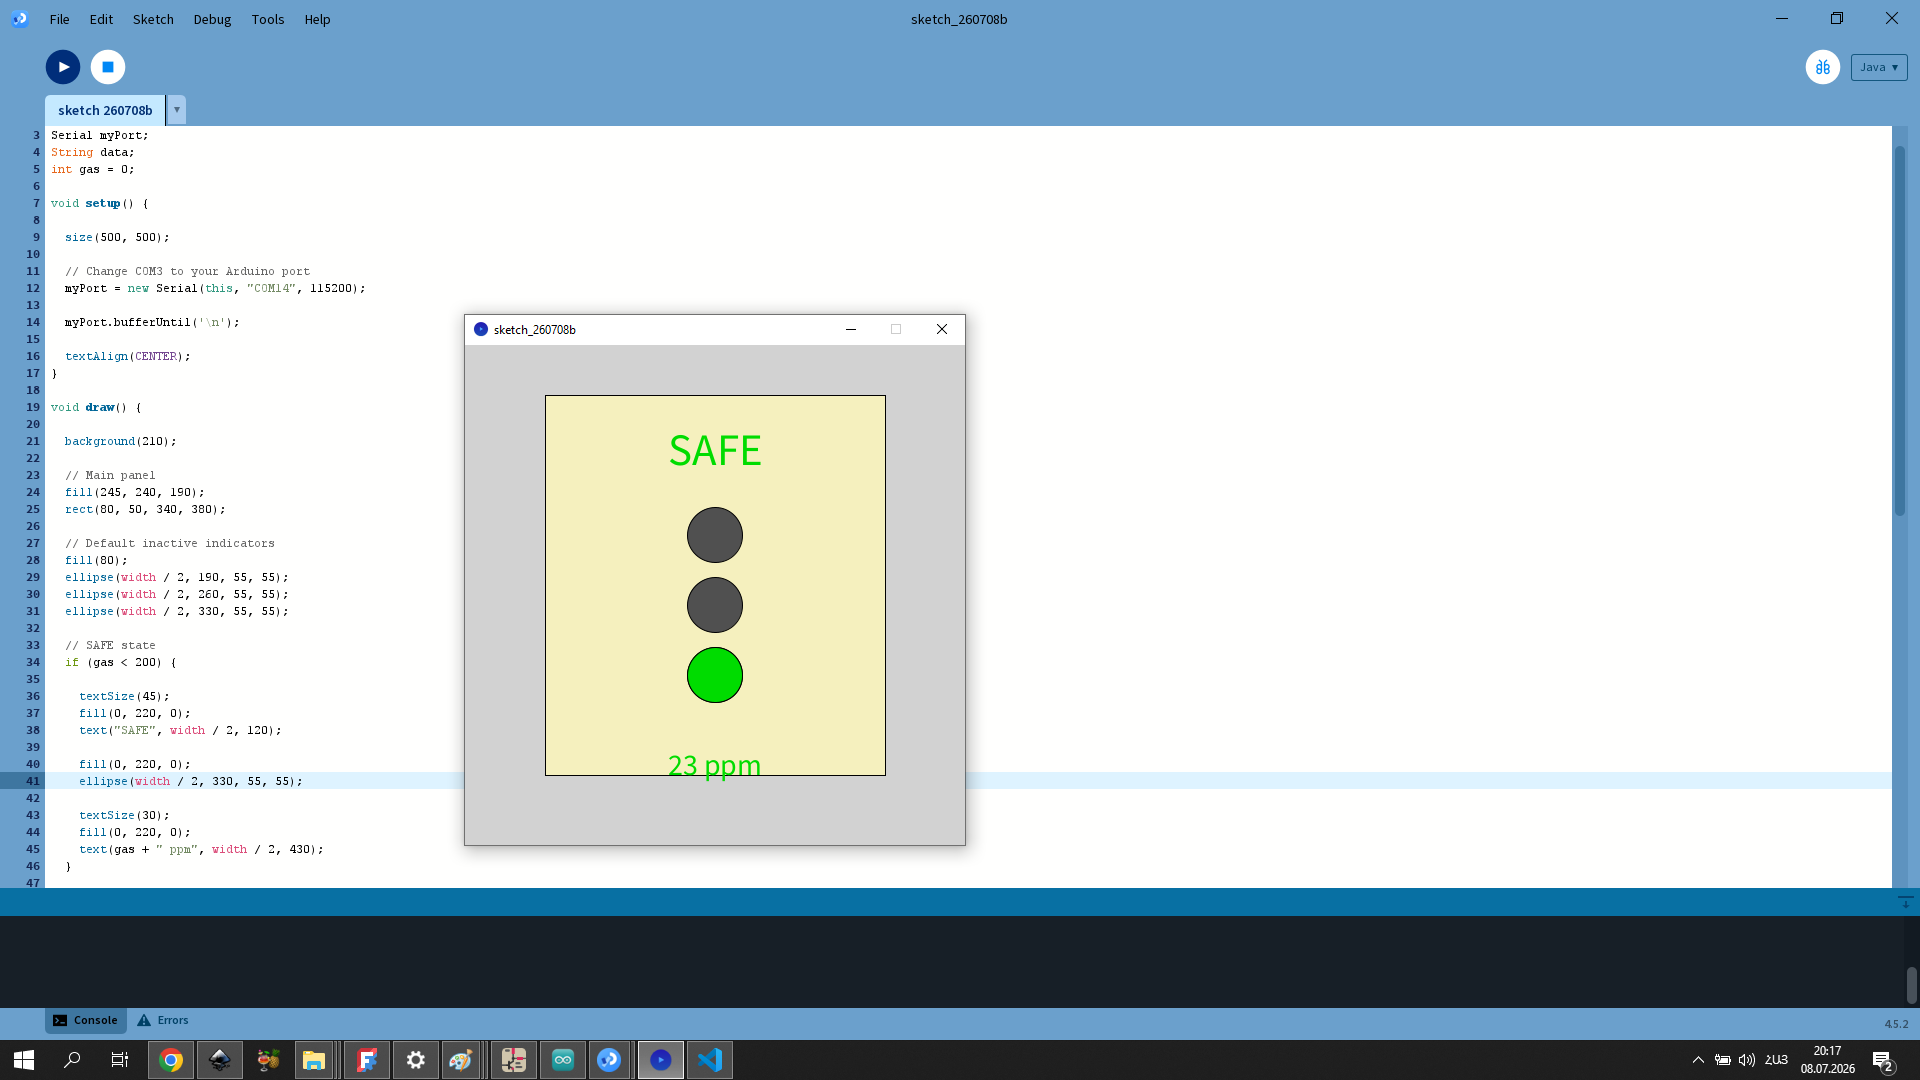
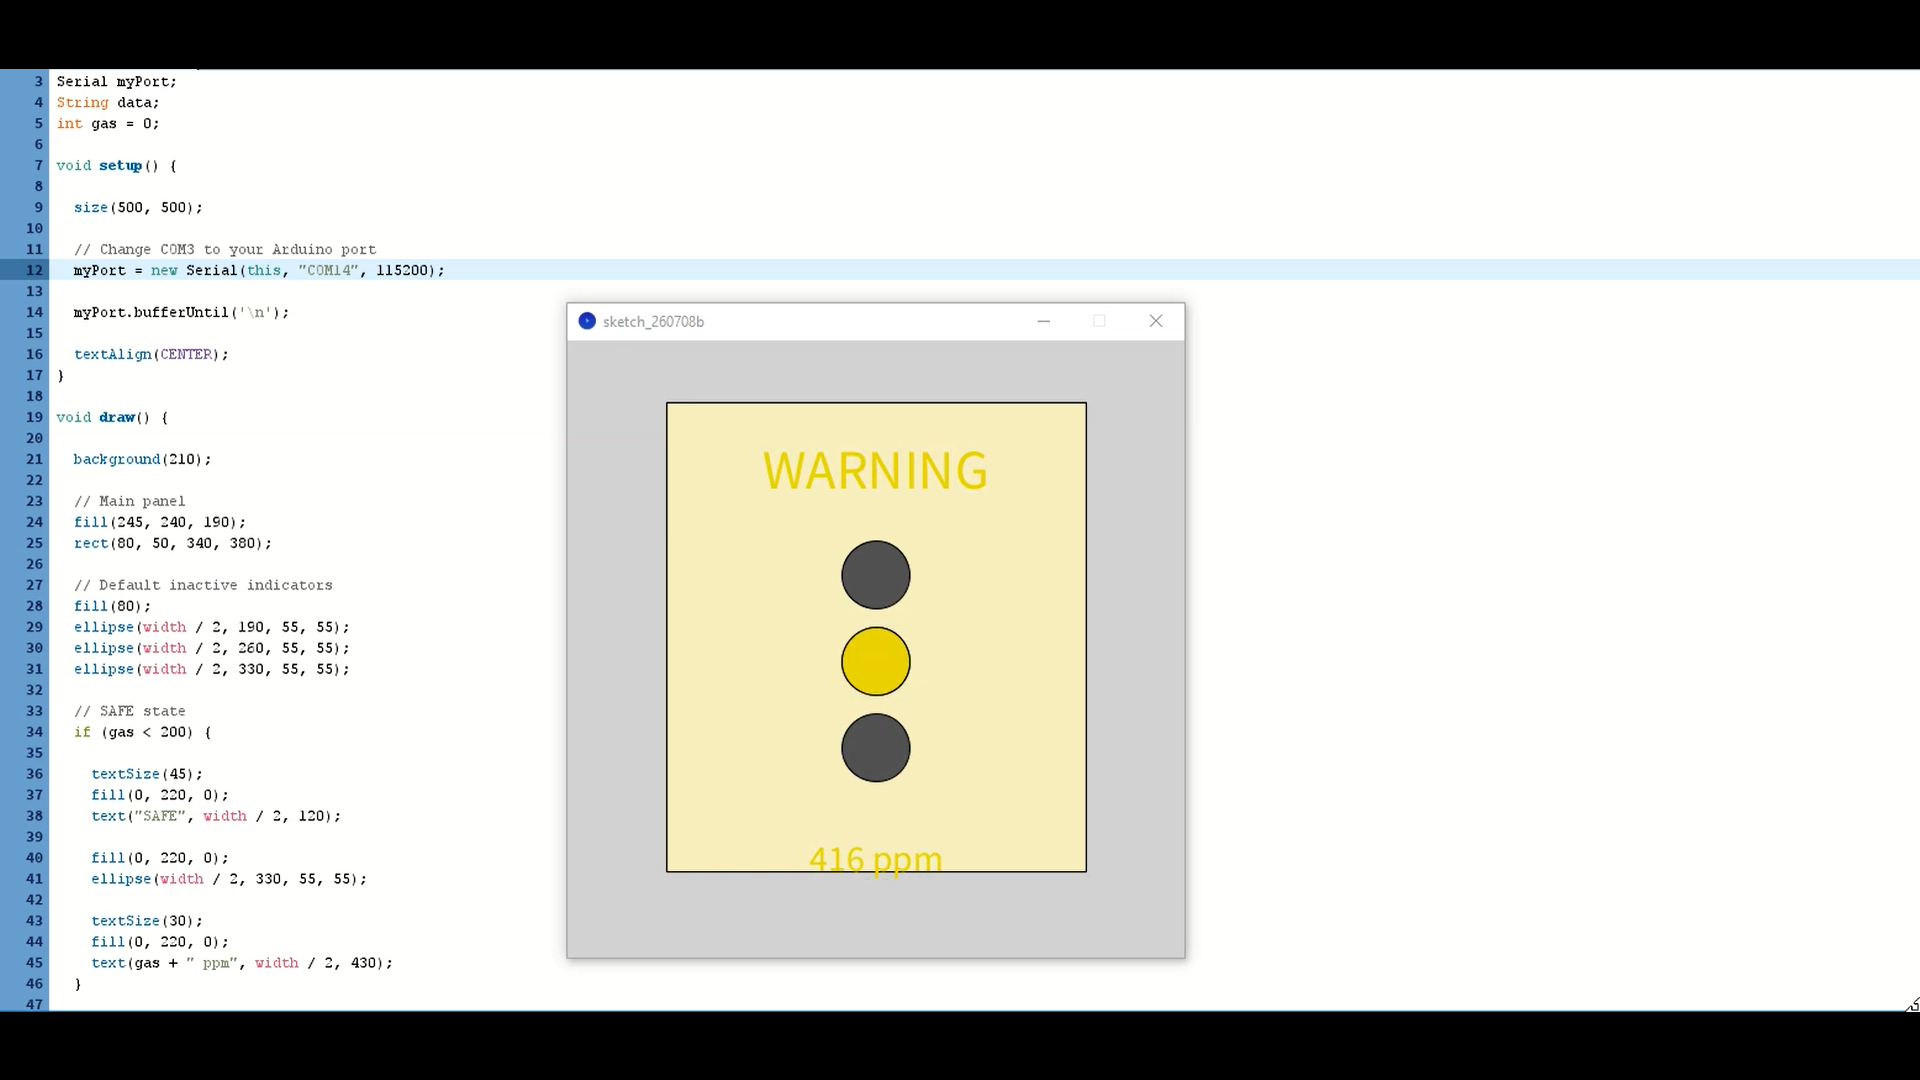
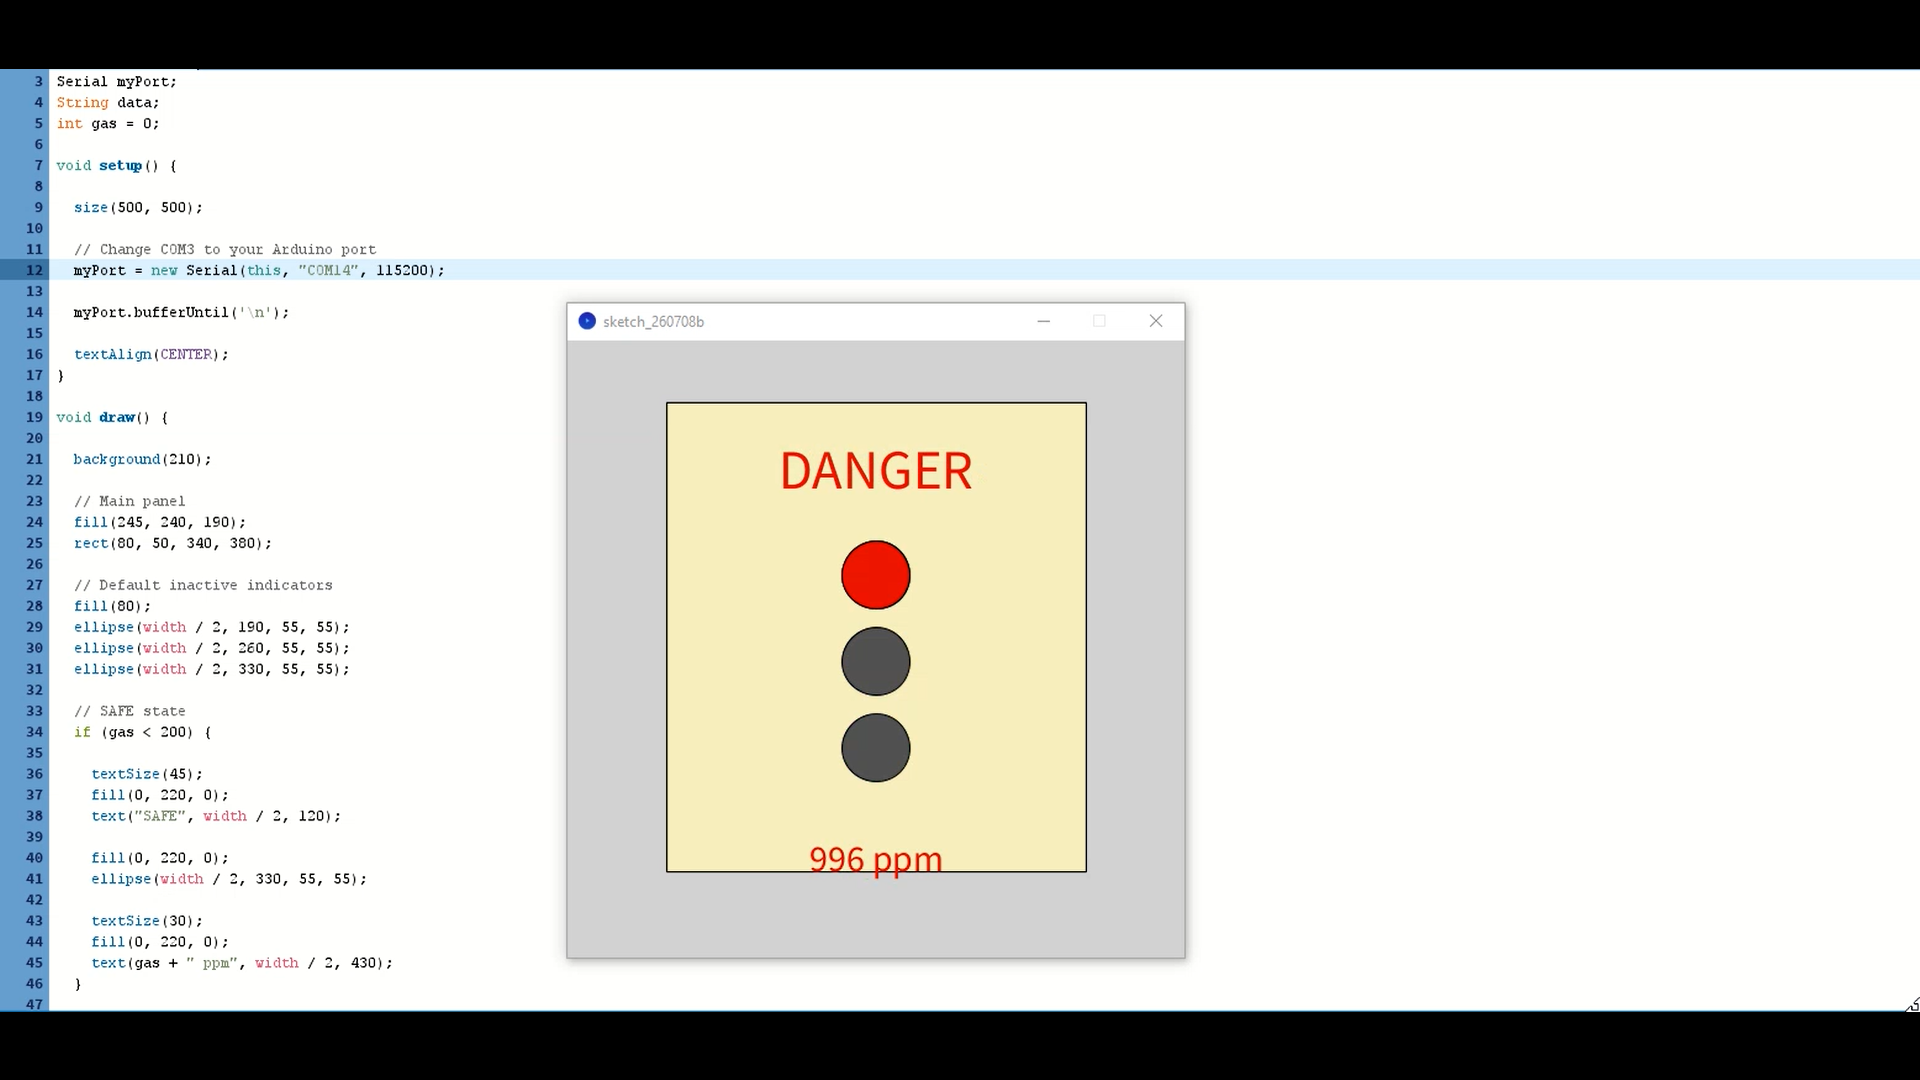
The MQ-7 sensor continuously measures gas concentration and sends numerical values over Serial. Processing reads those values and updates the interface according to three thresholds:
| Gas Value | Status | Color |
|---|---|---|
| 0–199 | SAFE | Green |
| 200–599 | WARNING | Yellow |
| 720+ | DANGER | Red |
Each state changes the warning text, the LED indicator color, and the ppm value’s color together, so the whole panel reacts as one synchronized unit. On the Arduino side, only the raw numeric reading needs to be sent — Serial.println(gas); — which Processing reads and converts directly into an integer.
The interface itself is built from a background panel, three circular LED indicators (drawn with ellipse()), a status text label, and the live ppm value, redrawn every frame based on the current gas reading:
- Below 200 (SAFE): the green LED turns on, “SAFE” appears, and the ppm value turns green.
- 200–599 (WARNING): the yellow LED turns on, “WARNING” appears, and the ppm value turns yellow.
- 720 and above (DANGER): the red LED turns on, “DANGER” appears, and the ppm value turns red.
The Arduino side of this experiment is the same firmware used for the LED + buzzer logic in Week 10:
#define MQ7_PIN A0

#define RED_LED    D1
#define YELLOW_LED D2
#define GREEN_LED  D3
#define BUZZER_PIN D6

void setup() {
  Serial.begin(115200);

  pinMode(RED_LED, OUTPUT);
  pinMode(YELLOW_LED, OUTPUT);
  pinMode(GREEN_LED, OUTPUT);
  pinMode(BUZZER_PIN, OUTPUT);
}

void loop() {
  int gas = analogRead(MQ7_PIN);

  Serial.println(gas);

  digitalWrite(RED_LED, LOW);
  digitalWrite(YELLOW_LED, LOW);
  digitalWrite(GREEN_LED, LOW);
  digitalWrite(BUZZER_PIN, LOW);

  if (gas < 200) {
    digitalWrite(GREEN_LED, HIGH);
    digitalWrite(BUZZER_PIN, LOW);
    delay(300);
  }
  else if (gas < 720) {
    digitalWrite(YELLOW_LED, HIGH);

    digitalWrite(BUZZER_PIN, HIGH);
    delay(300);

    digitalWrite(BUZZER_PIN, LOW);
    delay(300);
  }
  else {
    digitalWrite(RED_LED, HIGH);

    digitalWrite(BUZZER_PIN, HIGH);
    delay(300);
  }
}
And here’s the Processing sketch that reads those values and draws the panel:
import processing.serial.*;

Serial myPort;
String data;
int gas = 0;

void setup() {

  size(500, 500);

  // Change COM3 to your Arduino port
  myPort = new Serial(this, "COM3", 115200);

  myPort.bufferUntil('\n');

  textAlign(CENTER);
}

void draw() {

  background(210);

  // Main panel
  fill(245, 240, 190);
  rect(80, 50, 340, 380);

  // Default inactive indicators
  fill(80);
  ellipse(width / 2, 190, 55, 55);
  ellipse(width / 2, 260, 55, 55);
  ellipse(width / 2, 330, 55, 55);

  // SAFE state
  if (gas < 200) {

    textSize(45);
    fill(0, 220, 0);
    text("SAFE", width / 2, 120);

    fill(0, 220, 0);
    ellipse(width / 2, 330, 55, 55);

    textSize(30);
    fill(0, 220, 0);
    text(gas + " ppm", width / 2, 430);
  }

  // WARNING state
  else if (gas < 720) {

    textSize(45);
    fill(230, 220, 0);
    text("WARNING", width / 2, 120);

    fill(230, 220, 0);
    ellipse(width / 2, 260, 55, 55);

    textSize(30);
    fill(230, 220, 0);
    text(gas + " ppm", width / 2, 430);
  }

  // DANGER state
  else {

    textSize(45);
    fill(220, 0, 0);
    text("DANGER", width / 2, 120);

    fill(220, 0, 0);
    ellipse(width / 2, 190, 55, 55);

    textSize(30);
    fill(220, 0, 0);
    text(gas + " ppm", width / 2, 430);
  }
}

void serialEvent(Serial myPort) {

  data = myPort.readStringUntil('\n');

  if (data != null) {

    data = trim(data);

    gas = int(data);
  }
}
The video below shows the system running for real — Arduino sending live sensor readings, and Processing reacting with color changes and state transitions on the panel:
How the UI Code Is Structured
The Processing sketch is split into three clear parts, each with its own job:
setup()runs once at the start. It opens the window, connects to the serial port (myPort = new Serial(this, "COM3", 115200)), and tells Processing to only process incoming data once a full line ends with\n(myPort.bufferUntil('\n')).serialEvent()is the communication part. It’s called automatically whenever a new line of serial data arrives from the board, reads it, trims it, and converts it into thegasinteger variable. This is the only place where the sketch actually talks to the hardware.draw()is the visualization part, running continuously ~60 times per second regardless of whether new data has arrived. It reads the current value ofgasand redraws the panel — background, LED indicators, status text, and ppm value — choosing colors and text based on which thresholdgasfalls into.
This separation means the communication code (serialEvent) and the visualization code (draw) don’t interfere with each other: new sensor readings update the gas variable in the background, and the interface simply reads whatever that variable currently holds on every frame.
Hardware
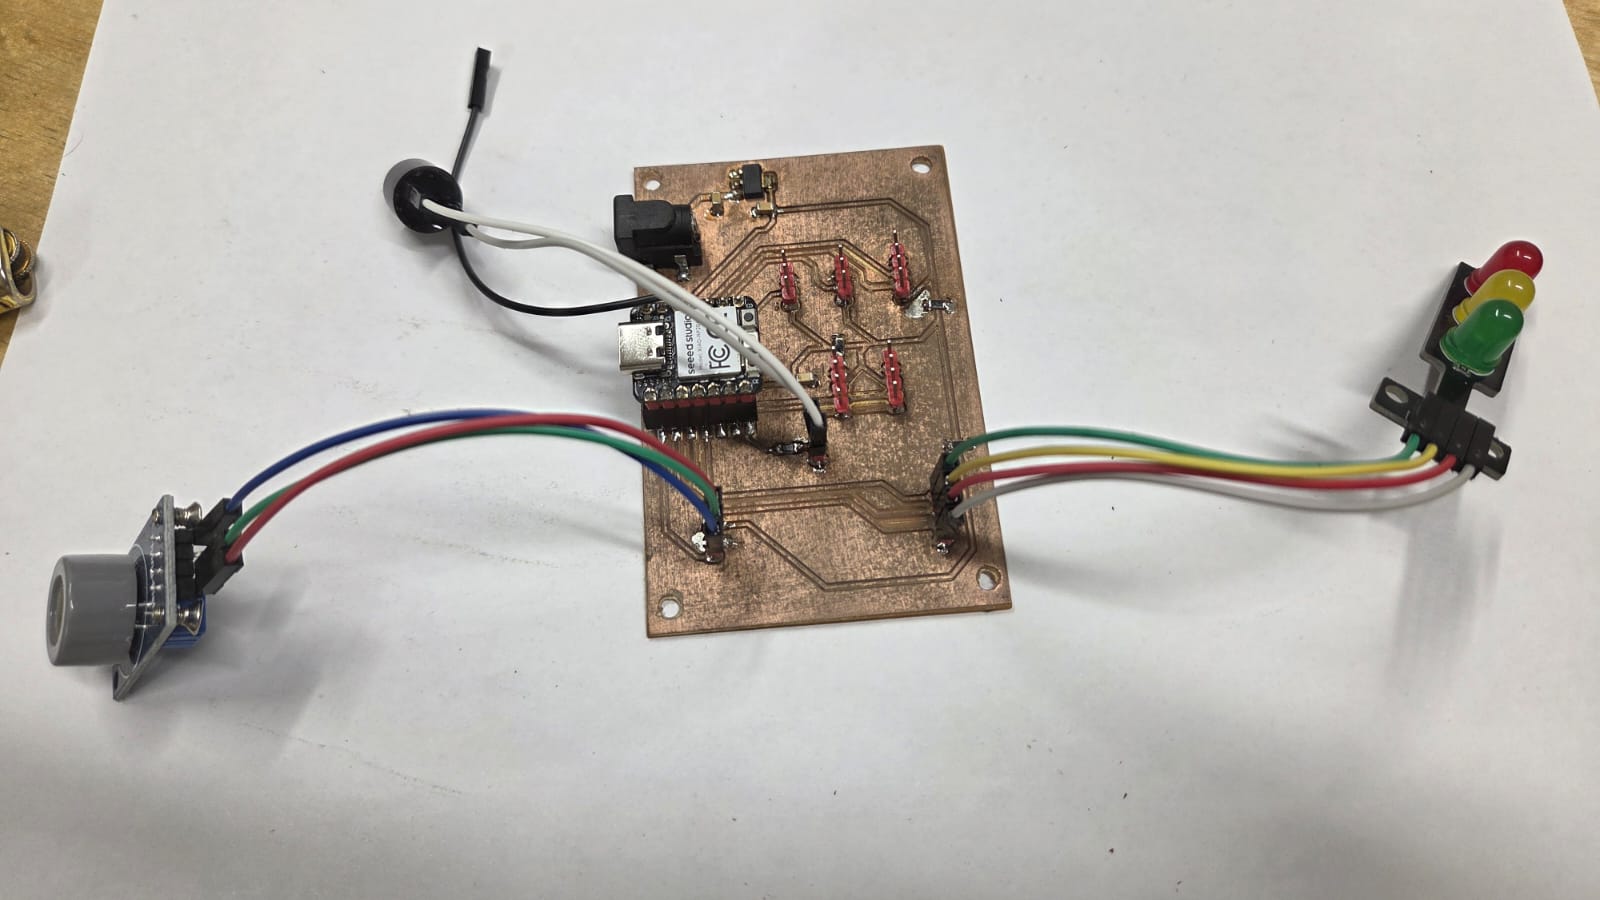
The hardware used in this assignment is my custom XIAO RP2040 PCB with the MQ-7 gas sensor, red/yellow/green status LEDs, and buzzer — the same board designed and documented in Week 10, which also has the full wiring diagram and schematic.
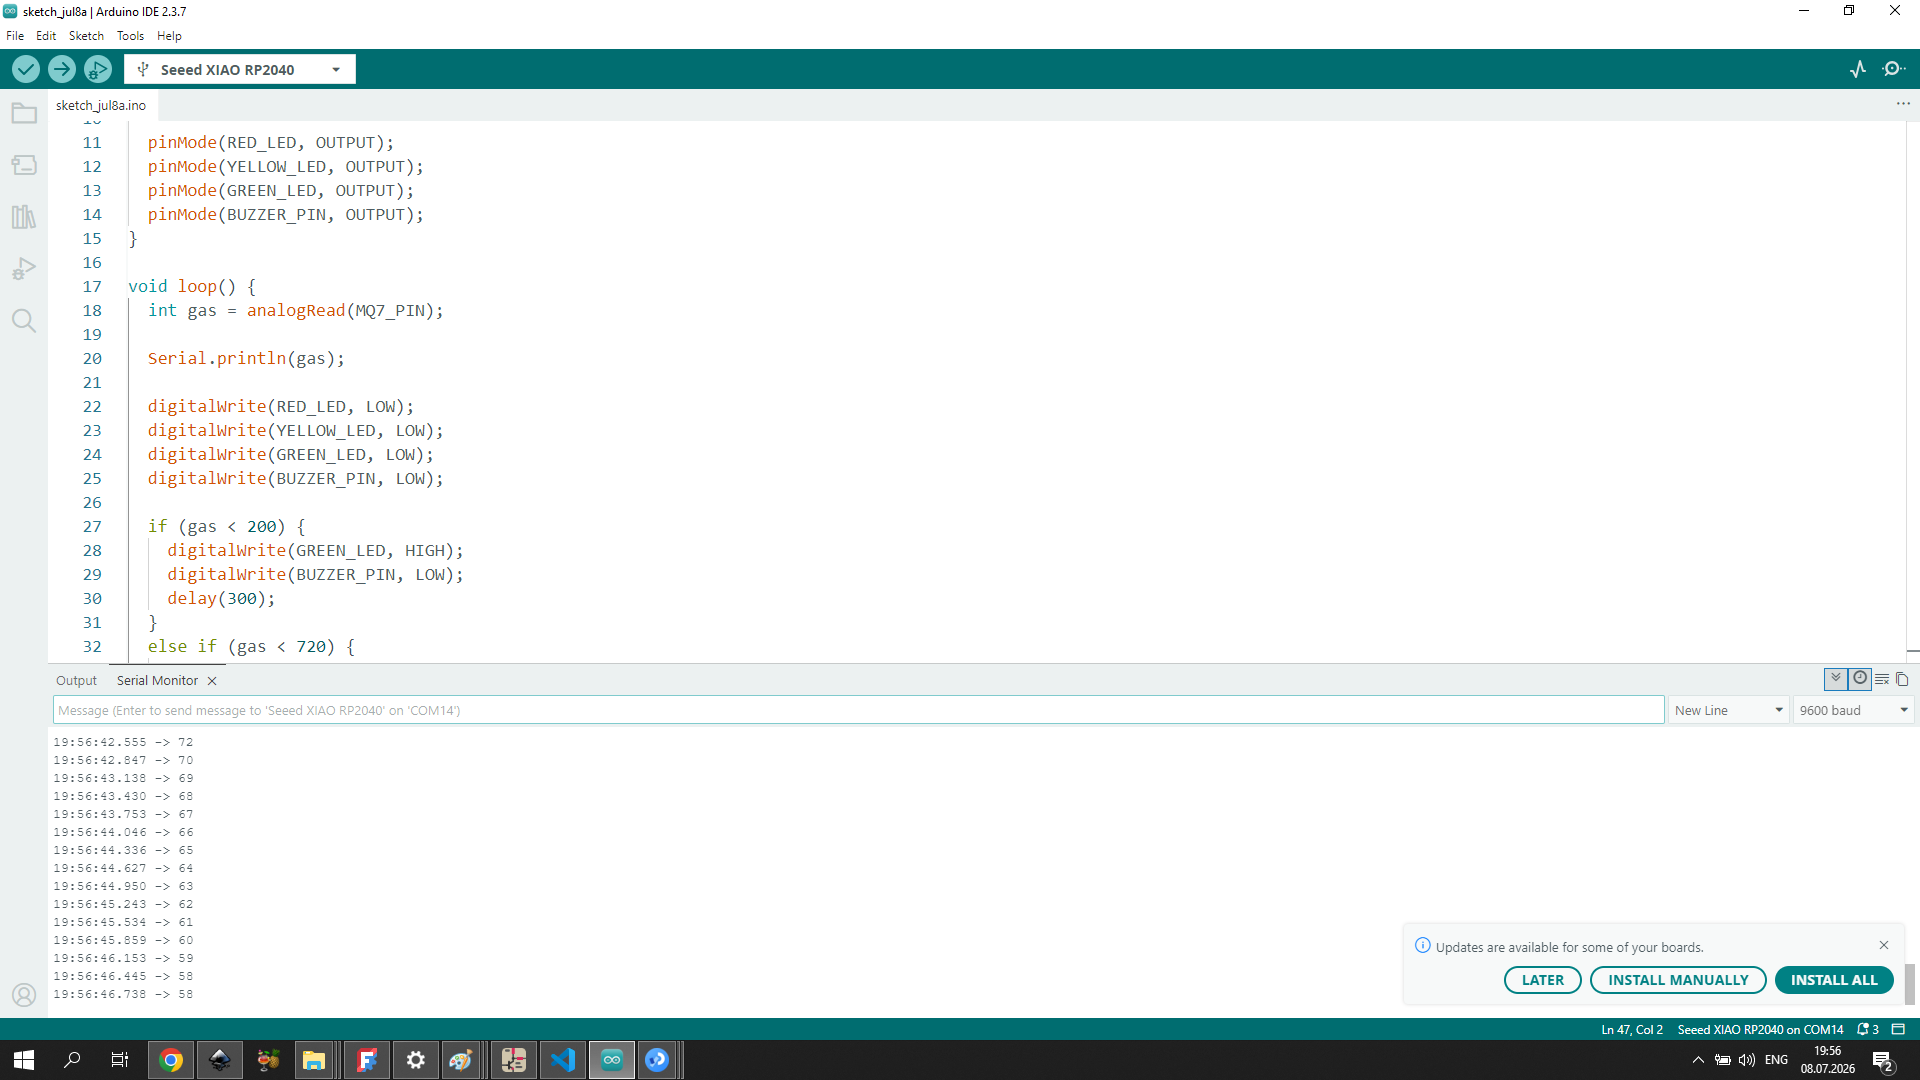
Below is the Arduino IDE Serial Monitor showing the live gas readings coming from the board over Serial, the same values Processing reads to drive the visualization:
And here is the Processing sketch running in the code editor, showing all three interface states as the gas reading changes:
Connection to My Final Project
This experiment connects directly to my Final Project idea: a smart environmental monitoring system for workshop and forge safety, built around the MQ-7 gas sensor.
Through this Processing visualization, I could simulate how dangerous gas levels would be monitored visually in real time — the interface reacting dynamically to sensor data with warning colors, status indicators, live gas values, and danger notifications.
By this point I had already designed the electronics and the core sensor logic in previous weeks, so this was a chance to test and expand that already-working hardware with a real-time visualization layer, and to get a feel for how the complete system might behave once it’s actually monitoring an environment. The same logic and visualization principles built here will carry over into the Final Project, where the system will monitor environmental conditions and react automatically depending on gas concentration levels — combining sensor monitoring, visualization, warning states, and interactive feedback into one workflow.
Results
The first experiment confirmed how Processing and Arduino talk to each other over Serial, and how software can control hardware in real time — a useful basic test of the communication link between my PCB and the computer.
The second experiment turned that same link into a working real-time monitoring interface: colors, warning states, and the live ppm value all update together based on the sensor data coming from Arduino. Beyond the serial communication itself, it gave me a clearer sense of how raw sensor data can be turned into something genuinely easier to read at a glance — useful both for this assignment and for how I’ll eventually want my Final Project’s monitoring system to communicate gas levels to whoever’s using it.
Problems and Solutions
I didn’t run into any major issues while building either experiment. Because the Arduino-side firmware for the second experiment was already working and tested back in Week 10, I could focus this week purely on the Processing side — reading serial data correctly and mapping it to the visual interface — without having to debug the hardware or sensor logic again.
Reflection
This week helped me better understand the relationship between software interfaces and embedded electronics. Through both experiments, I learned how real-time communication between hardware and software can be used to build interactive monitoring systems — the first experiment for the basics of Serial Communication and hardware control through Processing, and the second for connecting that directly to my Final Project, turning sensor data into a visual environmental monitoring system. This workflow became an important step toward a smarter, more interactive safety system for my Final Project.