9. Input devices
Group Assignment
This week’s task was to probe an input device’s analog and digital signals using an oscilloscope. Under the guidance of Onik Babajanyan, we measured signals from input devices connected to our PCB.
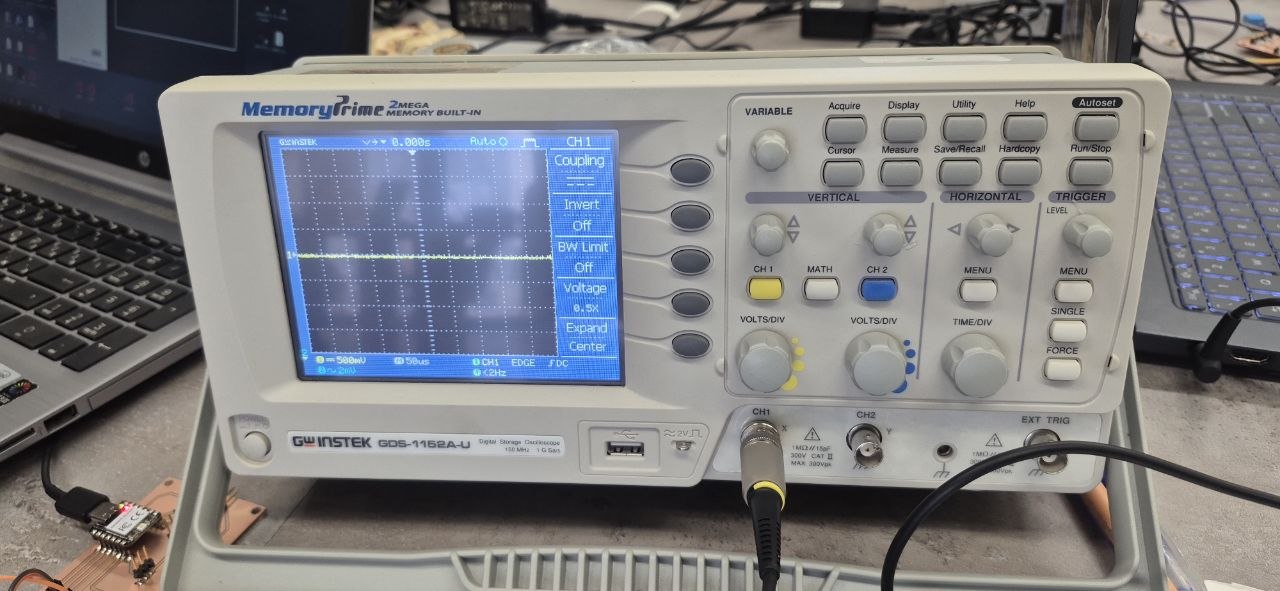
We applied voltage to the analog pin of a potentiometer. As we rotated it, the waveform rose and fell smoothly in proportion to the movement — a continuous, gradual change.
Next we connected the oscilloscope to the digital pin of a photoresistor. Switching the light on and off produced sharp, immediate transitions — the signal jumping between high and low with no in-between.
We repeated the light test on the analog pin instead, and this time the transitions were smooth, similar to the potentiometer behavior.
Analog signals change continuously, reflecting gradual shifts in input, while digital signals switch abruptly between two discrete states. Seeing both behaviors on the oscilloscope made the difference concrete rather than just theoretical.
Individual Assignment
In this assignment, I explored the difference between analog and digital signals using a potentiometer connected to my custom PCB based on the Seeed XIAO RP2040.
An analog signal is continuous and can take any value within a range, while a digital signal only has two states — HIGH (ON) or LOW (OFF). The LED in this project works using digital control, while the potentiometer gave me a simple way to generate and observe an analog signal directly.
With the potentiometer turned to its minimum position, the reading was close to 0; at the middle position, it sat around 500; and at the maximum position, it reached close to 1023.
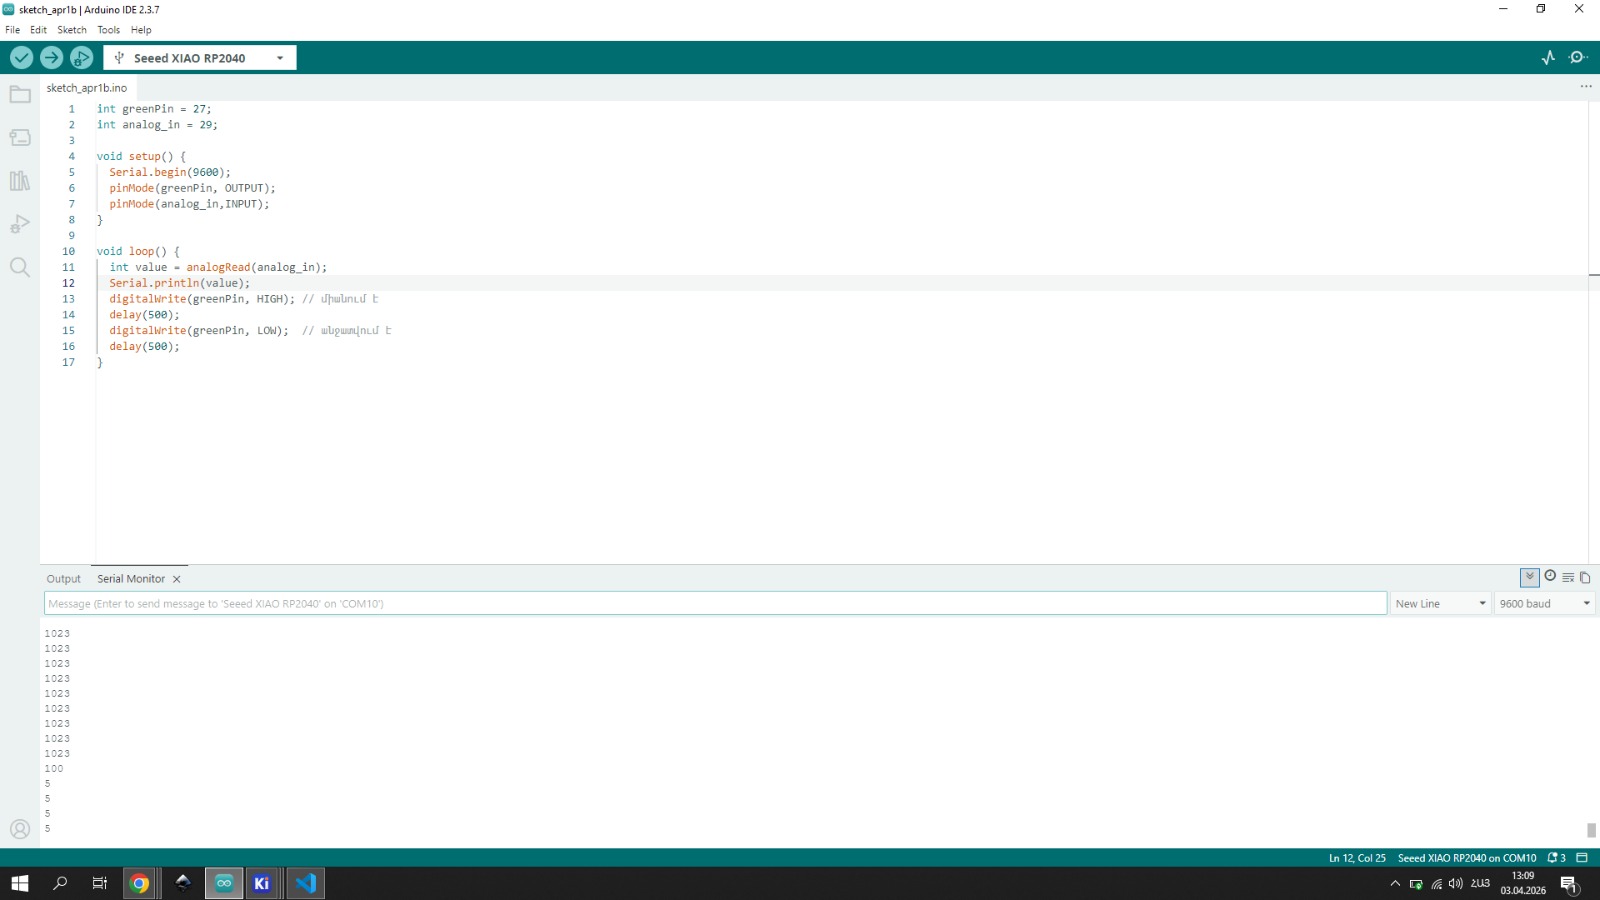
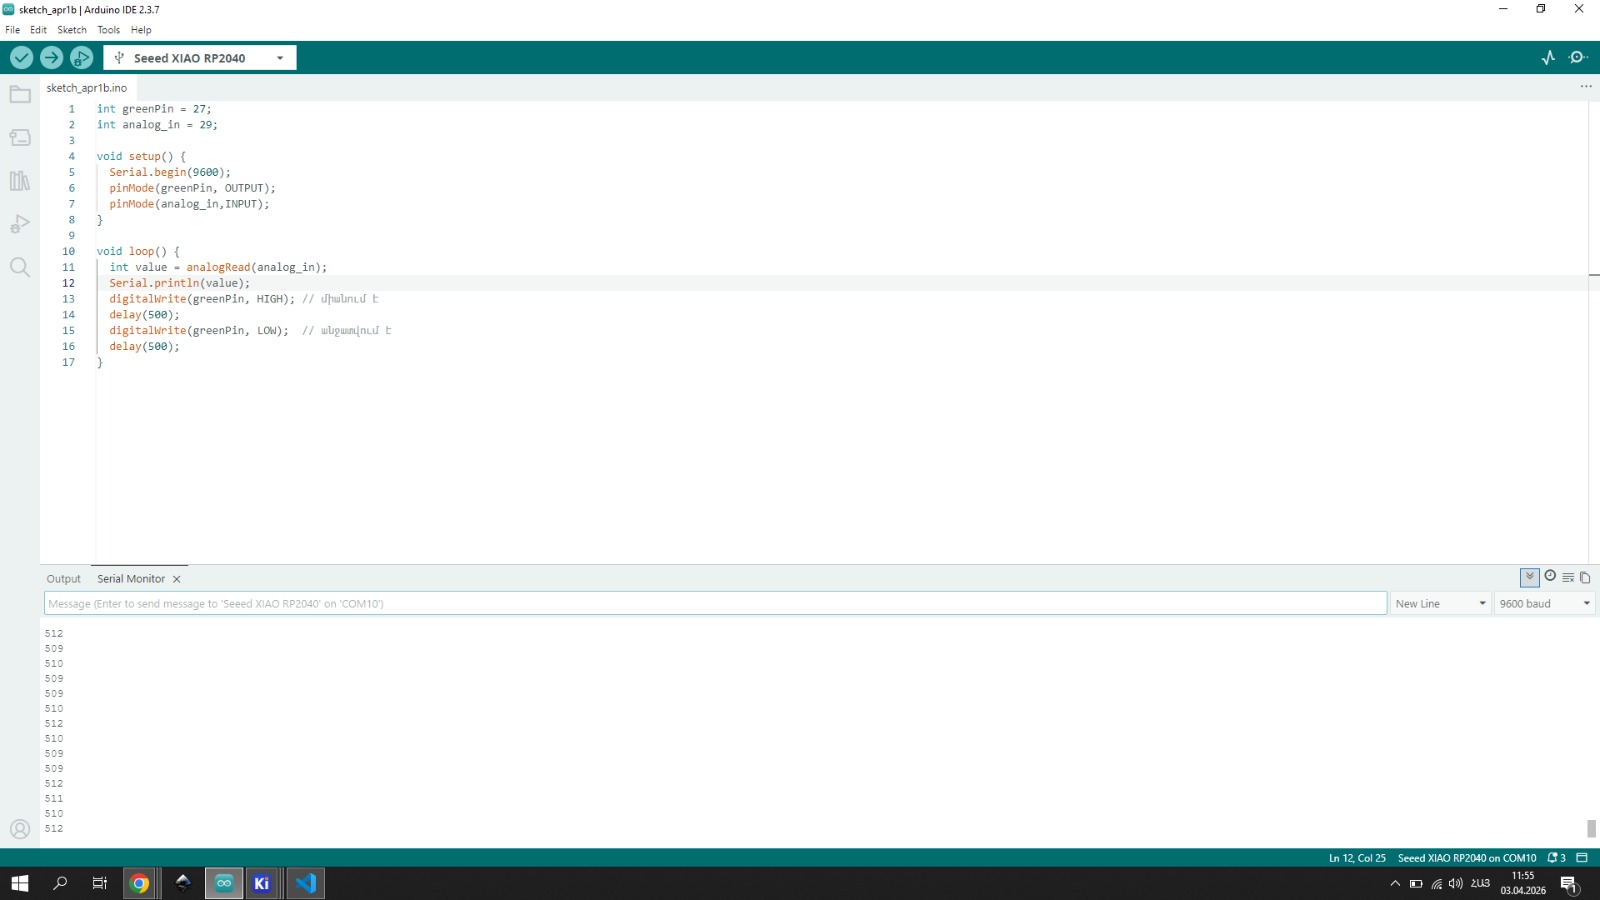
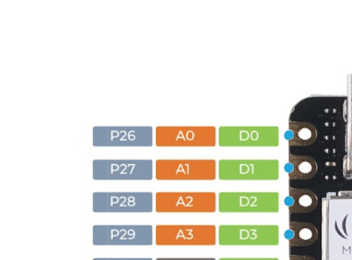
The Seeed XIAO RP2040 supports both analog and digital input/output, with four analog-capable pins: A0 (GPIO 26), A1 (GPIO 27), A2 (GPIO 28), and A3 (GPIO 29). For this experiment, I used A0.
Potentiometer Wiring
The wiring diagram below was created using the same SVG diagram tool used in Week 2 for the Smart Workshop block diagram.
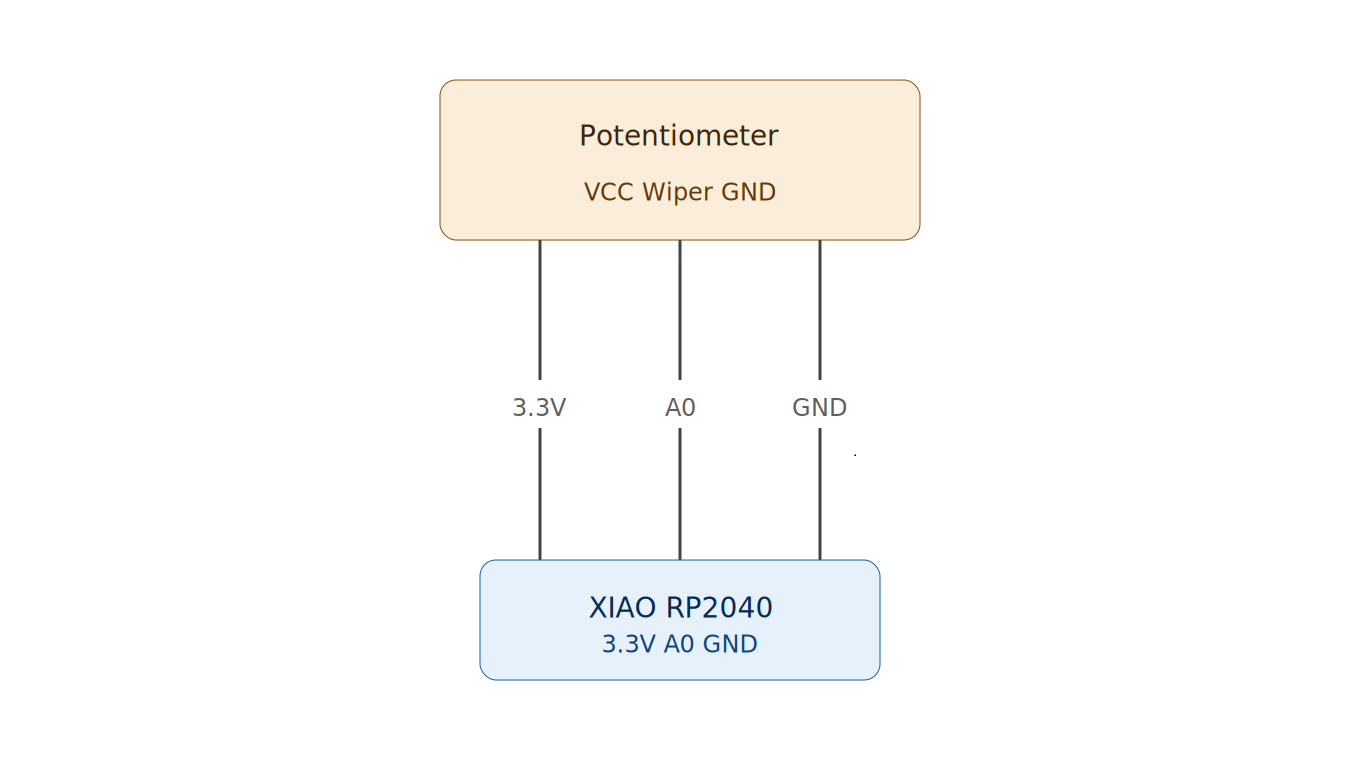
Internally, the potentiometer’s voltage is converted into a digital value by the microcontroller’s ADC (Analog to Digital Converter): 0V reads as 0, around 1.65V reads as roughly 512, and the full 3.3V reads as 1023.
AI prompt used: “Write Arduino code for XIAO RP2040 that reads a potentiometer on pin A0 and prints the raw value to the Serial Monitor.”
int value = analogRead(26);  // read analog value from A0 (GPIO26)
Serial.println(value);        // print to Serial Monitor
Sensor Integration
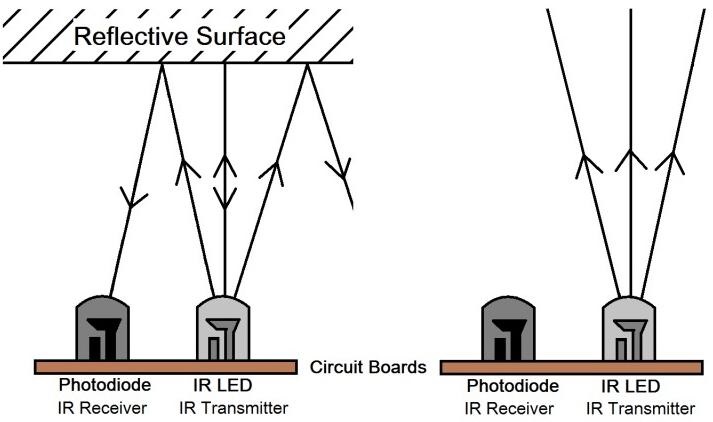
After getting comfortable with the potentiometer, I moved on to testing an actual sensor: an infrared obstacle detection sensor, which detects the presence of an object in front of it.
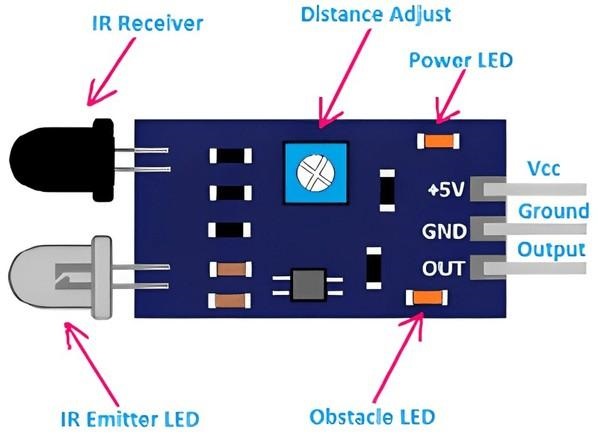
The sensor was connected to my custom PCB using three pins — VCC → 3.3V, GND → GND, and OUT → GPIO pin — which let the microcontroller read a digital signal from it. The board used here is the one designed in Week 6 and milled in Week 8.
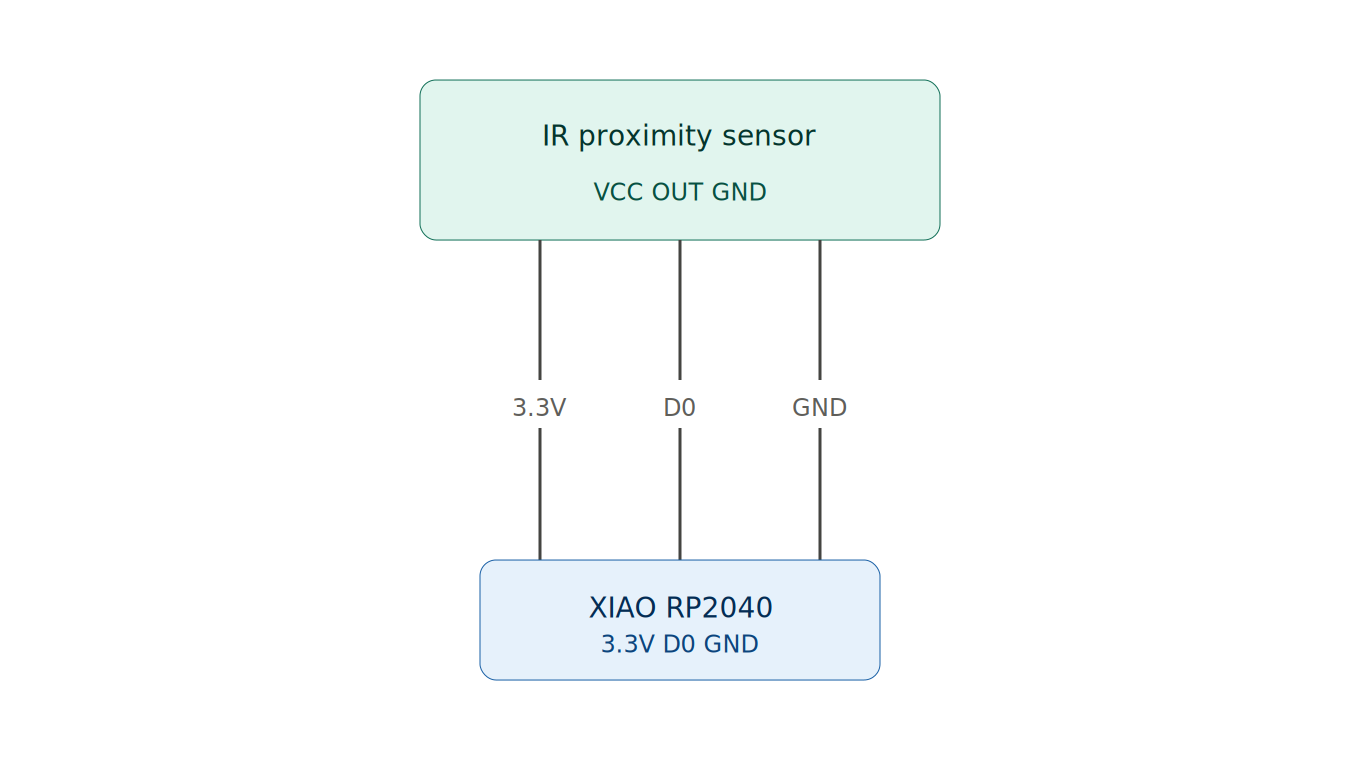
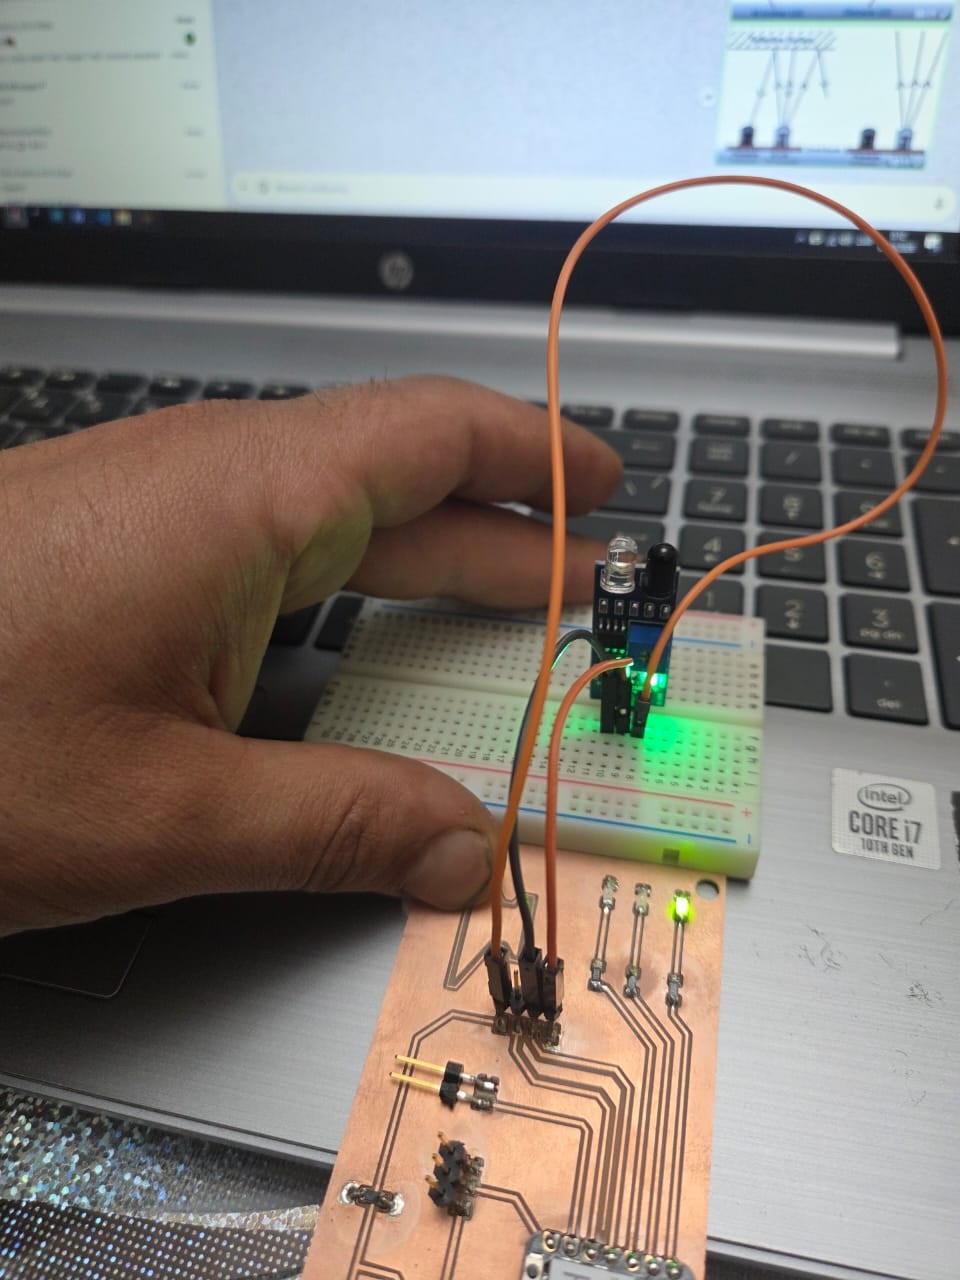
Based on this sensor input, I wrote code to define a clear system behavior, with two main states: a normal state, where the green LED stays on, and a detection state, where the yellow and red LEDs activate and blink.
AI prompt used: “Write Arduino code for XIAO RP2040 that reads a digital IR obstacle sensor on D0. Keep the green LED on D3 on by default. When the sensor detects an object, turn off green and blink yellow (D2) and red (D1) alternately every 200ms.”
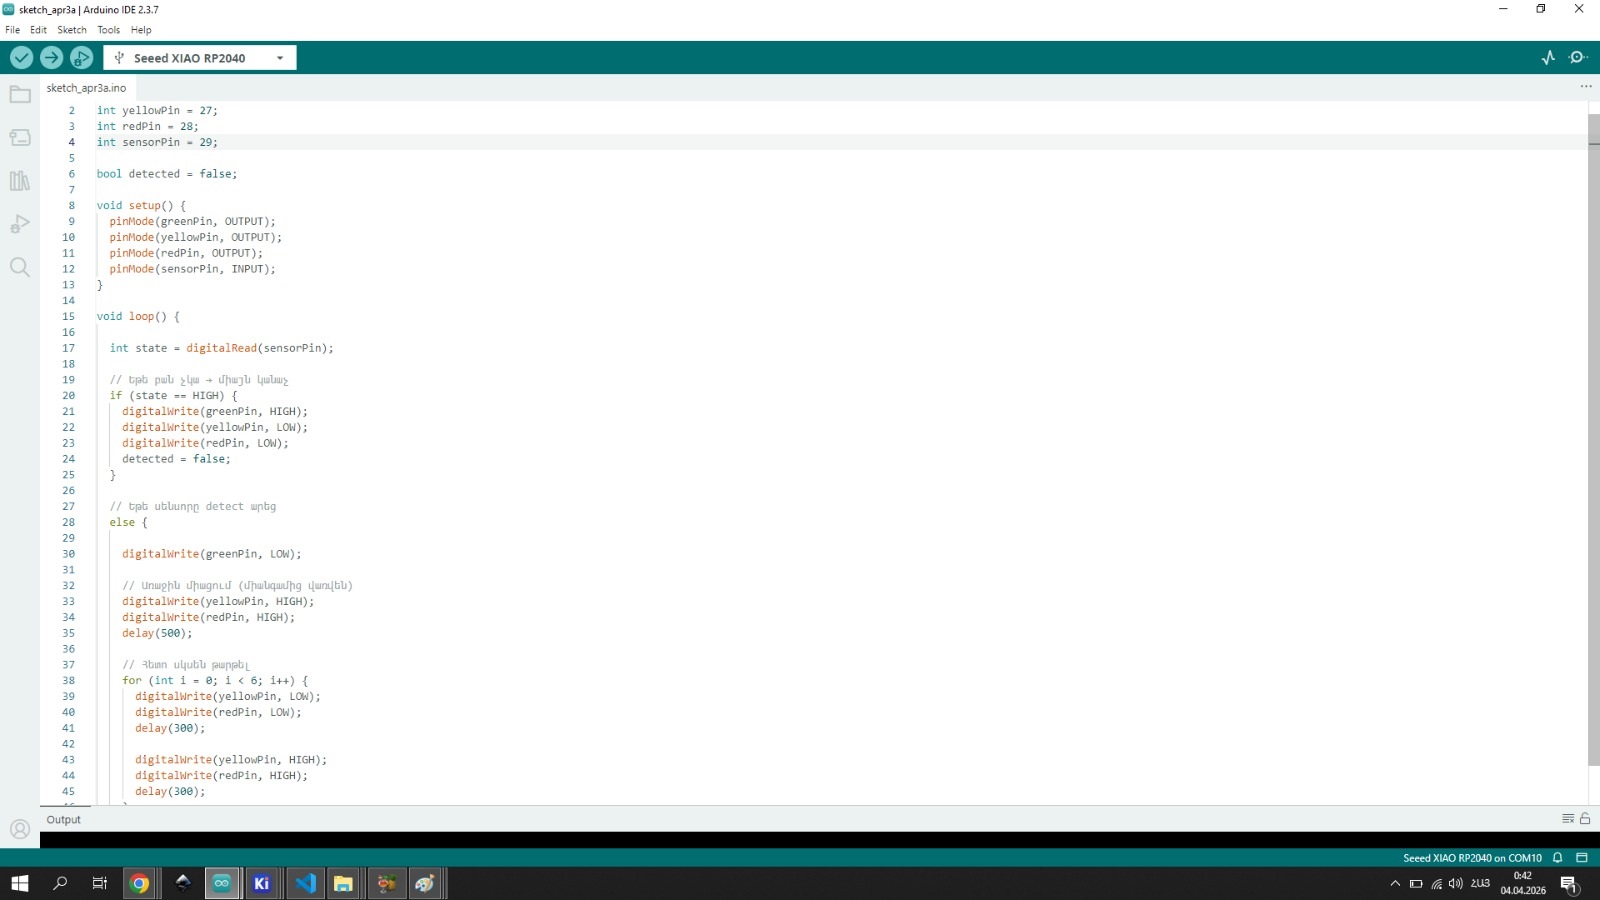
In normal conditions, the system stays in this safe state with the green LED on. As soon as the sensor detects an object, it switches state: the green LED turns off, and the yellow and red LEDs turn on and start blinking to indicate an alert.
The video below shows this behavior in real time:
Additional Sensor Testing
To get more practice with different types of input devices, I also tested an HC-SR505 PIR Motion Sensor and an MQ-7 Gas Sensor.
The MQ-7 is especially relevant for me, since it’s the sensor I plan to use in my Final Project. My project is meant to improve safety in a blacksmith workshop, so understanding the gas sensor’s behavior now — before integrating it into the final system — was a good opportunity to verify how it actually works.
HC-SR505 PIR Motion Sensor
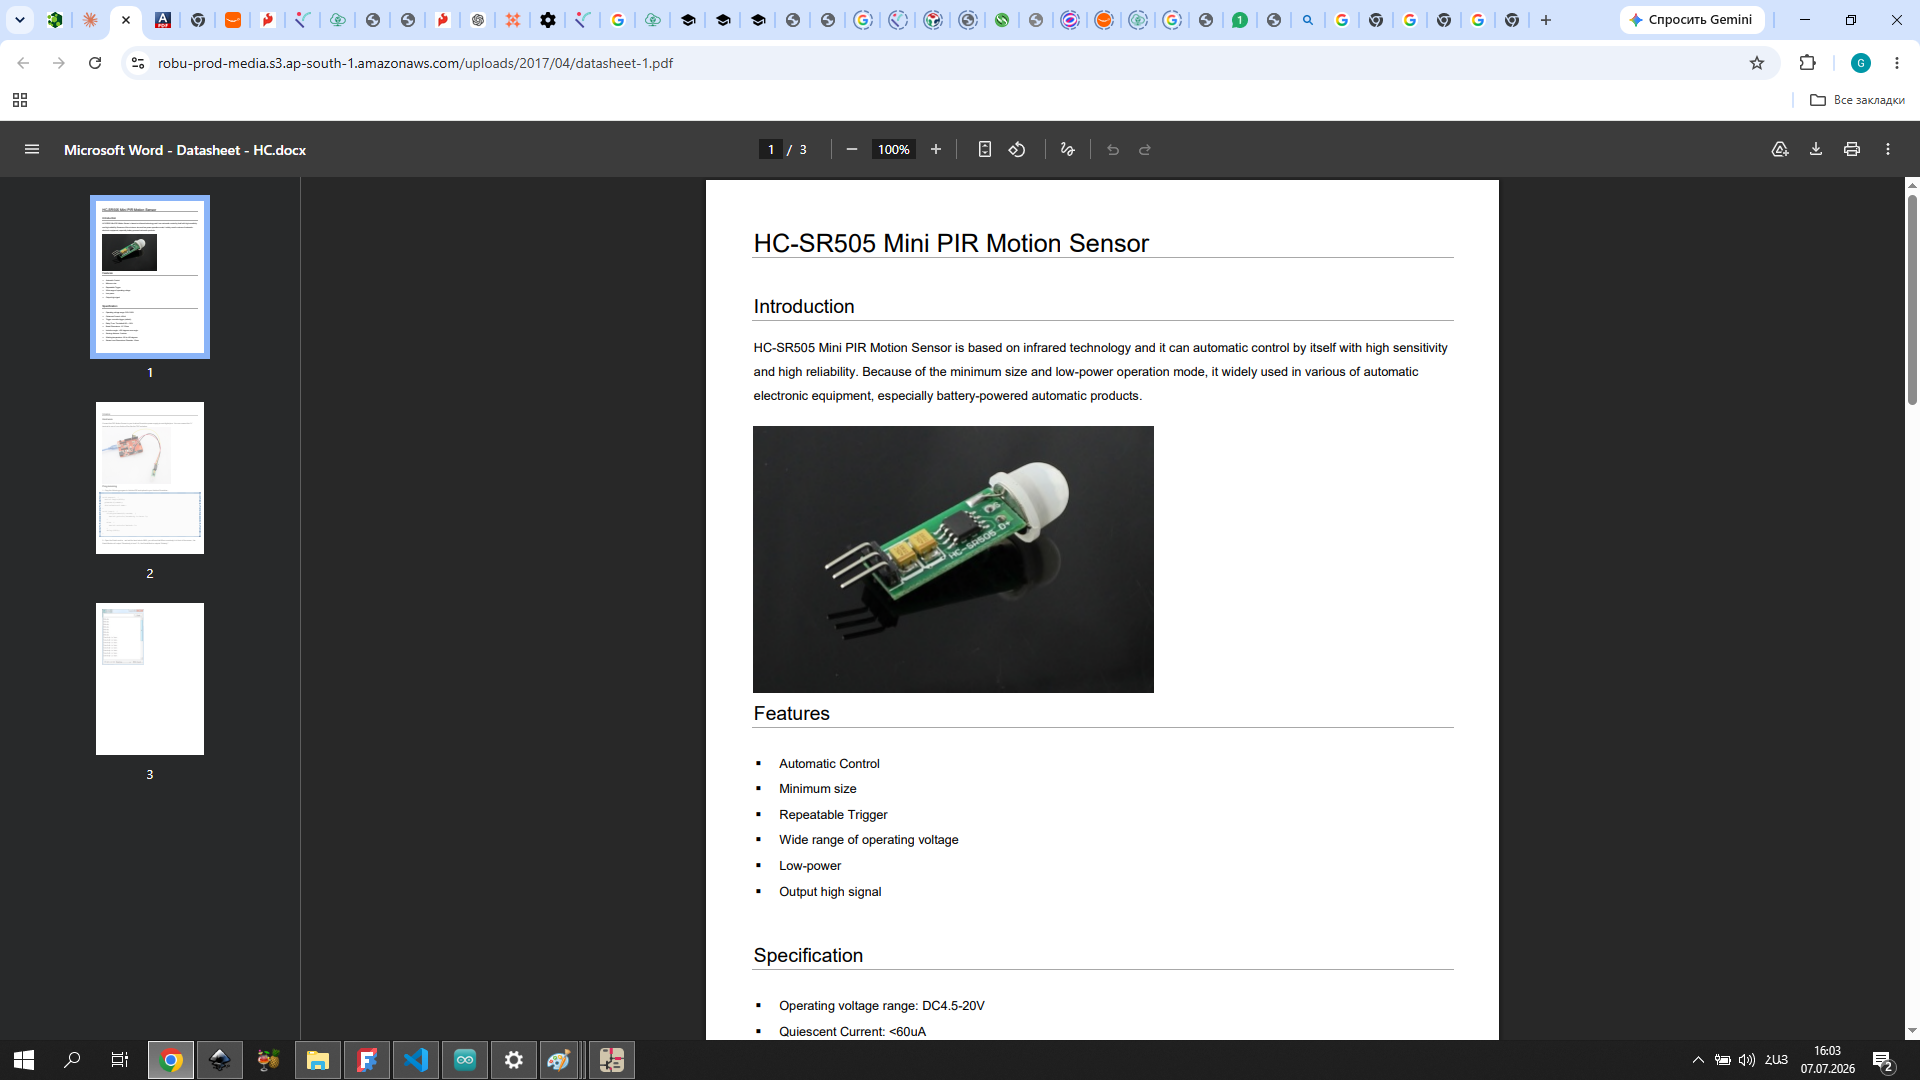
The HC-SR505 is a compact passive infrared (PIR) motion sensor that detects movement by measuring changes in infrared radiation emitted by people or animals.
Working principle: All objects with a temperature above absolute zero emit infrared radiation. The HC-SR505 has a pyroelectric sensor that detects changes in IR radiation level — when a person or animal moves through its field of view, the sensor picks up the change and outputs a HIGH signal for approximately 8 seconds before returning LOW.
Datasheet: HC-SR505 Datasheet PDF
Purchase: HC-SR505 on Amazon | HC-SR505 on AliExpress
| Parameter | Value |
|---|---|
| Operating voltage | 4.5V – 20V |
| Quiescent current | < 60 µA |
| Output signal | HIGH 3.3V / LOW 0V |
| Detection distance | up to 3 meters |
| Detection angle | < 100° |
| Delay time | ~8 seconds |
| Dimensions | 10 × 23 mm |
I connected it the same way as the obstacle sensor — VCC → 3.3V, GND → GND, OUT → GPIO pin.
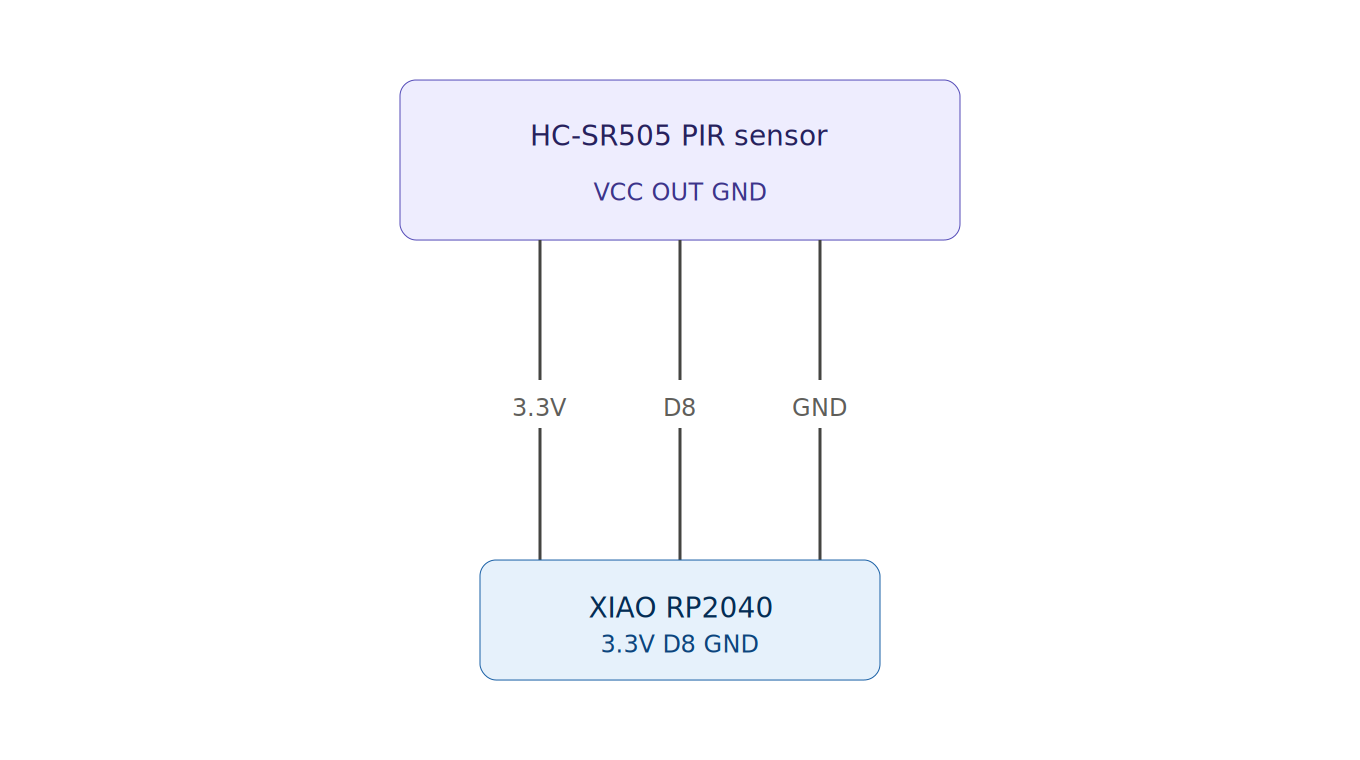
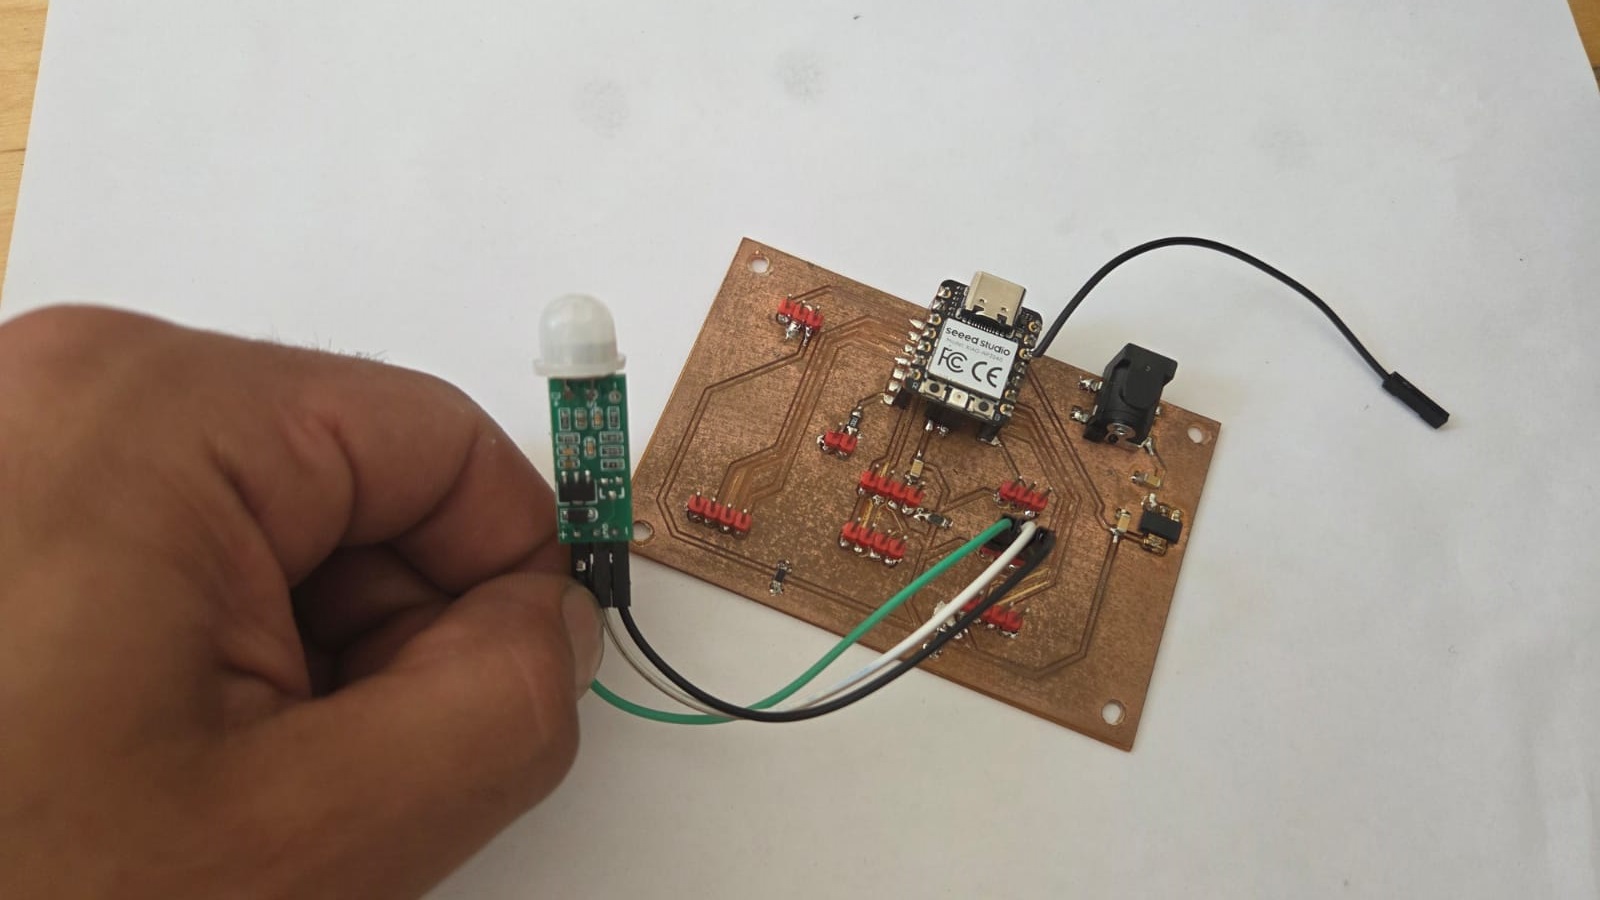
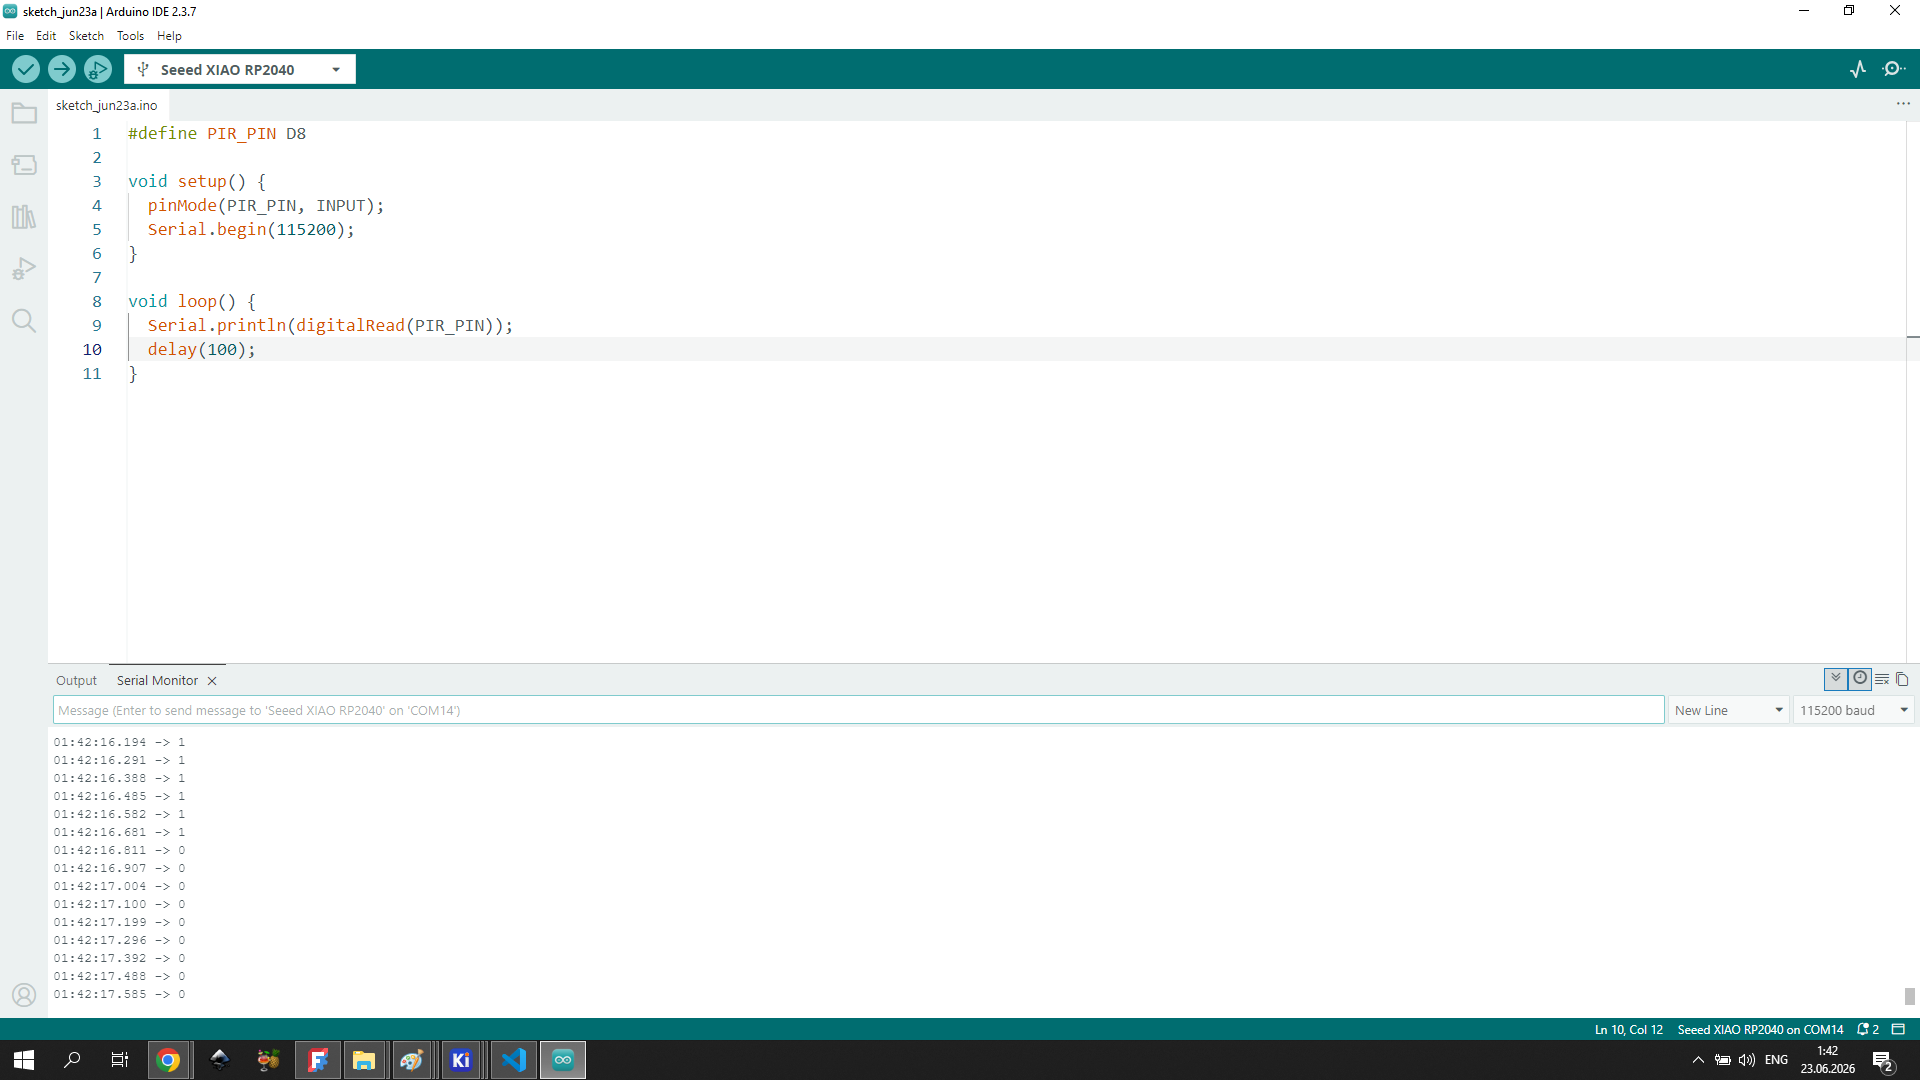
AI prompt used: “Write Arduino code for XIAO RP2040 that reads an HC-SR505 PIR motion sensor on pin D8 and prints 1 or 0 to the Serial Monitor depending on whether motion is detected.”
#define PIR_PIN D8  // PIR sensor output connected to D8

void setup() {
  pinMode(PIR_PIN, INPUT);   // set D8 as digital input
  Serial.begin(115200);       // start serial communication
}

void loop() {
  Serial.println(digitalRead(PIR_PIN));  // 1 = motion detected, 0 = no motion
  delay(100);
}
The sensor successfully detected motion, and the results showed up correctly in the Serial Monitor — 1 when motion detected, 0 when clear. One thing I noticed during testing is that it didn’t reliably pick up small hand movements close to the sensor, but it responded much better when a person actually walked through its field of view.
MQ-7 Gas Sensor
The MQ-7 is a gas sensor designed to detect carbon monoxide (CO), with both analog and digital outputs. Since this is the sensor going into my Final Project, I wanted to see how its output actually changes as gas concentration changes.
Working principle: The MQ-7 uses a tin dioxide (SnO₂) sensing element. In clean air, SnO₂ has high resistance. When CO molecules contact the surface, the resistance drops — the analog output voltage rises as CO concentration increases. The sensor requires a warm-up period after power-on before readings are reliable.
Datasheet: MQ-7 Datasheet — SparkFun
Purchase: MQ-7 on SparkFun | MQ-7 on Amazon
| Parameter | Value |
|---|---|
| Operating voltage | 5V |
| Detection gas | Carbon monoxide (CO) |
| Detection range | 20 – 2000 ppm |
| Output | Analog (AOUT) + Digital (DOUT) |
| Preheat time | ≥ 24 hours (first use) |
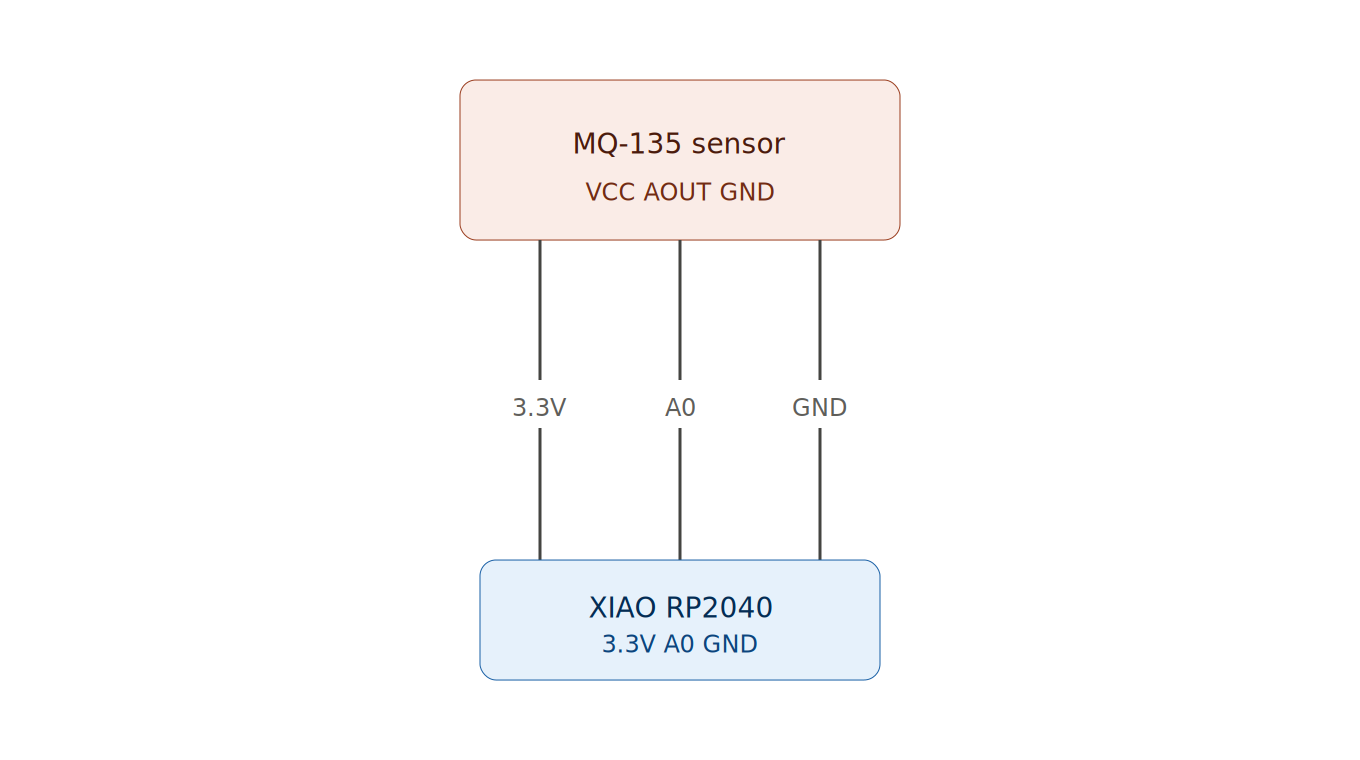
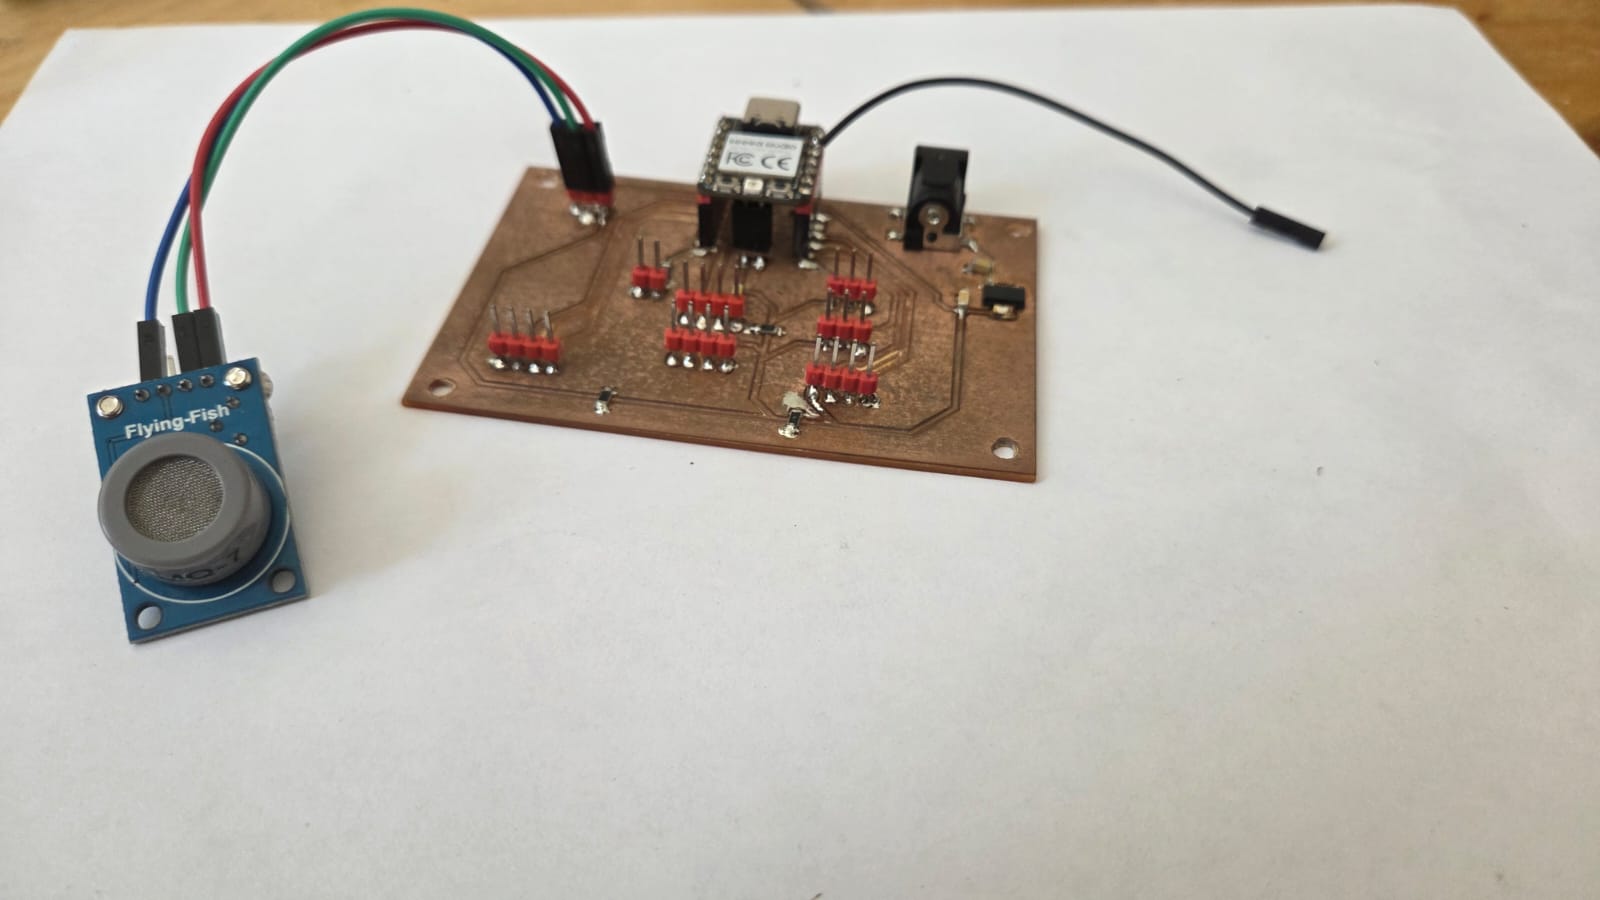
In the first test, I just read the raw analog value:
AI prompt used: “Write Arduino code for XIAO RP2040 that reads an MQ-7 gas sensor on pin A0 and prints the raw ADC value to the Serial Monitor every 500ms.”
#define MQ7_PIN A0  // MQ-7 analog output connected to A0

void setup() {
  Serial.begin(115200);  // start serial at high baud rate
}

void loop() {
  int gas = analogRead(MQ7_PIN);  // read 12-bit ADC value (0-4095)

  Serial.print("Raw Value: ");
  Serial.println(gas);  // higher value = more CO

  delay(500);
}
The Serial Monitor shows the raw ADC values rising as gas concentration increases — starting around 228 in clean air, then climbing to 625 and beyond when gas is introduced:
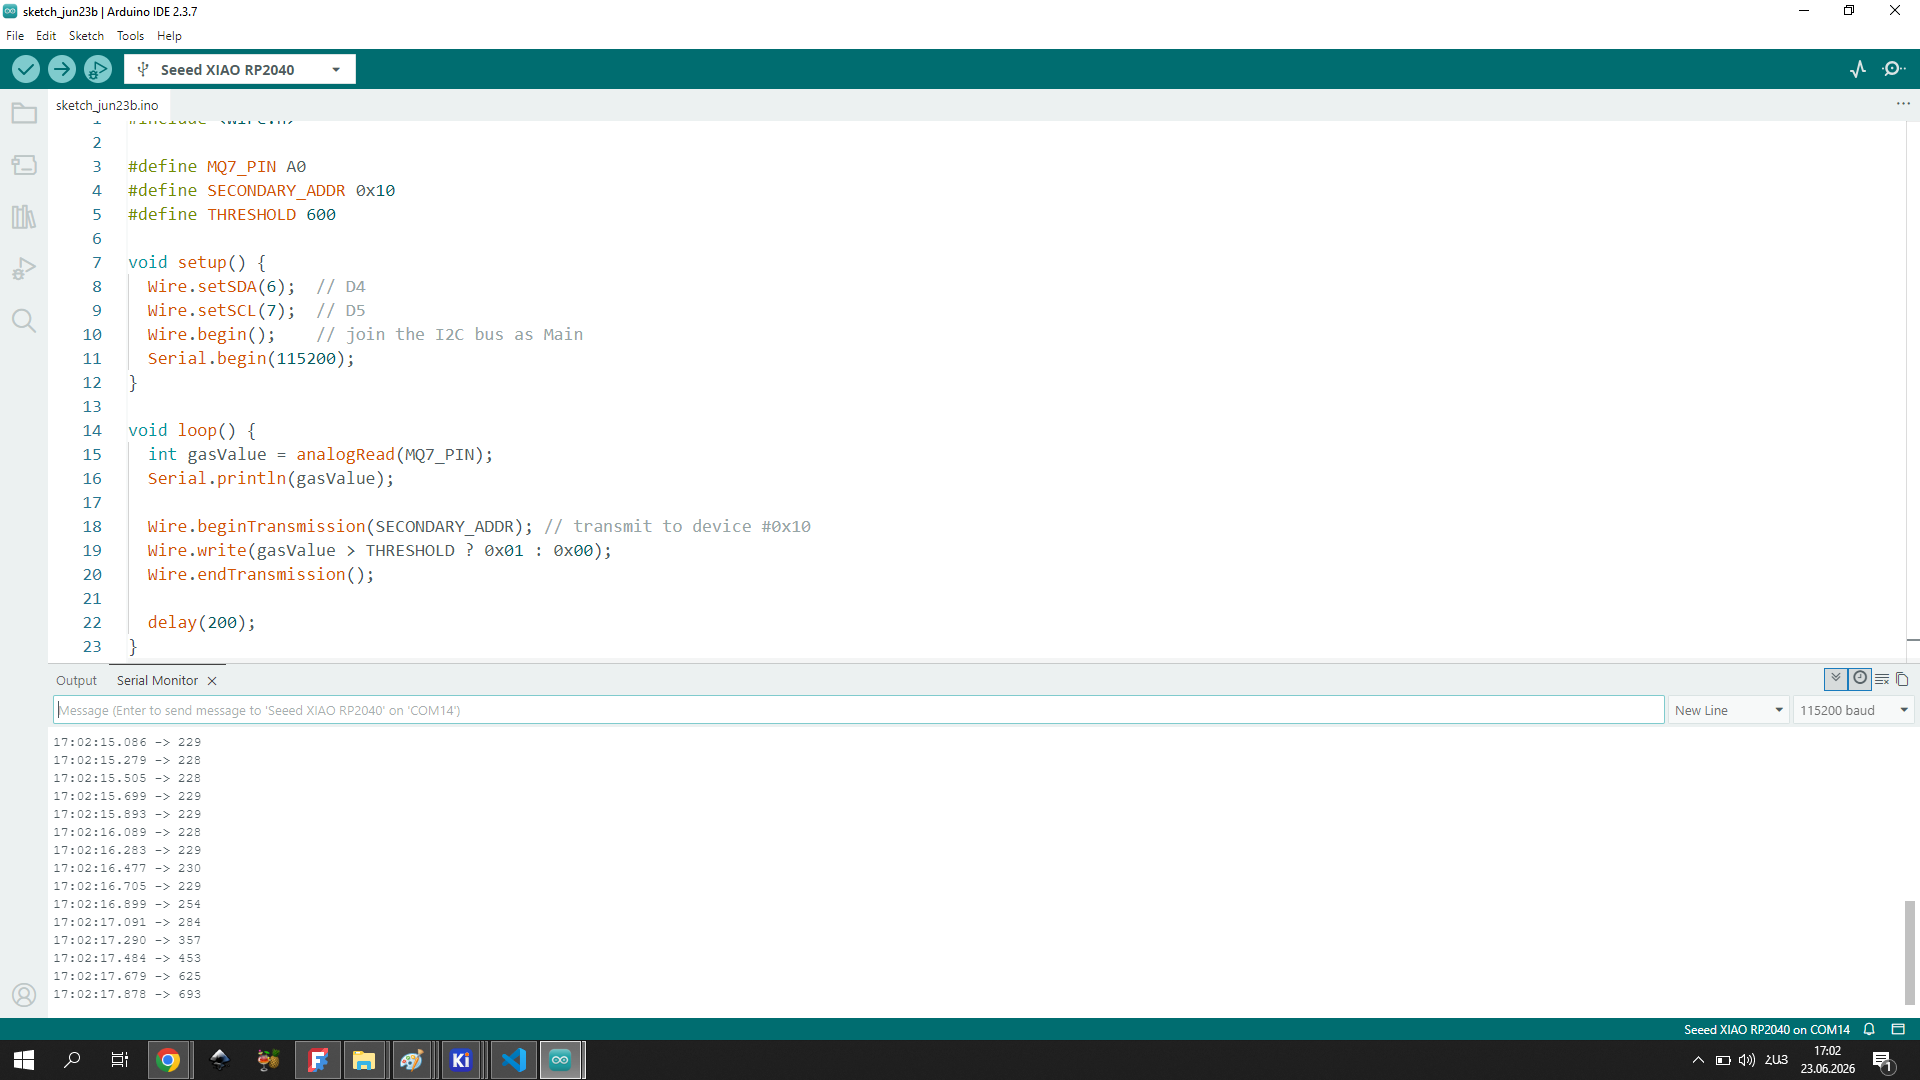
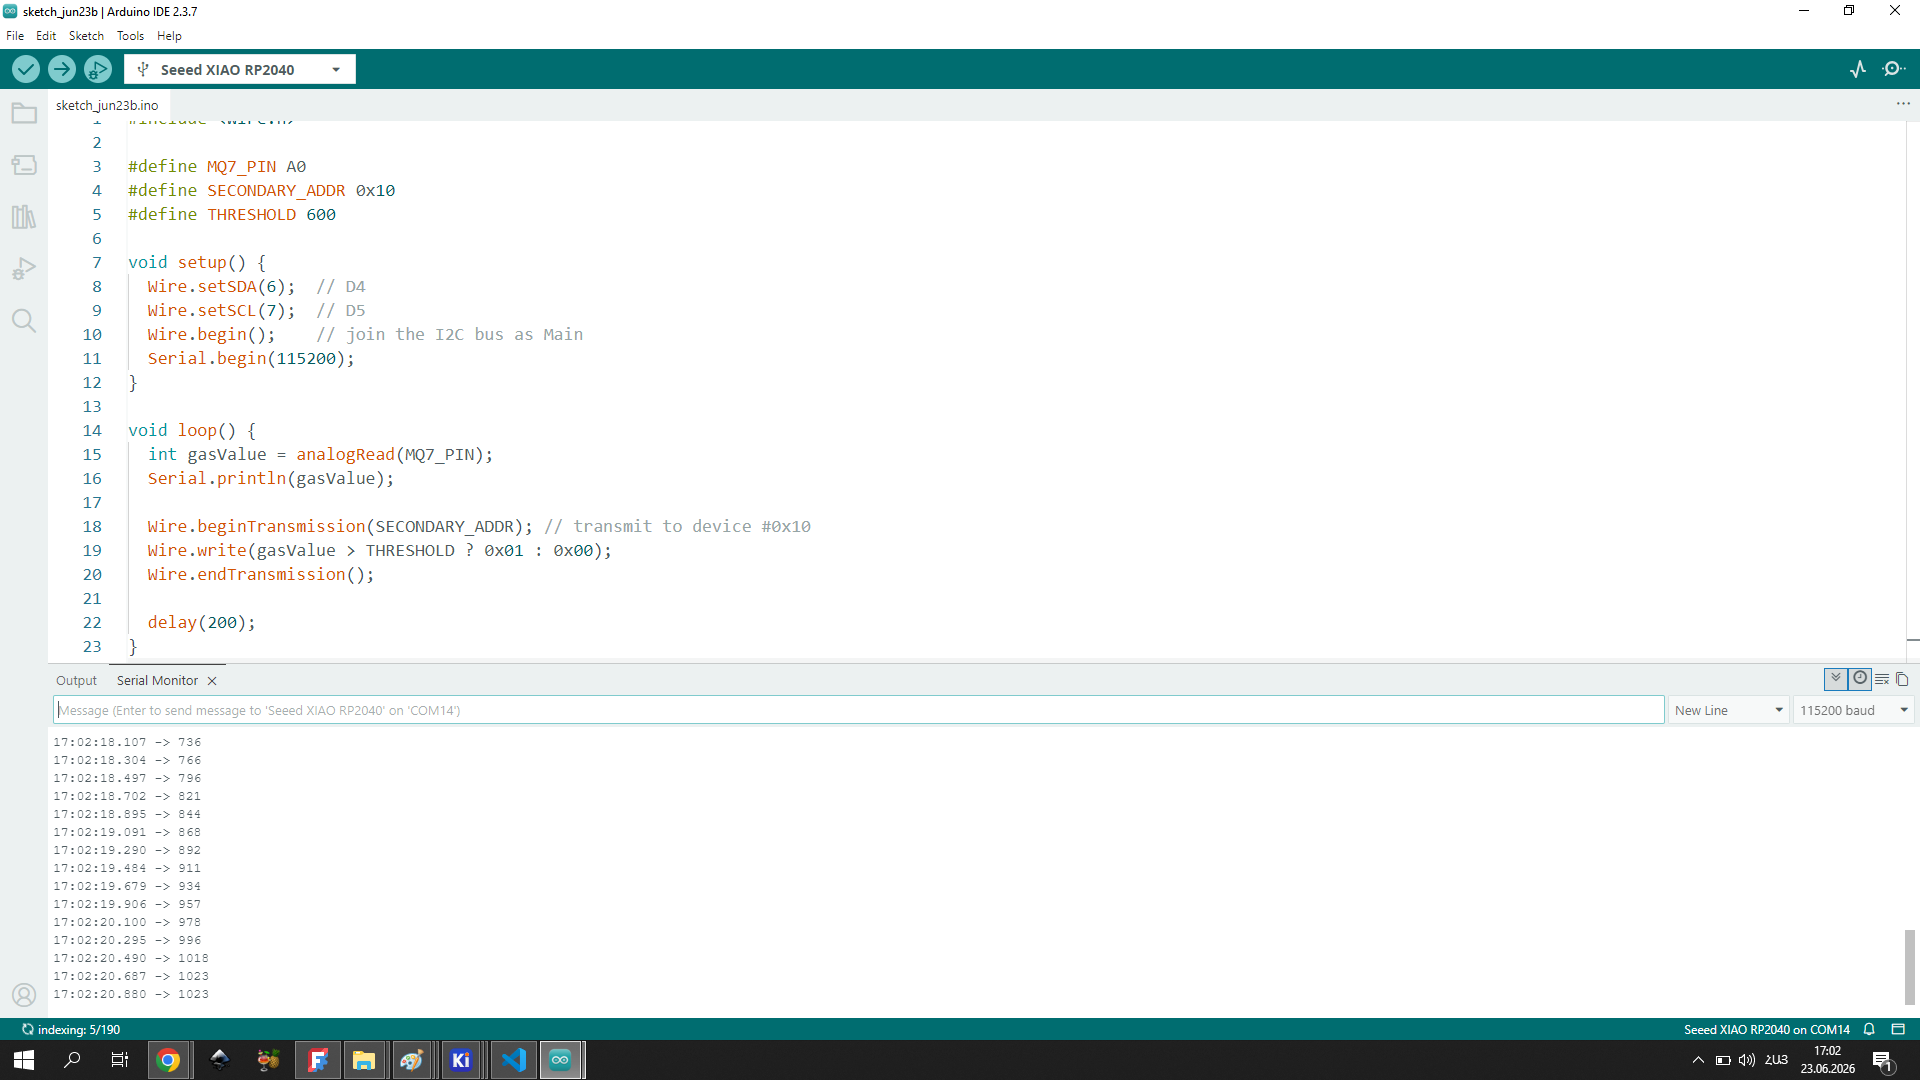
The values on the Serial Monitor increased as gas concentration increased, confirming the sensor was responding correctly to changes in the environment.
In the second test, I converted that raw value into an actual voltage reading, to get a more meaningful number than just the raw ADC output:
AI prompt used: “Extend the previous MQ-7 code to also calculate and print the voltage in volts, based on the 12-bit ADC range (0-4095) and 3.3V reference.”
#define MQ7_PIN A0  // MQ-7 analog output

void setup() {
  Serial.begin(115200);
}

void loop() {
  int raw = analogRead(MQ7_PIN);              // raw ADC value 0-4095

  float voltage = (raw * 3.3) / 4095.0;      // convert to voltage 0-3.3V

  Serial.print("Raw: ");
  Serial.print(raw);                           // print raw value

  Serial.print(" | Voltage: ");
  Serial.print(voltage, 2);                    // print voltage with 2 decimal places
  Serial.println(" V");

  delay(500);
}
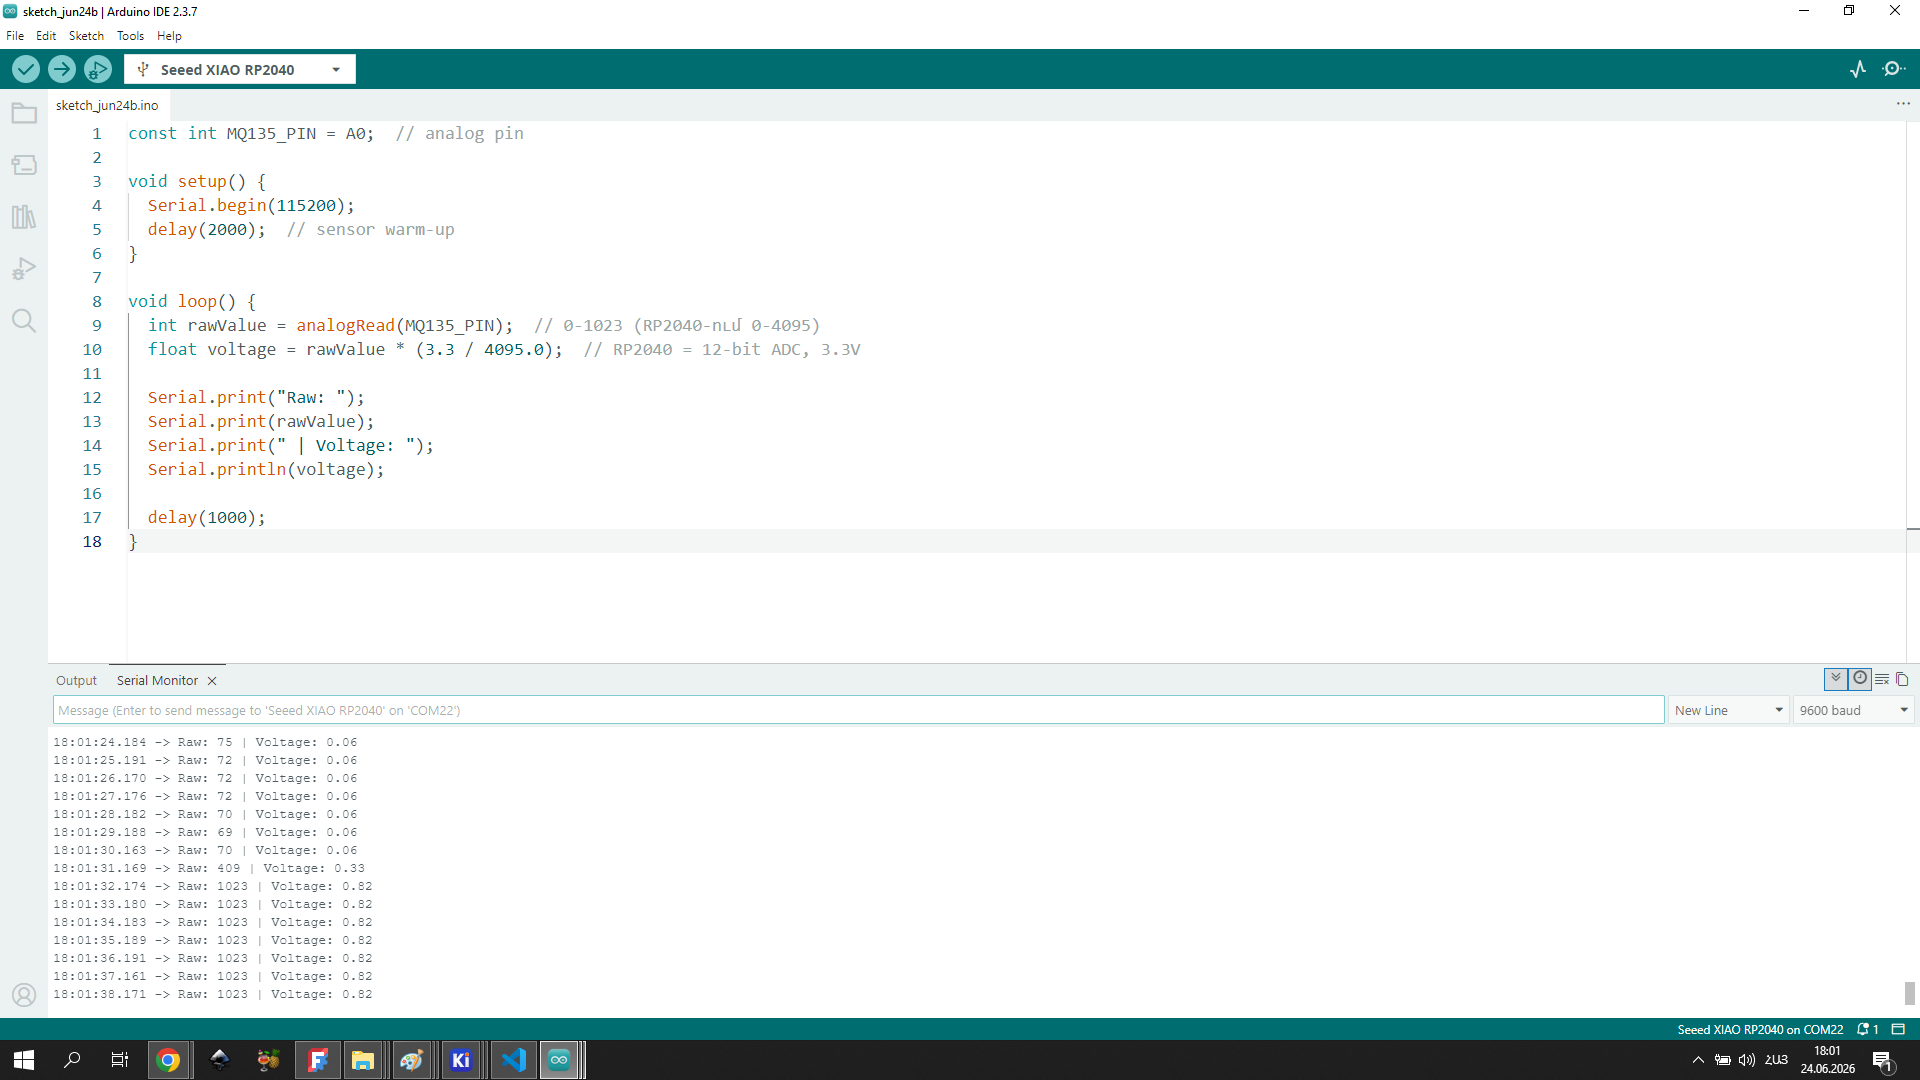
The calculated voltage rose together with the gas concentration. Low values (~70 raw, ~0.06V) indicate clean air; high values (1023 raw, ~0.82V) indicate elevated gas concentration.
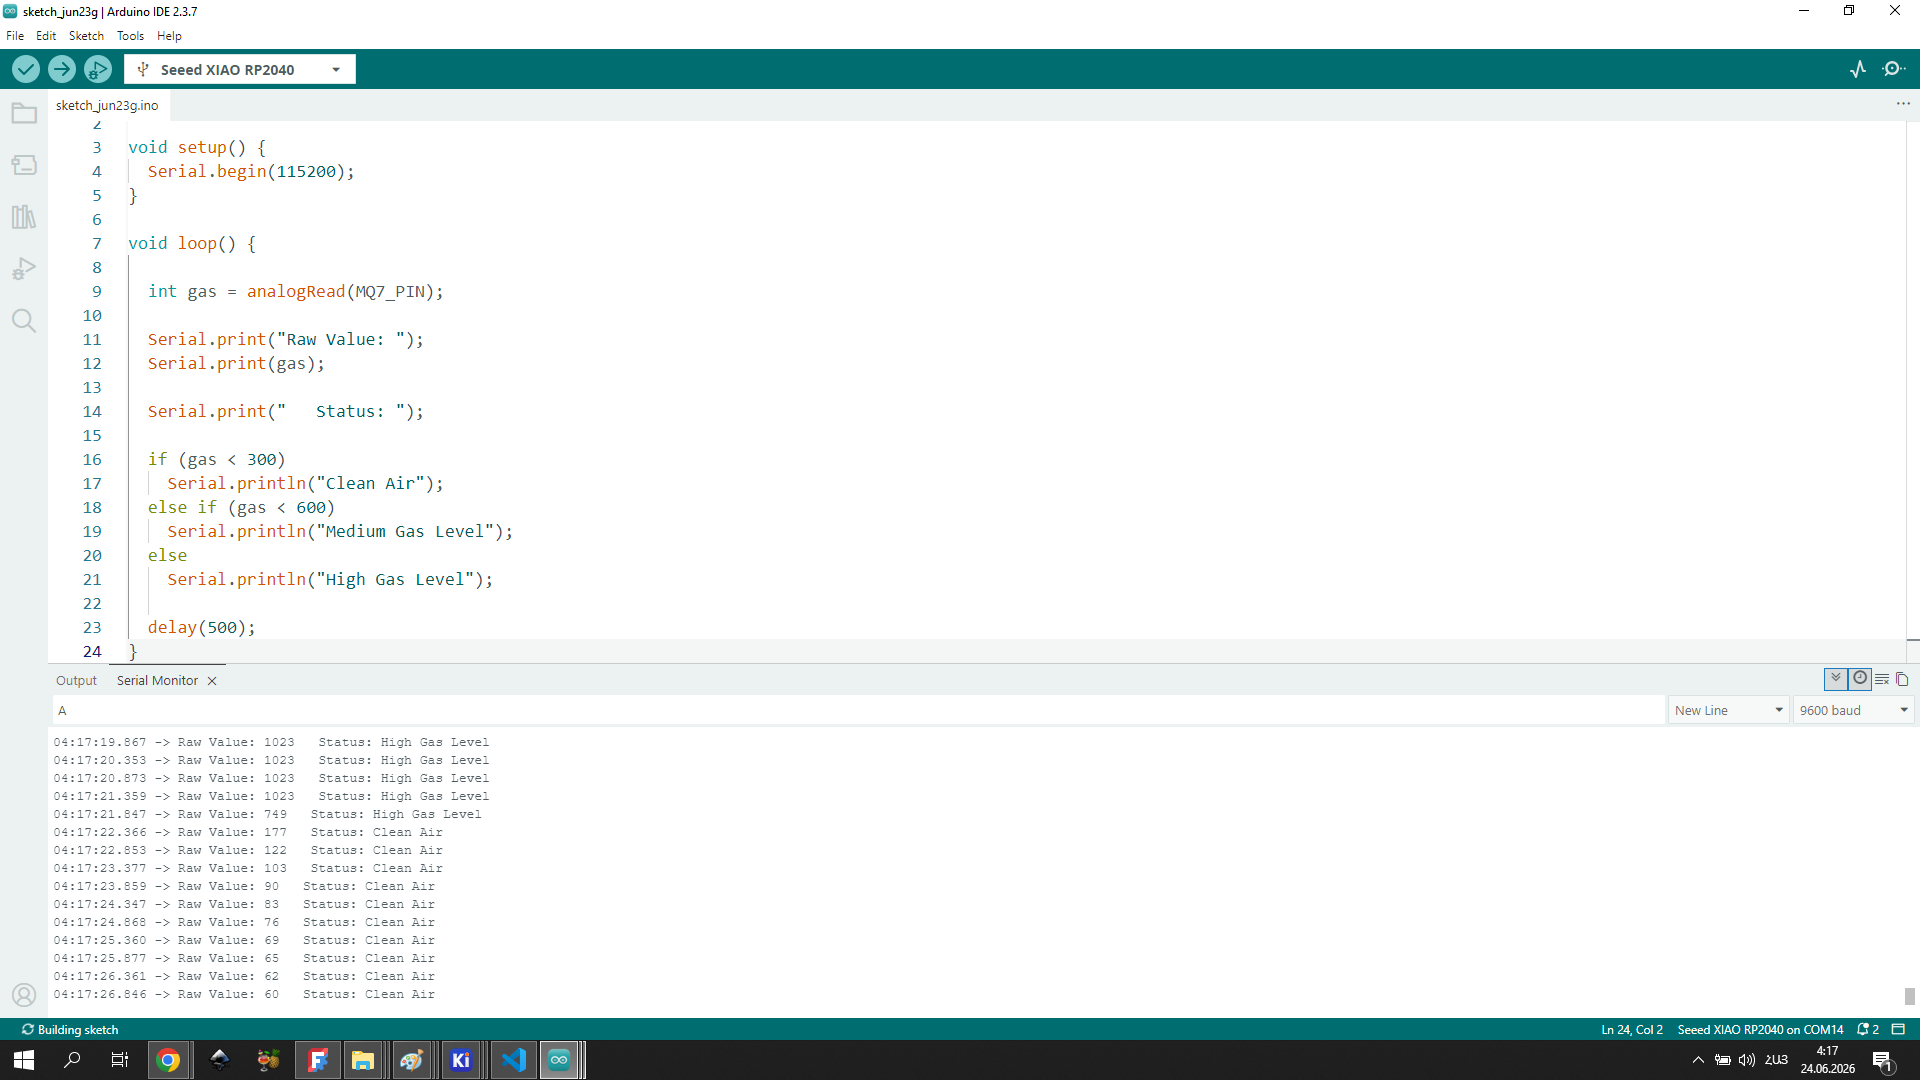
I also ran a third version of the MQ-7 code that prints a human-readable status alongside the raw value — “Clean Air”, “Medium Gas Level”, or “High Gas Level” — based on thresholds:
Conclusion
This week’s assignment helped me understand the difference between analog and digital input devices, and how sensor data can be read and interpreted with a microcontroller — from a simple potentiometer all the way to real sensors like the infrared obstacle sensor, the PIR motion sensor, and the MQ-7 gas sensor.
Each sensor produced a different type of signal, and seeing them all read and processed by the Seeed XIAO RP2040 made the input → processing → output chain (sensor data → code logic → LED behavior) feel concrete rather than abstract.
The MQ-7 experiments were especially valuable, since this sensor will be part of my Final Project — testing it now let me verify its behavior and build some confidence with it before relying on it in the final system.
Board Redesign
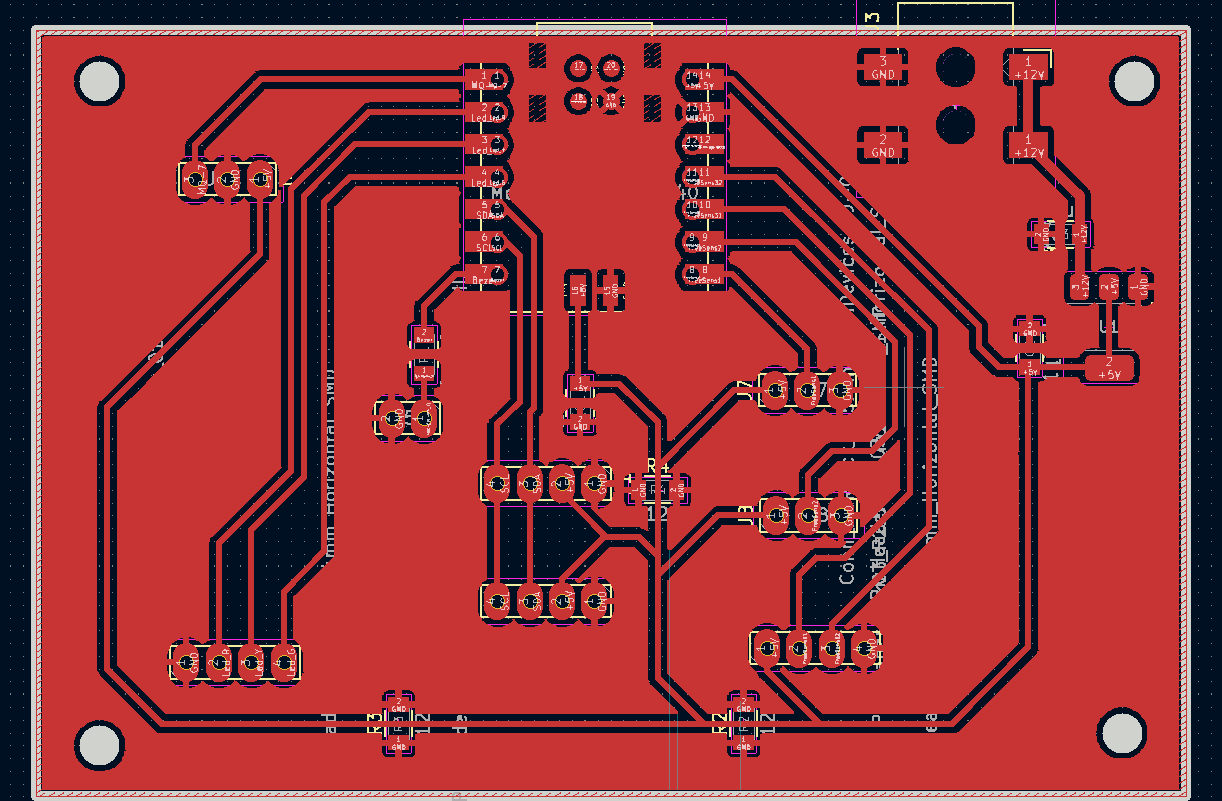
For this week, I redesigned the board I had originally built in Week 6 and milled in Week 8. A few practical issues with the first version pushed me to redo the design.
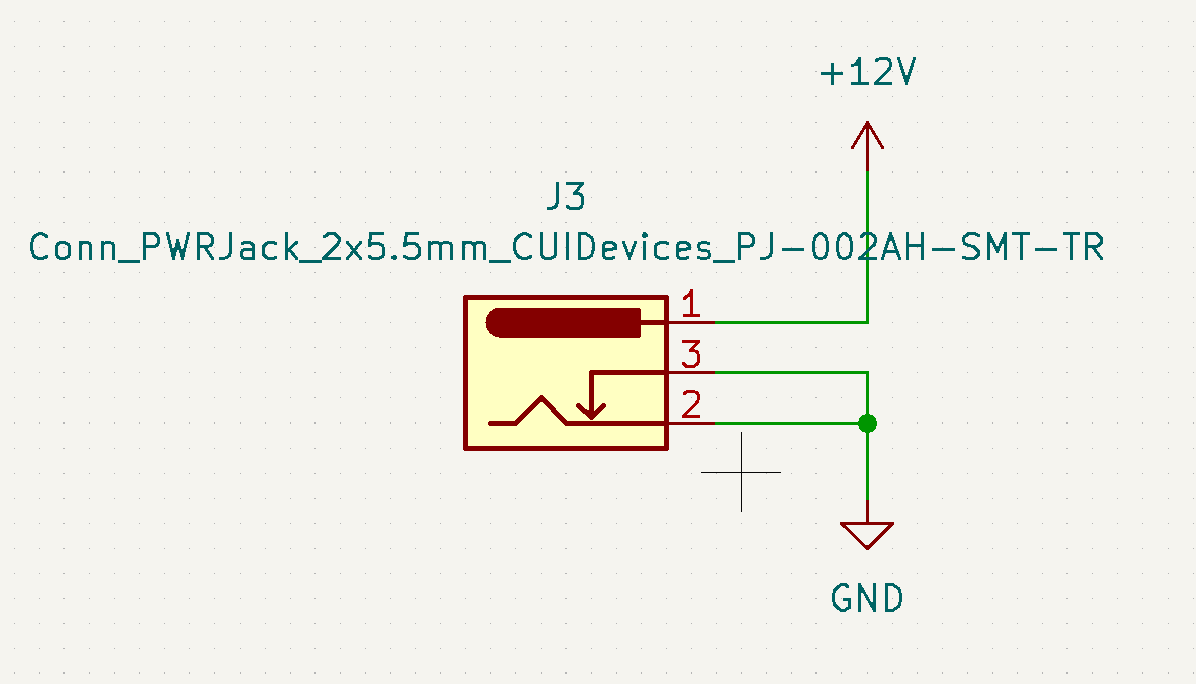
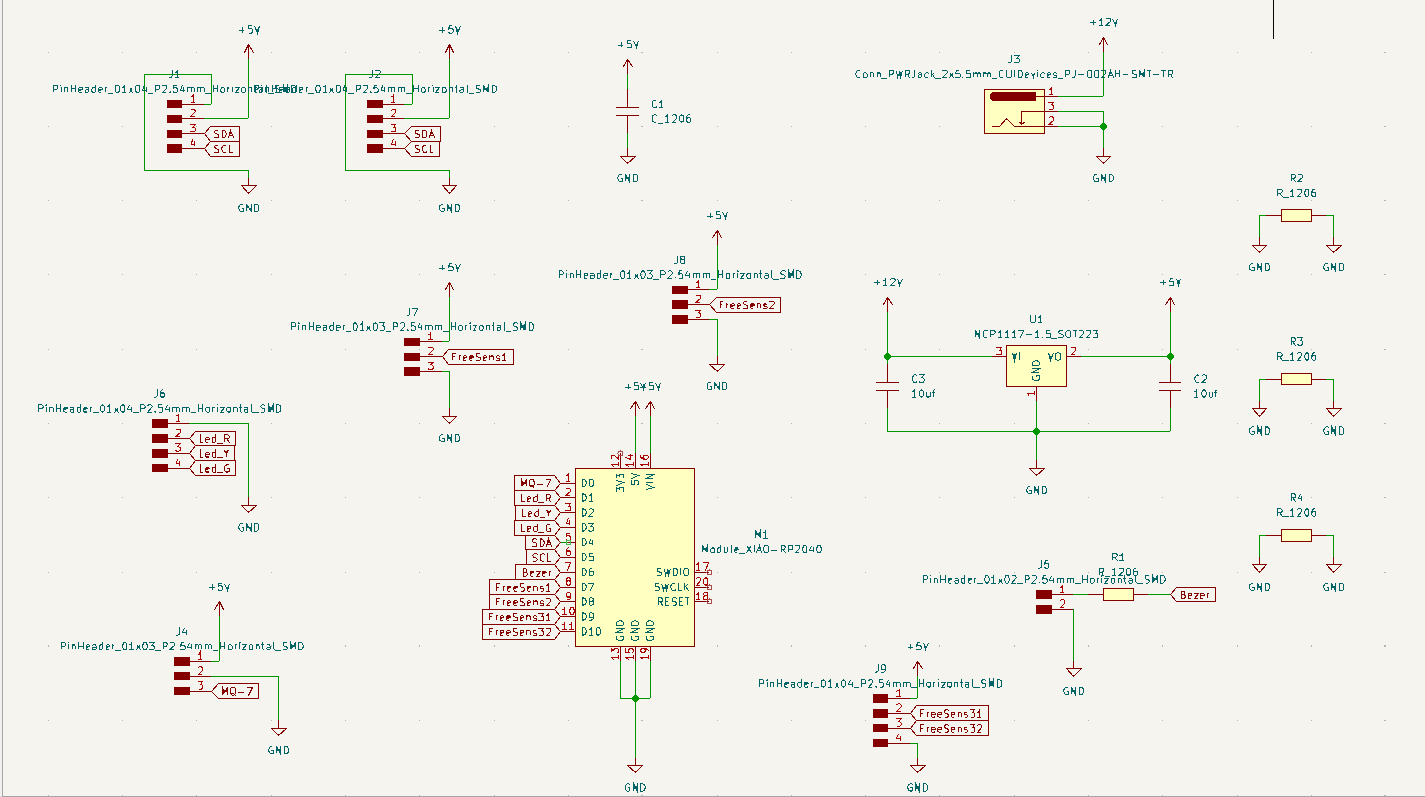
Power input. The original board could only be powered through the USB-C port on the XIAO RP2040 itself. I wanted the option to power it from a 12V source instead, so I added a Conn_PWRJack_2x5.5mm barrel jack connector to the board.
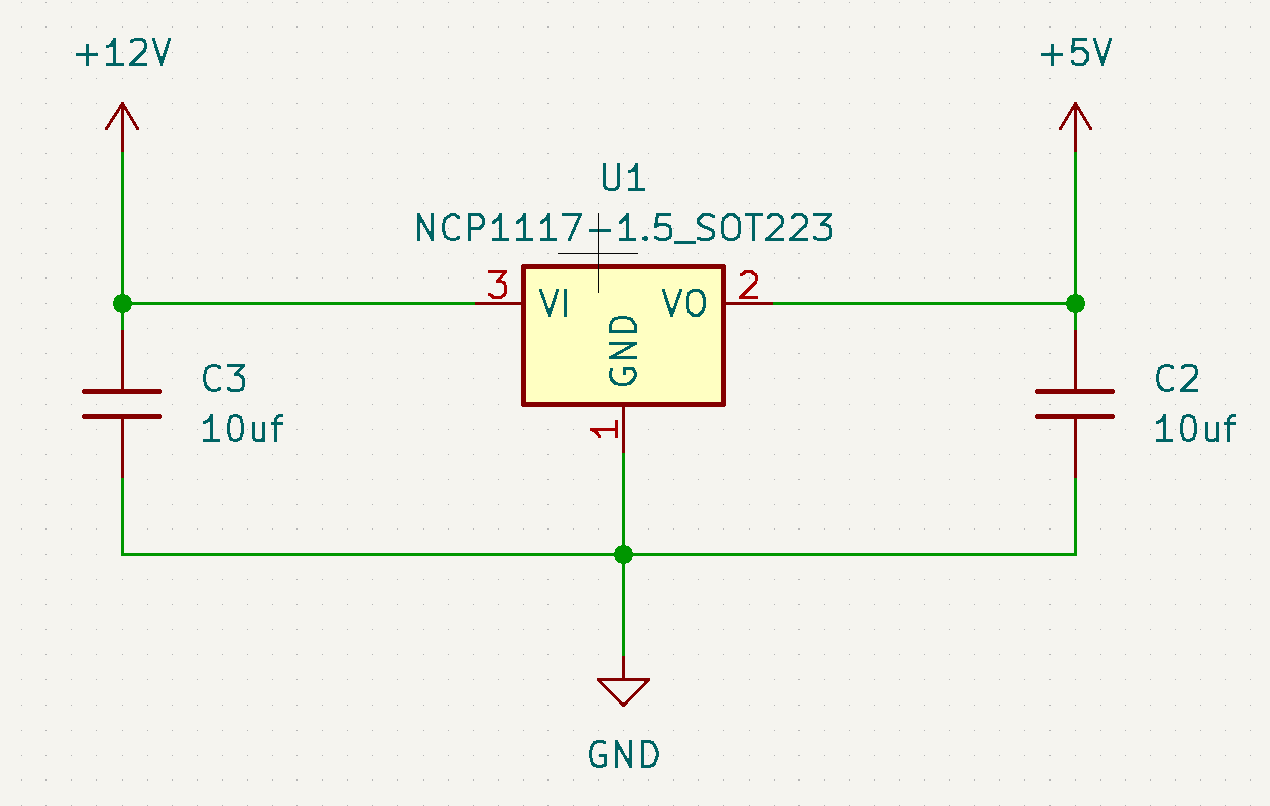
Since the rest of the board runs on 5V, I also added a voltage regulator — an NCP1117-1.5_SOT223, rated for around 1A or more — to step the 12V input down to a stable 5V.
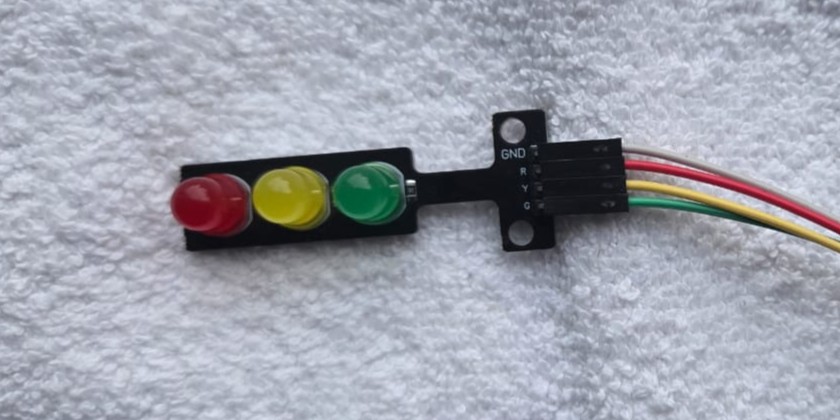
LEDs. On the original board, the red/yellow/green status LEDs were SMD components soldered directly onto the PCB. Since the final project is meant to sit inside an enclosure, and SMD LEDs aren’t very bright on their own, I decided to replace them with a ready-made module instead: the 5V LED Traffic Light Module for Arduino (OT2068-D41).
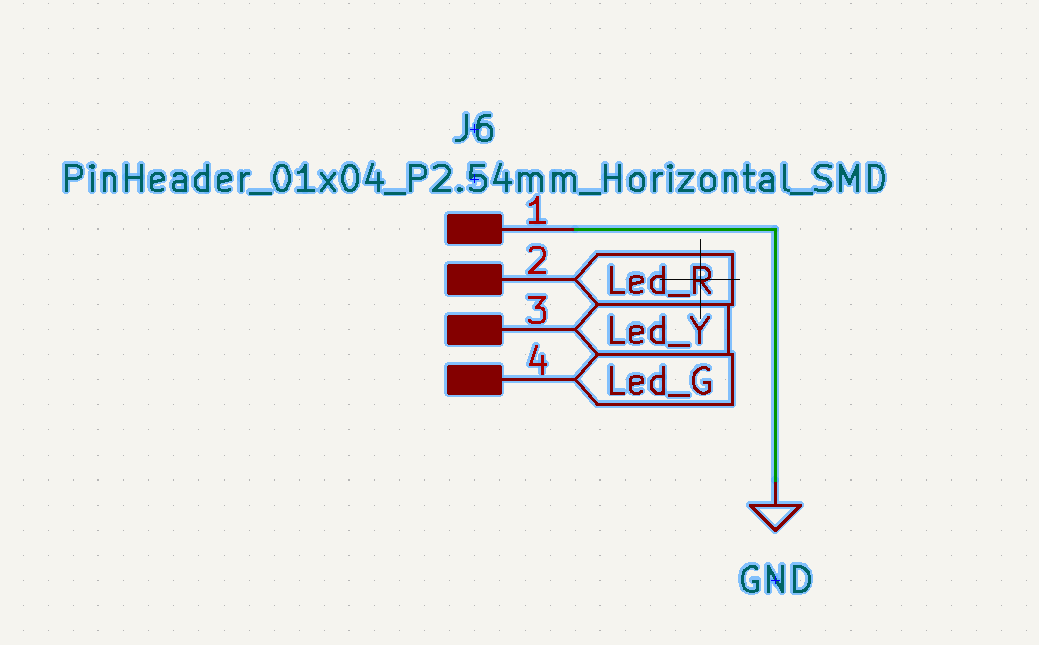
I dedicated a 4-pin header to it — 1 GND pin and 3 logic pins (one per color), so the module can be driven the same way the SMD LEDs were before.
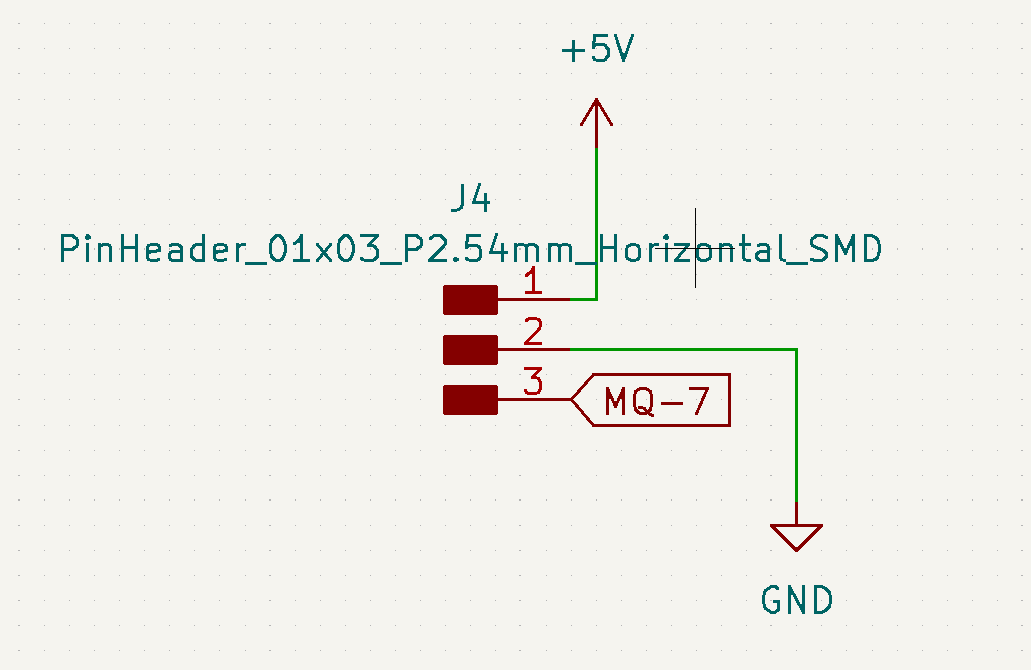
Gas sensor. I’m now planning to use an MQ-7 for the gas readings, so I left a 3-pin header for it: +5V, GND, and one analog output pin.
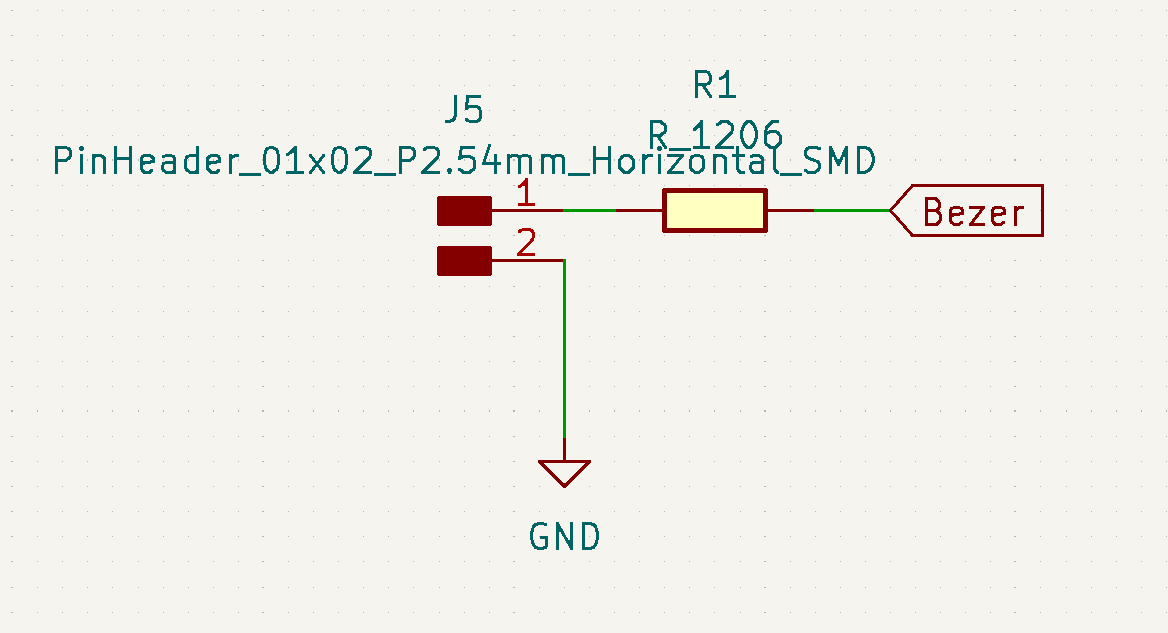
Buzzer. The buzzer I’m using is rated for around 1V, while the microcontroller’s logic pins output 3.3V. To bring the signal down closer to what the buzzer expects, I placed a resistor between the logic pin and the buzzer’s pin header, rather than connecting it directly.
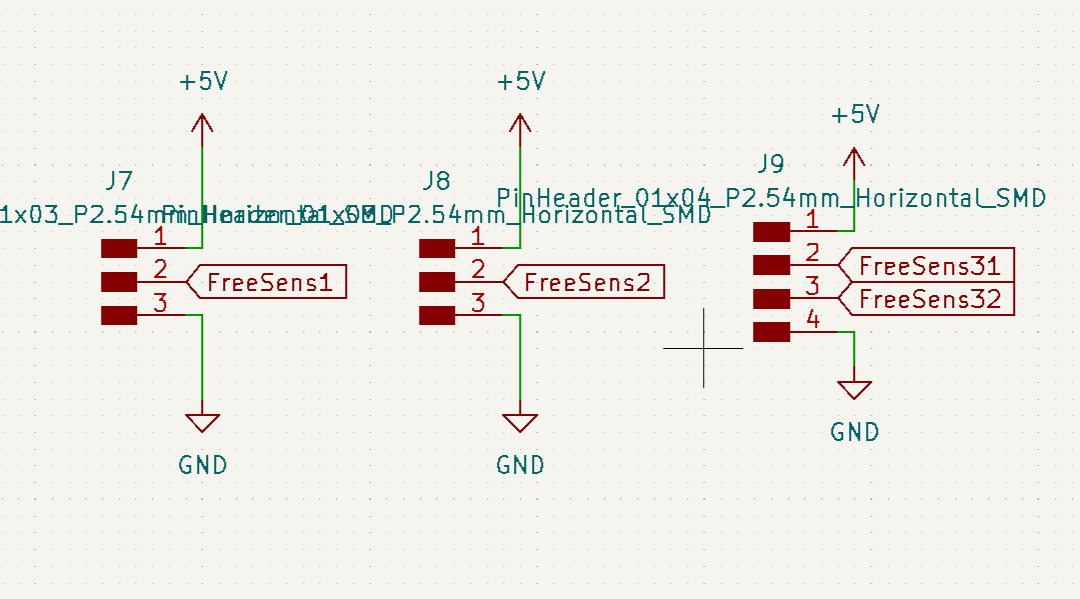
Spare sensor headers. As before, I kept a few extra pin headers broken out for sensors I haven’t decided on yet, so the board stays flexible for whatever I might need to add later.
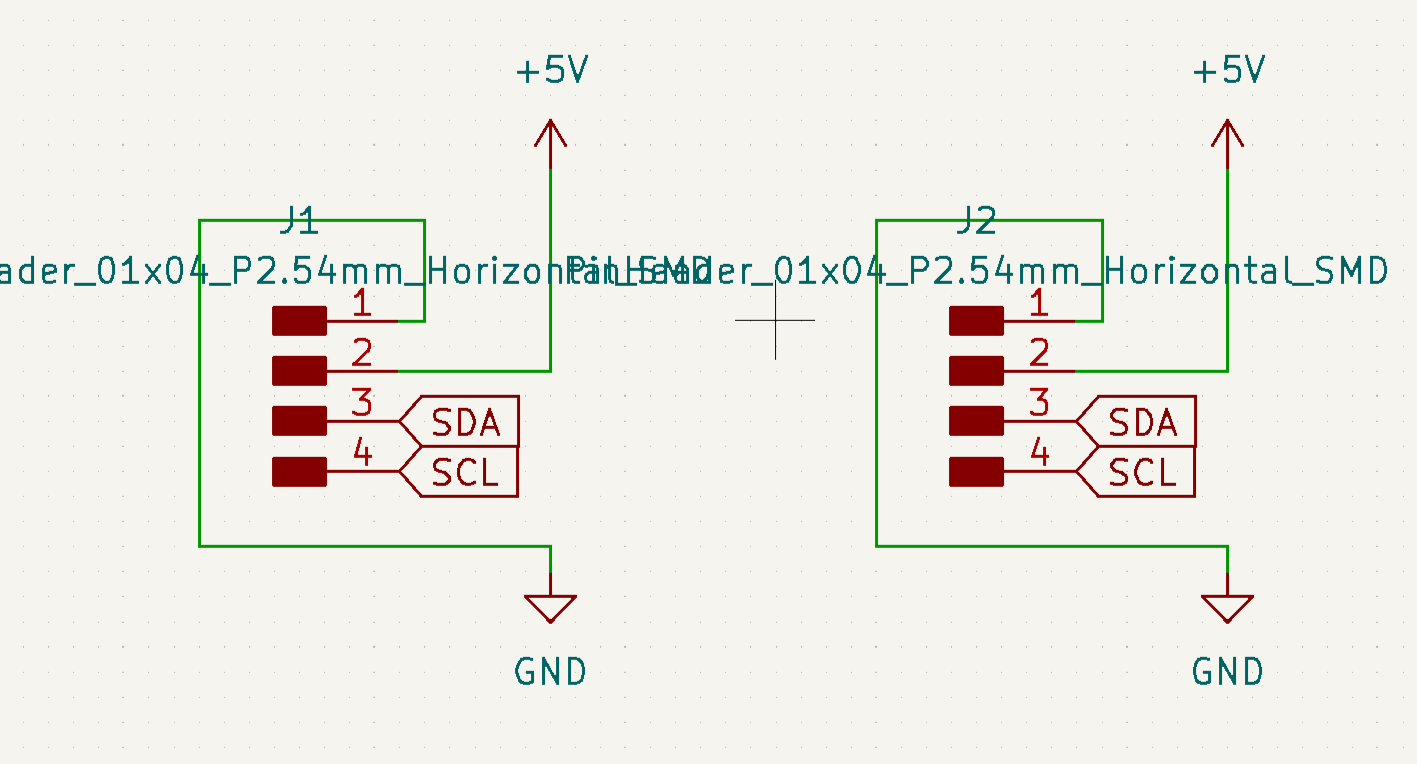
I2C headers. I added two 4-pin headers for I2C communication (+5V, GND, SDA, SCL), so I can either exchange data with another device over I2C or use the same header to supply it with power.
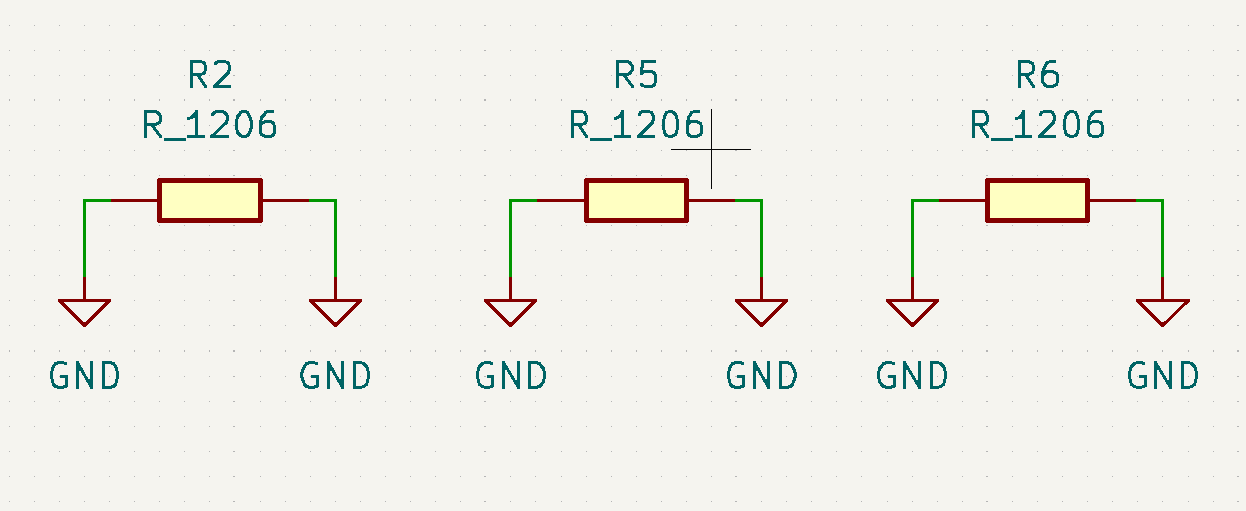
GND zone bridges. Just like on the previous board, routing the GND zone on the PCB ended up splitting it into separate areas in a few places. I added three 0 Ω resistors to bridge those gaps and keep the ground plane fully connected.
Schematic
PCB Layout
Milling and Soldering
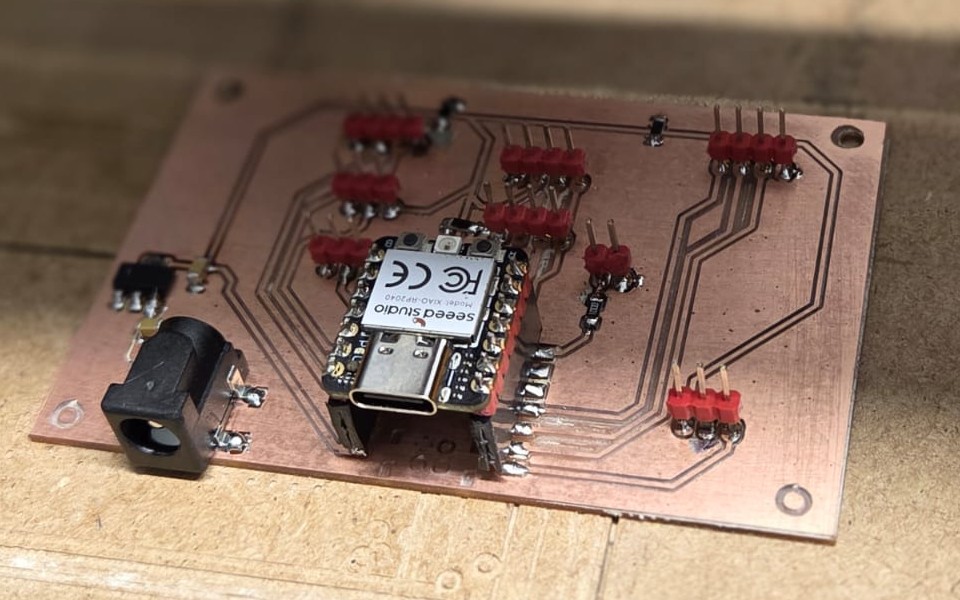
I milled the new board and soldered on the components — the power jack, the voltage regulator, and all the pin headers.
Files
kicad design files Project 1 - ZIP
kicad design files Project 2 - ZIP