Interface and Application Programming
Weekly Assignment Requirements
The main goal of this week was to learn how to create an interface and application capable of communicating with a self-made embedded board.
According to the weekly assignment requirements, we had to complete:
Group Assignment
- compare different interface programming tools
- explore communication methods between software and microcontrollers
- document the group workflow and experiments
Individual Assignment
- create an application for a self-designed and self-made embedded board
- develop an interface capable of communicating with the board
- use input and/or output devices
- demonstrate real-time communication between software and hardware
- document the complete workflow
- explain the communication logic
- include source code
- demonstrate the final working system
The learning outcomes of this week focused on understanding how User Interfaces (UI) communicate with embedded systems and how software can visualize or control hardware in real time.
This week became especially important for me because it directly connected software interfaces with the hardware system developed for my Final Project.
Group Assignment
Introduction
During the group assignment, we studied different tools used for interface and application programming for embedded systems.
The main goal of the group work was to understand how software interfaces can communicate with microcontrollers through Serial Communication and how different platforms work when creating real-time interaction between hardware and software.
During the experiments, we explored and compared three different approaches:
- Processing + G4P
- Python + Tkinter
- Node-RED
Each platform represented a different workflow and approach for creating an interface and communication system.
During the experiments, we explored:
- Serial Communication
- graphical interfaces
- keyboard interaction
- LED control
- real-time visualization
- communication between software and embedded electronics
We tested how software interfaces can dynamically react to data received from a microcontroller and how different tools work during communication workflows.
These experiments helped us better understand:
- how software interfaces communicate with embedded systems
- how Serial Communication works
- how graphical interfaces react to received values
- how real-time interaction between hardware and software is created
- the advantages and limitations of different interface development platforms
Comparing the Three Tools
| Tool | Processing + G4P | Python + Tkinter | Node-RED |
|---|---|---|---|
| Language | Java-like | Python | Visual + JS |
| Install | Processing IDE + G4P | pip install pyserial |
npm + 2 modules |
| Serial | Built-in Serial class |
pyserial |
Serial node |
| Feels like Arduino | Yes — identical structure | Partially — same logic, different syntax | No |
| Time to working result | ~30 min | ~25 min | ~15 min |
| Teaches Serial internals | ✅ | ✅ | ⚠️ hidden inside nodes |
These three tools represented completely different approaches:
- writing a program and understanding each line of code (Processing, Python)
- assembling a working system using pre-built parts (Node-RED)
For the individual assignment, I chose Processing because I wanted to better understand exactly what the code was doing, and the similarity between Processing and Arduino made the communication workflow much easier to understand.
Possible Improvements
PWM Brightness Control
Our comparison included only the simplest scenario — one button and one LED.
A more complete test could include:
- PWM brightness control
- sliders
- continuous input values
- multiple outputs
This would allow a better comparison of how each tool works with more complex interaction systems.
Mobile Interface Through Node-RED
One of the advantages of the Node-RED dashboard is that it can work from any browser on the local network.
This means that the interface can easily be accessed from:
- smartphones
- tablets
- other computers
without additional software installation.
This could be useful for future remote monitoring systems.
Thread Safety in Tkinter
During the Tkinter experiment, we also noticed that updating interface elements from a background thread is not technically safe.
The correct approach would be to use:
root.after()
so that the interface can be safely updated from the main thread.
Although the simple test worked correctly, understanding this limitation helped us better understand GUI programming structure and event handling in Python applications.
Files
xiao_rp2040_firmware.ino— board firmwareLED_Control_G4P.pde— Processing + G4P sketchled_control_tkinter.py— Python + Tkinter applicationfabacademy_led_flow.json— Node-RED flow
Additional Information
For more complete information about the group assignment, workflows, files, and comparison experiments, you can visit:
https://fabacademy.org/2026/labs/dilijan/assignments/week14/#gyumri-lab
Individual Assignment
Introduction
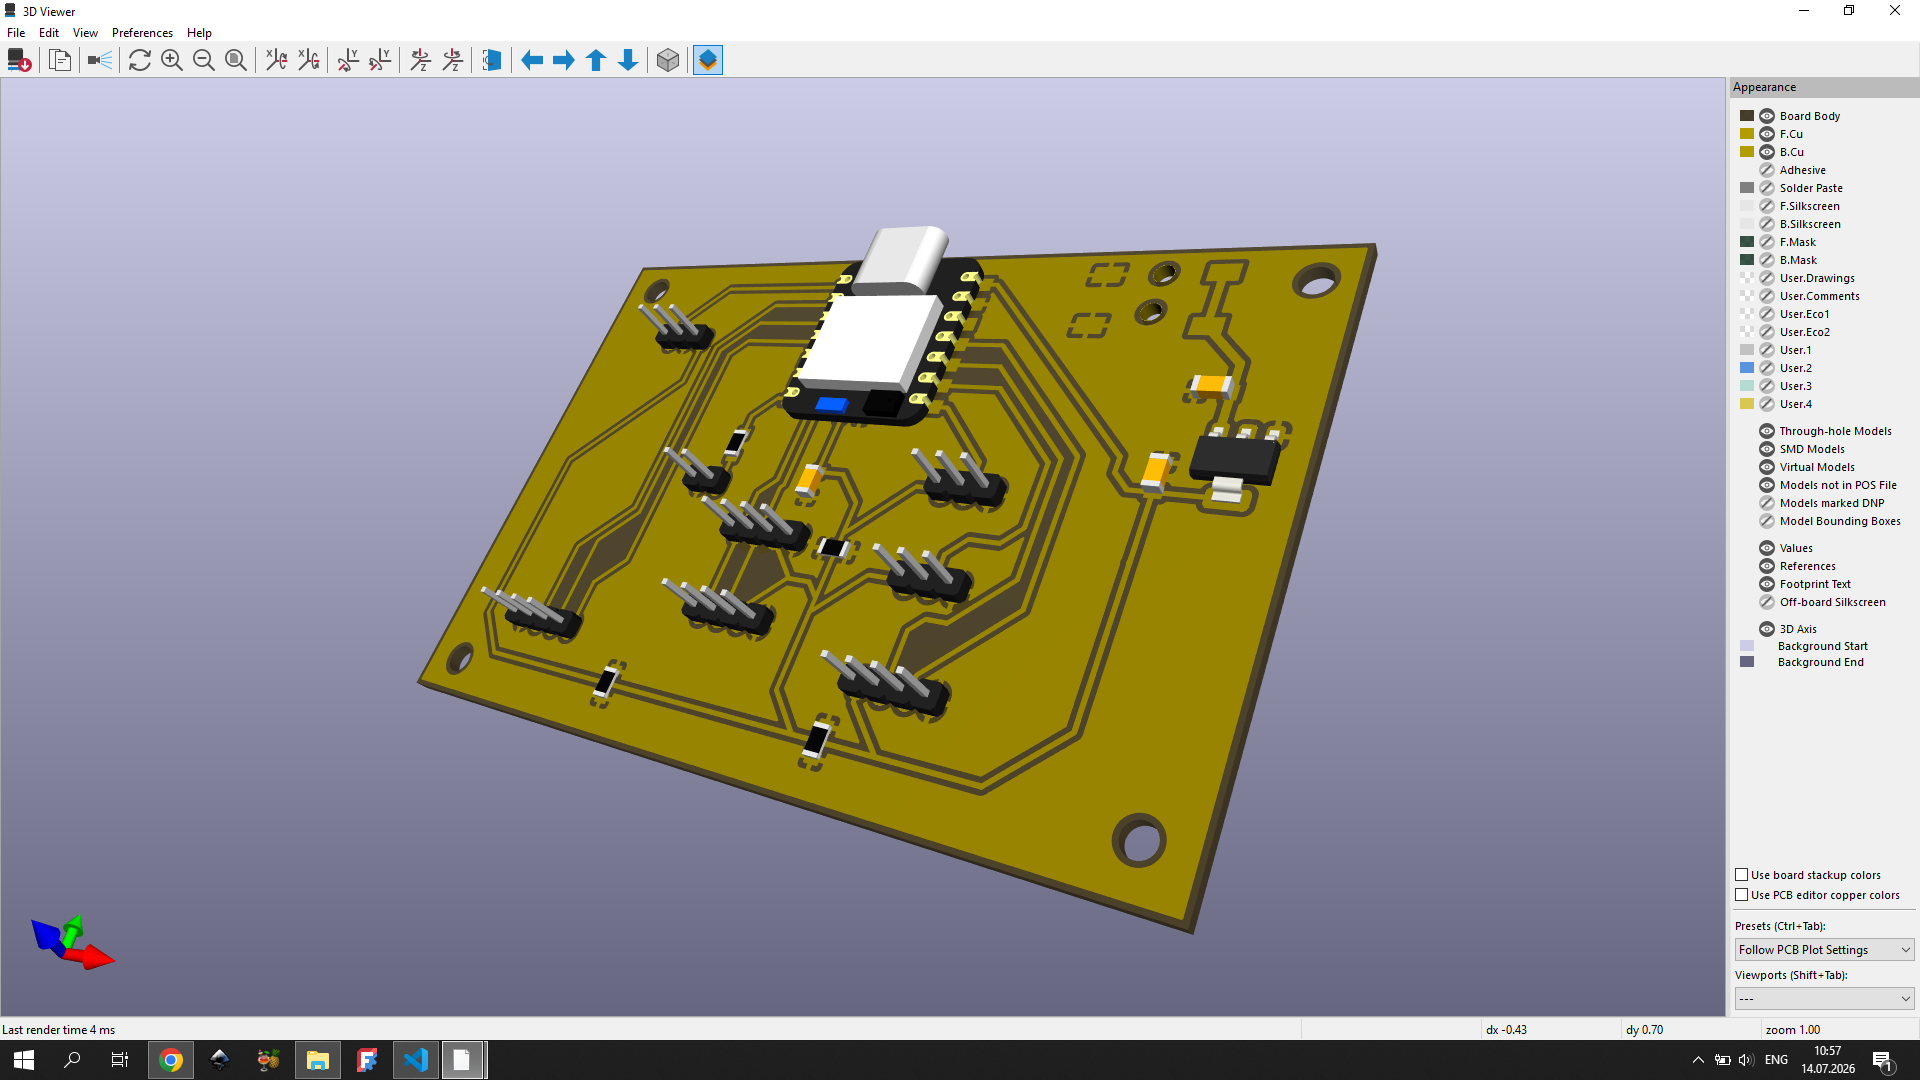
For my individual assignment, I decided to combine embedded programming and interface programming by creating a real-time gas monitoring visualization system using Processing and my custom XIAO RP2040 PCB.
This assignment gradually evolved through several experiments and became directly connected to the development of my Final Project.
During my individual assignment, I performed two different tests.
The first test was based on simple communication between Processing and my PCB.
In this test:
- when pressing
1, the green LED turned ON - when pressing
2, the yellow LED turned ON - when pressing
3, the red LED turned ON - when pressing
0, all LEDs turned OFF
The second test was developed based on the logic and results of the first test.
After understanding the communication workflow, I decided to connect the experiment directly to the idea of my Final Project.
Instead of manually controlling LEDs from the keyboard, I wanted my PCB and Final Project system to work with a real interface where I could monitor the system directly on the computer screen.
For this reason, I created a Processing visualization interface connected to my MQ-7 gas sensor and my custom PCB.
This became my second test.
First Communication Experiment
Before creating the final MQ-7 monitoring interface, I first performed a simpler communication experiment between Processing and my XIAO RP2040 board.
This first experiment was created with the help of ChatGPT prompts, where I asked step-by-step questions about how Processing could control LEDs connected to my PCB.
One of my main questions was approximately:
“How can I control LEDs connected to my XIAO RP2040 using Processing and Serial Communication?”
During the explanation, it was shown that Processing could send numeric values through Serial Communication, while Arduino could receive those values and control LEDs in real time.
This experiment helped me understand:
- how Processing sends serial data
- how Arduino receives serial information
- how software can control physical electronics
- how real-time communication works
- how interactive interfaces can communicate with embedded systems
First Communication Experiment Result


First Communication Experiment Video
First Communication Experiment Code
Processing Communication Code
import processing.serial.*;
Serial myPort;
void setup() {
size(400, 300);
myPort = new Serial(this, "COM3", 9600);
}
void draw() {
background(30);
textSize(30);
fill(255);
text("1 = GREEN", 100, 80);
text("2 = YELLOW", 100, 140);
text("3 = RED", 100, 200);
text("0 = OFF", 100, 260);
}
void keyPressed() {
if (key == '1') {
myPort.write(0);
myPort.write(0);
myPort.write(255);
}
if (key == '2') {
myPort.write(0);
myPort.write(255);
myPort.write(0);
}
if (key == '3') {
myPort.write(255);
myPort.write(0);
myPort.write(0);
}
if (key == '0') {
myPort.write(0);
myPort.write(0);
myPort.write(0);
}
}
Arduino Communication Code
int redLed = D1;
int yellowLed = D2;
int greenLed = D3;
void setup() {
Serial.begin(9600);
pinMode(redLed, OUTPUT);
pinMode(yellowLed, OUTPUT);
pinMode(greenLed, OUTPUT);
}
void loop() {
if (Serial.available() >= 3) {
int r = Serial.read();
int y = Serial.read();
int g = Serial.read();
analogWrite(redLed, r);
analogWrite(yellowLed, y);
analogWrite(greenLed, g);
}
}
Adding the G4P Library in Processing
While developing the Processing interface, I realized that the default Processing tools were not enough to create the type of interface I wanted for my project.
At the beginning, I could only create very simple graphical elements using:
text()ellipse()rect()
However, I wanted the interface to become more interactive, organized, and visually closer to a real monitoring system.
Because of this limitation, I explored additional GUI tools for Processing and discovered the G4P library.
At first, the G4P library was not available inside my Processing libraries.
For this reason, I searched for the library online, downloaded it manually, and then added it into the Processing libraries folder.
After copying the library into the correct directory, I restarted Processing and imported the library into my project.
After installing the library successfully, I was able to use G4P components inside Processing.
Adding G4P allowed me to experiment with more advanced interface components such as:
- buttons
- labels
- interactive controls
- GUI elements
- structured interface layouts
This became important because it helped me better understand how future monitoring systems and control panels could be designed for my Final Project.
Even though the final MQ-7 visualization interface was created mostly with Processing’s built-in graphical functions, experimenting with G4P helped me better understand:
- GUI programming
- interface organization
- interactive system design
- Processing interface structure
- event-based interaction
This experiment also showed me how software interfaces can gradually evolve from simple visualizations into more complete and user-friendly monitoring systems.
G4P Interface Experiment
Processing G4P Interface Test

Simple G4P Example Code
import g4p_controls.*;
GButton btn;
void setup() {
size(400, 300);
btn = new GButton(this, 140, 120, 120, 40);
btn.setText("LED ON");
}
void draw() {
background(200);
}
void handleButtonEvents(GButton button, GEvent event) {
if (button == btn) {
println("Button Pressed");
}
}
Second Experiment — MQ-7 Gas Monitoring Visualization in Processing
Introduction
After testing the MQ-7 gas sensor with Arduino IDE and observing the values through the Serial Monitor, I wanted to create a more visual and interactive monitoring system.
For this purpose, I used Processing, which allows serial data coming from Arduino to be transformed into a real-time graphical visualization.
The goal of this interface was to simulate a safety monitoring panel where the system visually reacts to gas concentration levels using:
- colored warning indicators
- status text
- real-time ppm values
This created a clearer and more intuitive way to monitor air quality conditions.
Connection to My Final Project
This experiment is directly connected to my final project idea.
One of the main goals of my final project is to create a smart environmental monitoring system for workshop and forge safety.
Through this Processing visualization system, I was able to simulate how dangerous gas levels can be monitored visually in real time.
The interface reacts dynamically according to sensor data and provides clear visual feedback using:
- warning colors
- status indicators
- real-time gas values
- danger notifications
This workflow helped me better understand how sensor data can be transformed into an interactive safety interface.
The same logic and visualization principles will later be integrated into my final project, where the system will monitor environmental conditions and react automatically depending on gas concentration levels.
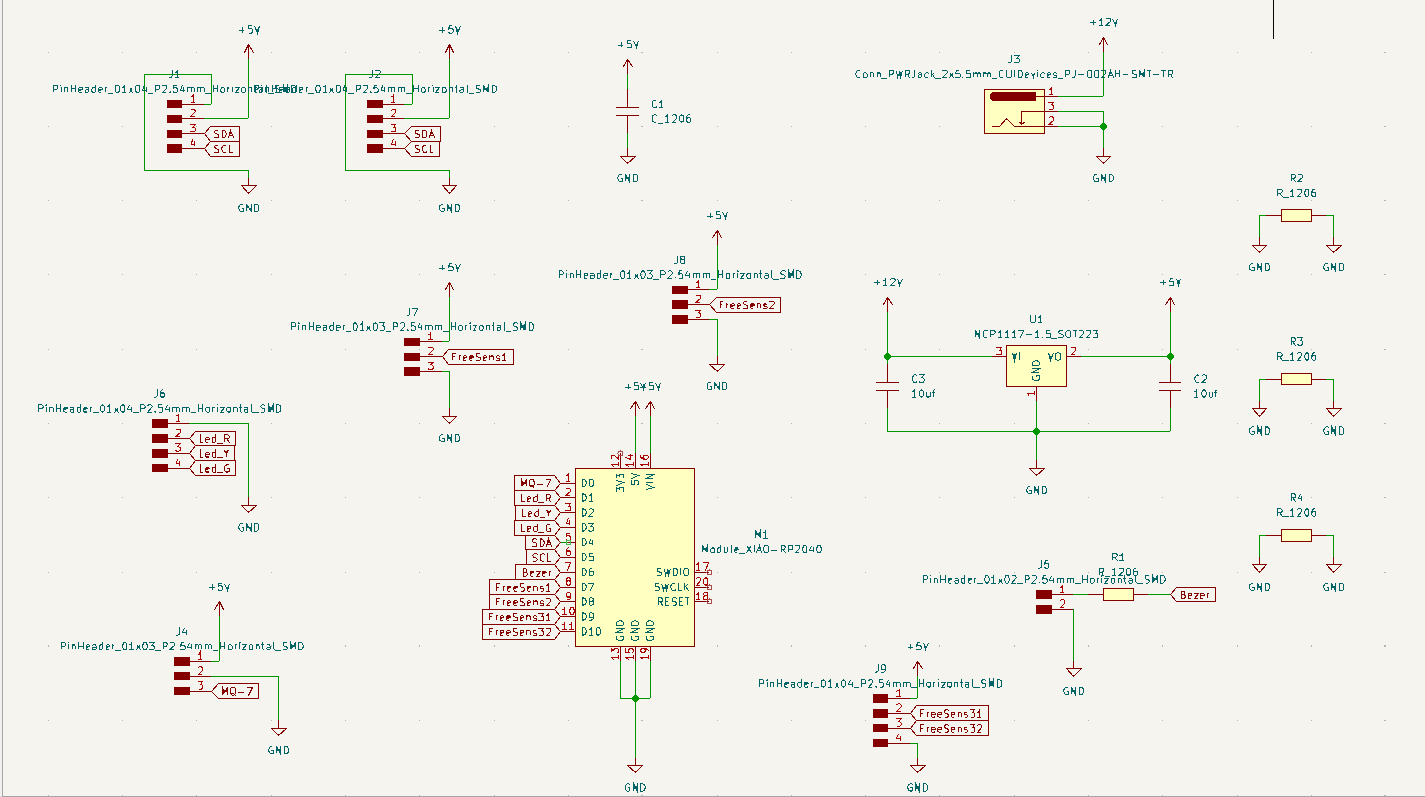
During the previous weeks of Fab Academy, I had already designed and developed the electronic board and the main logic of my final project.
Because the hardware platform and sensor logic were already functional, I decided to test and expand the system through this Processing experiment.
This allowed me to connect my existing final project electronics with a real-time visualization interface and better understand how the complete monitoring system could behave in a real environment.
This experiment became an important step toward integrating:
- sensor monitoring
- visualization
- warning systems
- interactive environmental feedback
into my final project workflow.
Tools Used
- Arduino IDE
- Processing IDE
- MQ-7 Gas Sensor
- USB Serial Communication
- Computer
- Arduino-compatible board
- Custom PCB
- Seeed Studio XIAO RP2040
System Logic
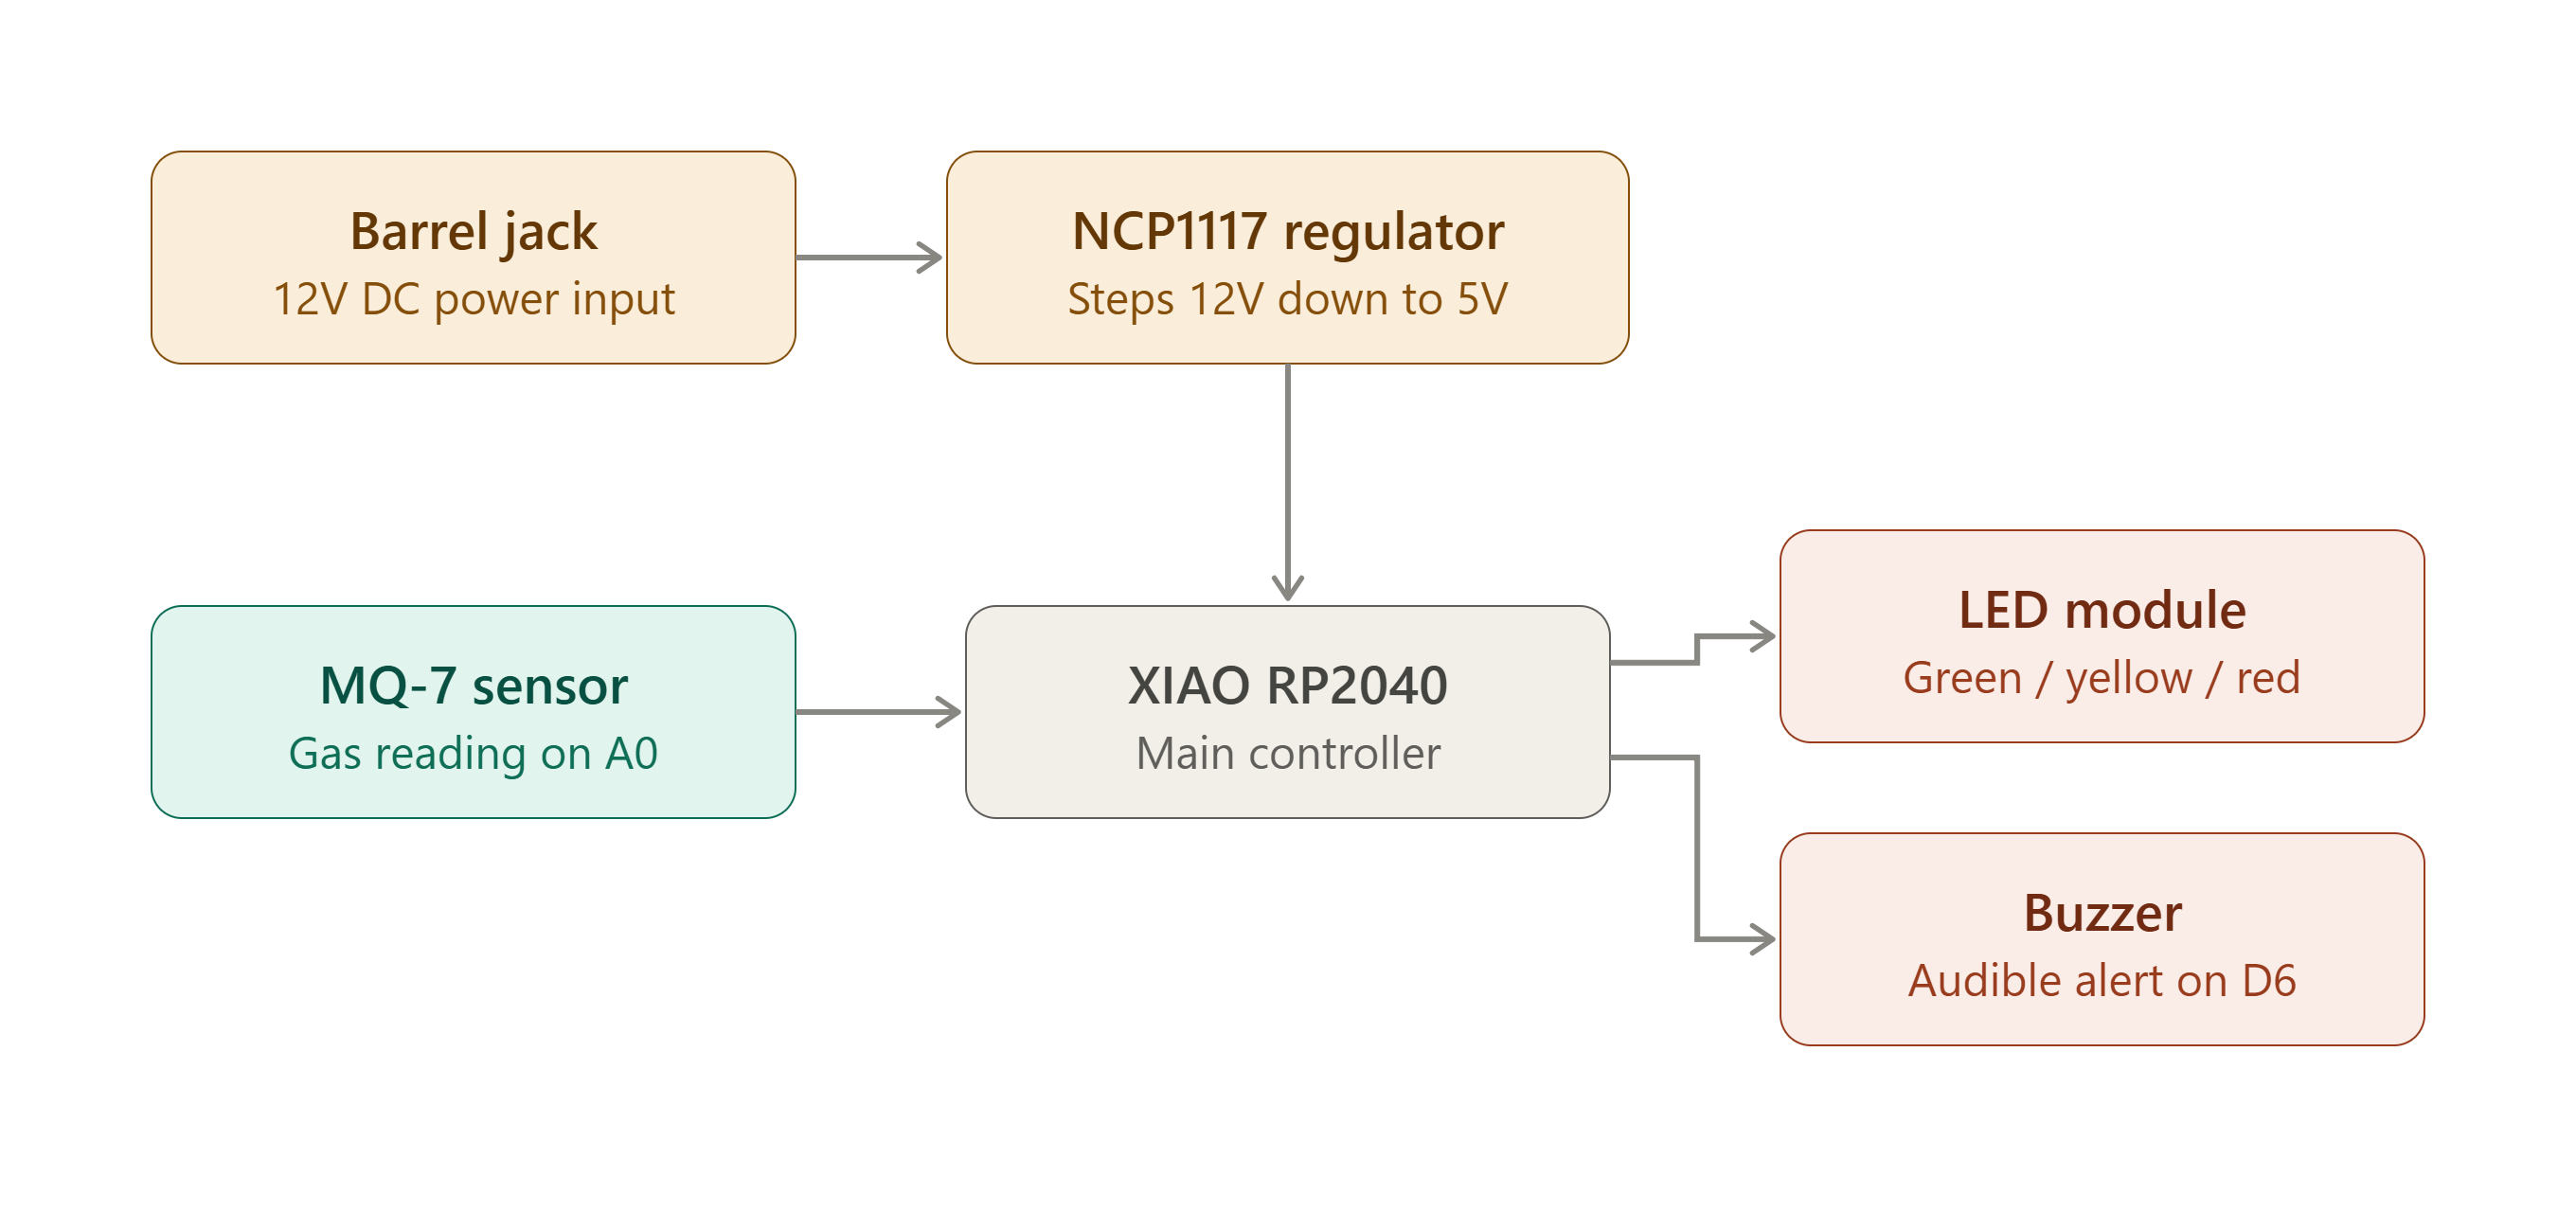
The MQ-7 sensor continuously measures gas concentration and sends numerical values through Serial communication.
Processing reads these incoming values and changes the interface according to predefined thresholds.
The visualization logic was divided into three safety states:
| Gas Value | Status | Color |
|---|---|---|
| 0–199 | SAFE | Green |
| 200–599 | WARNING | Yellow |
| 600+ | DANGER | Red |
Each state changes:
- the warning text
- the LED indicator color
- the ppm value color
This creates a synchronized visual feedback system.
Arduino Communication
To simplify communication between Arduino and Processing, only numerical values were sent through Serial communication.
Serial.println(gas);
This allowed Processing to directly read and convert the incoming data into integer values.
Creating the Interface in Processing
The interface was created using simple graphical elements in Processing.
The main components included:
- background panel
- circular LED indicators
- dynamic status text
- real-time gas value display
The LEDs were simulated using ellipse() objects.
ellipse(width / 2, 190, 55, 55);
The warning text and gas value were displayed using:
text("SAFE", width / 2, 120);
and:
text(gas + " ppm", width / 2, 430);
Visual Safety Logic
The interface reacts dynamically according to the gas value.
SAFE State
When the gas value is below 200:
- the green LED turns on
- the SAFE text appears
- the ppm value becomes green
if (gas < 200)
SAFE State Visualization

WARNING State
When the gas value is between 200 and 599:
- the yellow LED turns on
- the WARNING text appears
- the ppm value becomes yellow
else if (gas < 600)
WARNING State Visualization

DANGER State
When the gas value is higher than 600:
- the red LED turns on
- the DANGER text appears
- the ppm value becomes red
else
This created a real-time visual warning system.
DANGER State Visualization

MQ-7 Arduino Code
#define MQ7_PIN A0
#define RED_LED D1
#define YELLOW_LED D2
#define GREEN_LED D3
#define BUZZER_PIN D6
void setup() {
Serial.begin(115200);
pinMode(RED_LED, OUTPUT);
pinMode(YELLOW_LED, OUTPUT);
pinMode(GREEN_LED, OUTPUT);
pinMode(BUZZER_PIN, OUTPUT);
}
void loop() {
int gas = analogRead(MQ7_PIN);
Serial.println(gas);
digitalWrite(RED_LED, LOW);
digitalWrite(YELLOW_LED, LOW);
digitalWrite(GREEN_LED, LOW);
digitalWrite(BUZZER_PIN, LOW);
if (gas < 200) {
digitalWrite(GREEN_LED, HIGH);
digitalWrite(BUZZER_PIN, LOW);
delay(300);
}
else if (gas < 600) {
digitalWrite(YELLOW_LED, HIGH);
digitalWrite(BUZZER_PIN, HIGH);
delay(300);
digitalWrite(BUZZER_PIN, LOW);
delay(300);
}
else {
digitalWrite(RED_LED, HIGH);
digitalWrite(BUZZER_PIN, HIGH);
delay(300);
}
}
Final Processing Code
import processing.serial.*;
Serial myPort;
String data;
int gas = 0;
void setup() {
size(500, 500);
// Change COM3 to your Arduino port
myPort = new Serial(this, "COM3", 115200);
myPort.bufferUntil('\n');
textAlign(CENTER);
}
void draw() {
background(210);
// Main panel
fill(245, 240, 190);
rect(80, 50, 340, 380);
// Default inactive indicators
fill(80);
ellipse(width / 2, 190, 55, 55);
ellipse(width / 2, 260, 55, 55);
ellipse(width / 2, 330, 55, 55);
// SAFE state
if (gas < 200) {
textSize(45);
fill(0, 220, 0);
text("SAFE", width / 2, 120);
fill(0, 220, 0);
ellipse(width / 2, 330, 55, 55);
textSize(30);
fill(0, 220, 0);
text(gas + " ppm", width / 2, 430);
}
// WARNING state
else if (gas < 600) {
textSize(45);
fill(230, 220, 0);
text("WARNING", width / 2, 120);
fill(230, 220, 0);
ellipse(width / 2, 260, 55, 55);
textSize(30);
fill(230, 220, 0);
text(gas + " ppm", width / 2, 430);
}
// DANGER state
else {
textSize(45);
fill(220, 0, 0);
text("DANGER", width / 2, 120);
fill(220, 0, 0);
ellipse(width / 2, 190, 55, 55);
textSize(30);
fill(220, 0, 0);
text(gas + " ppm", width / 2, 430);
}
}
void serialEvent(Serial myPort) {
data = myPort.readStringUntil('\n');
if (data != null) {
data = trim(data);
gas = int(data);
}
}
Real-Life System Demonstration
The following video shows the real operation of the MQ-7 monitoring system, including:
- Arduino communication
- live sensor reading
- Processing visualization
- real-time color changes
- warning state transitions
System Demonstration Video
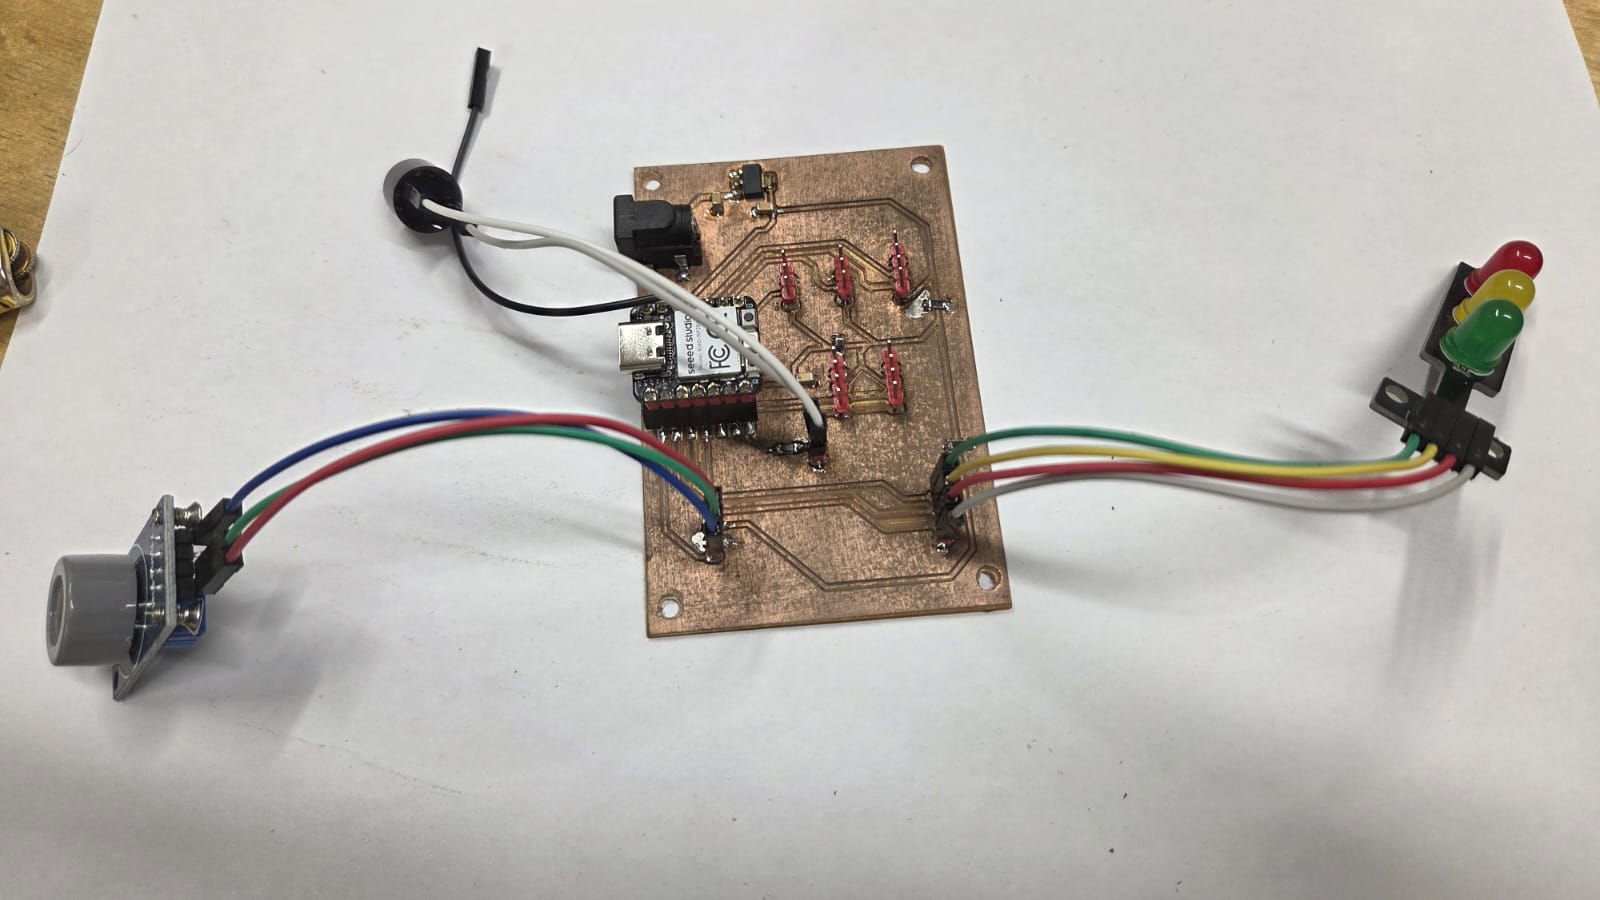
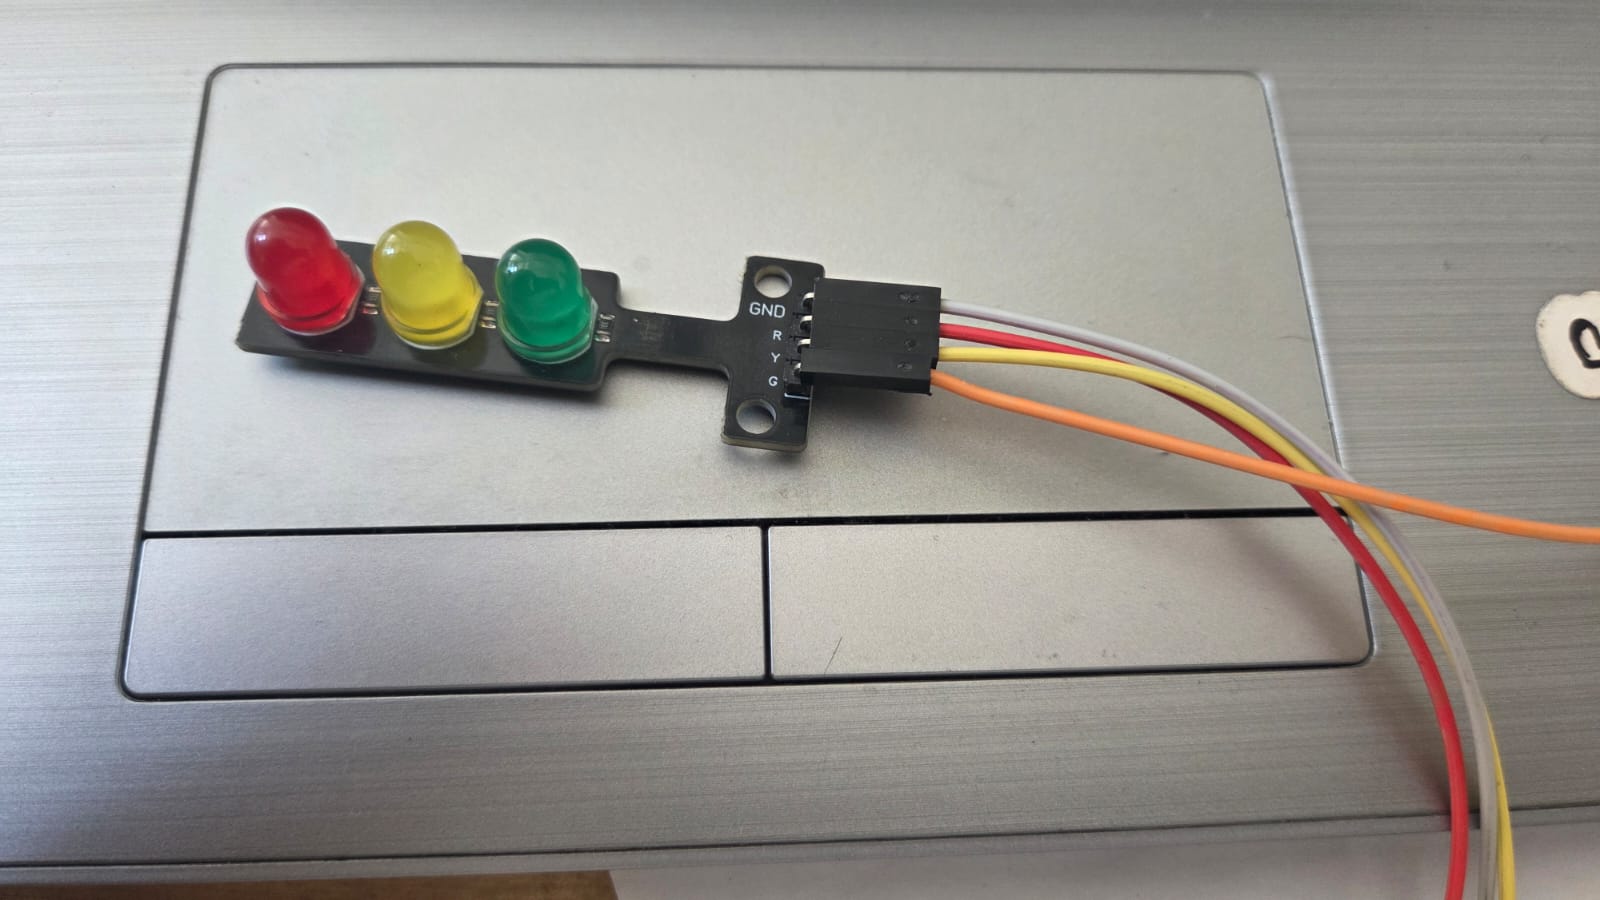
Hardware Setup
Full System Overview

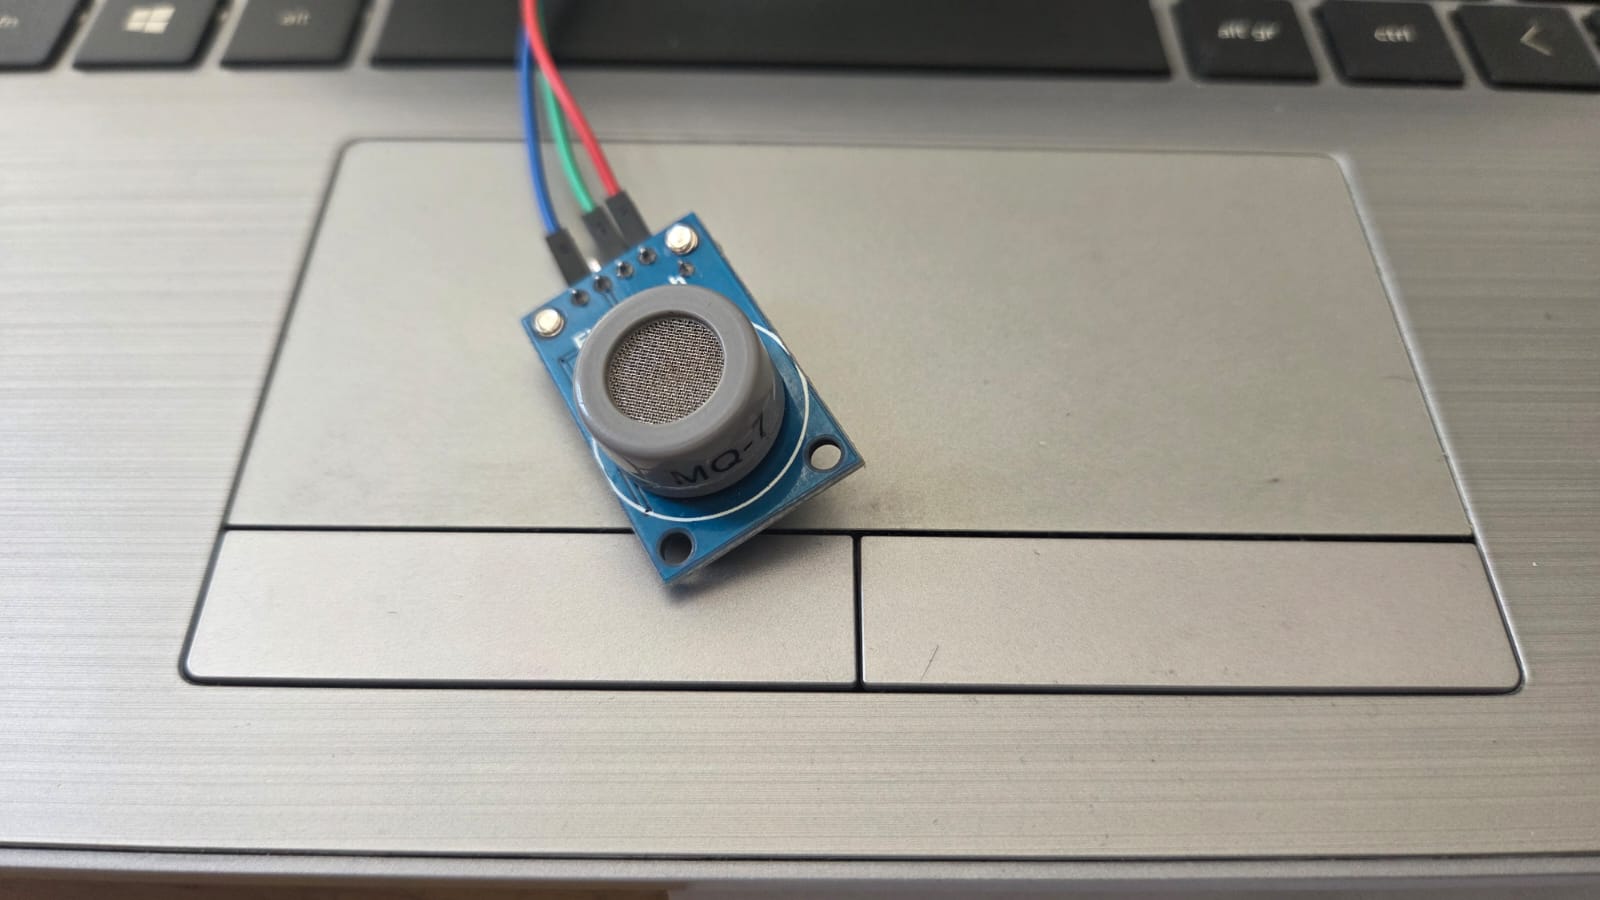
MQ-7 Sensor Connection

Arduino and Processing Communication

Processing Interface

Final Results of Both Experiments
First Communication Experiment Result
As a result of the first experiment, I understood how Processing and Arduino communicate through Serial Communication and how software can control hardware in real time.
This experiment helped me test the basic communication between my PCB and the computer.
Final MQ-7 Visualization System Result
As a result of the second experiment, I successfully created a real-time monitoring interface that visually represents gas concentration levels using Processing.
The system dynamically changes:
- colors
- warning states
- indicators
- ppm visualization
according to sensor data received from Arduino.
This experiment helped me better understand:
- serial communication
- real-time visualization
- Processing environment
- interactive interface logic
- sensor data interpretation
It also showed how digital interfaces can improve environmental monitoring systems and make sensor data easier to understand.
Reflection
This week helped me better understand the relationship between software interfaces and embedded electronics.
Through both experiments, I learned how real-time communication between hardware and software can be used to create interactive monitoring systems.
The first experiment helped me understand the basics of Serial Communication and hardware control through Processing.
The second experiment allowed me to connect these principles directly to my Final Project and transform sensor data into a visual environmental monitoring system.
This workflow became an important step toward developing a smarter and more interactive safety system for my Final Project.