Week15 — Interface and Application Programming
Group Assignment
For this week's group assignment, our lab evaluated a wide spectrum of programming tools—from hardware-focused environments like the Arduino IDE to visual routing tools like Node-RED, and even fully autonomous AI coding agents like Cursor and Claude Code. (You can view our full tool comparison matrix on the Week 15 — Group Assignment: Interface and Application Programming | FAB26 - ChaiHuo Makerspace 2026).
As I don't have any software engineering background, participating in this group research was incredibly helpful. It allowed me to map out exactly which tools I needed to survive the complex software integration of my Morin Khuur project. Here is my detailed personal tool stack and how the group comparison shaped my workflow:
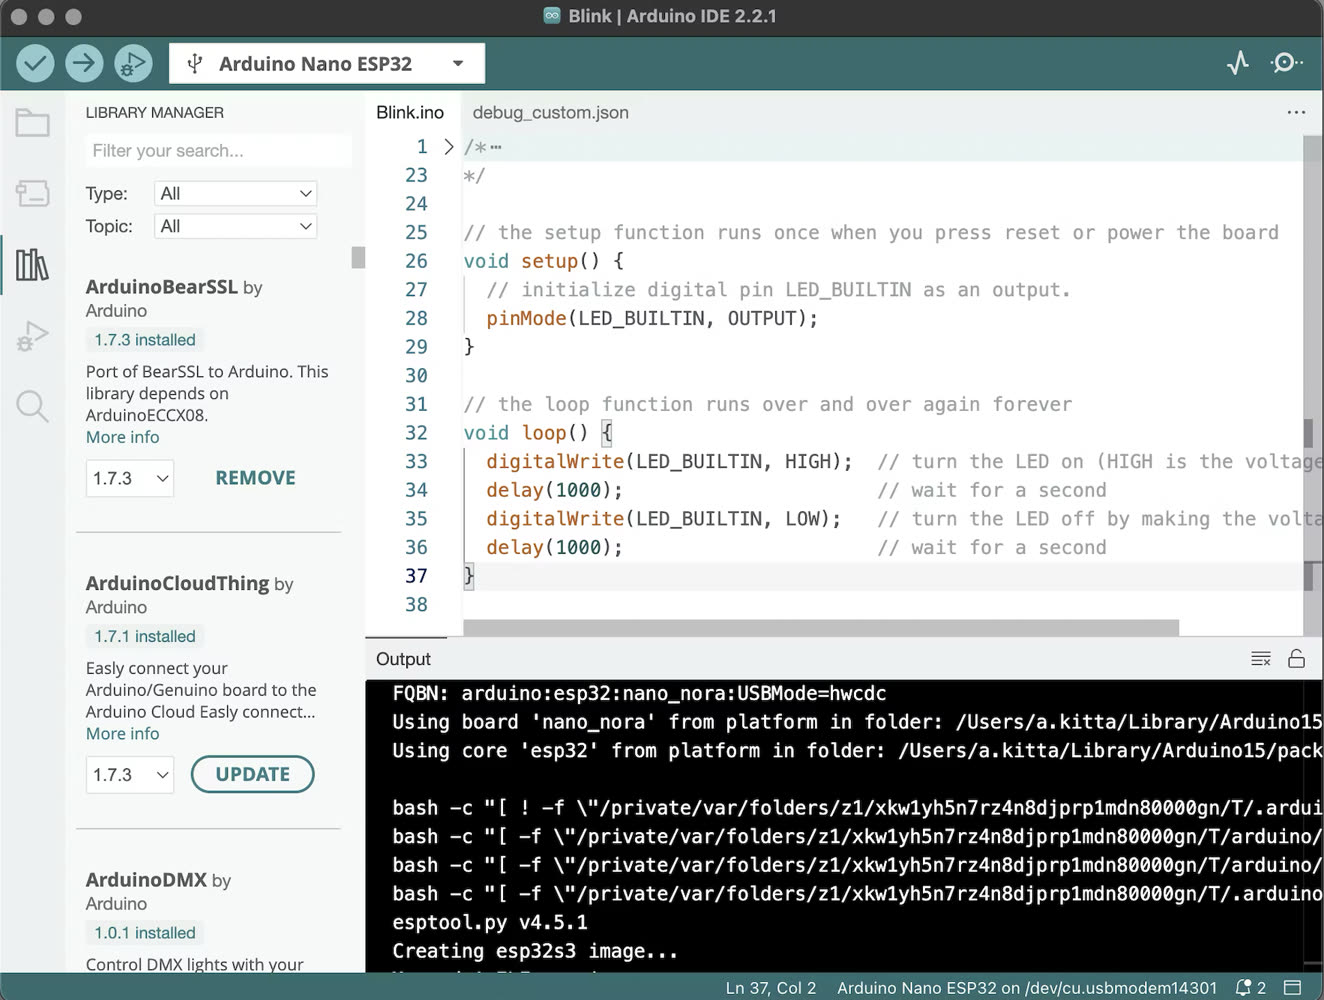
- The Hardware Reality: Arduino IDE While the group explored many modern IDEs, I realized that when it comes to raw hardware integration—like making the I2S microphone and WS2812 LEDs talk to the ESP32-C3—the Arduino IDE remains my most trusted tool. The built-in Serial Monitor and Serial Plotter gave me the direct, unshielded data feedback I needed to verify my FFT algorithms were working before attempting any network communication.
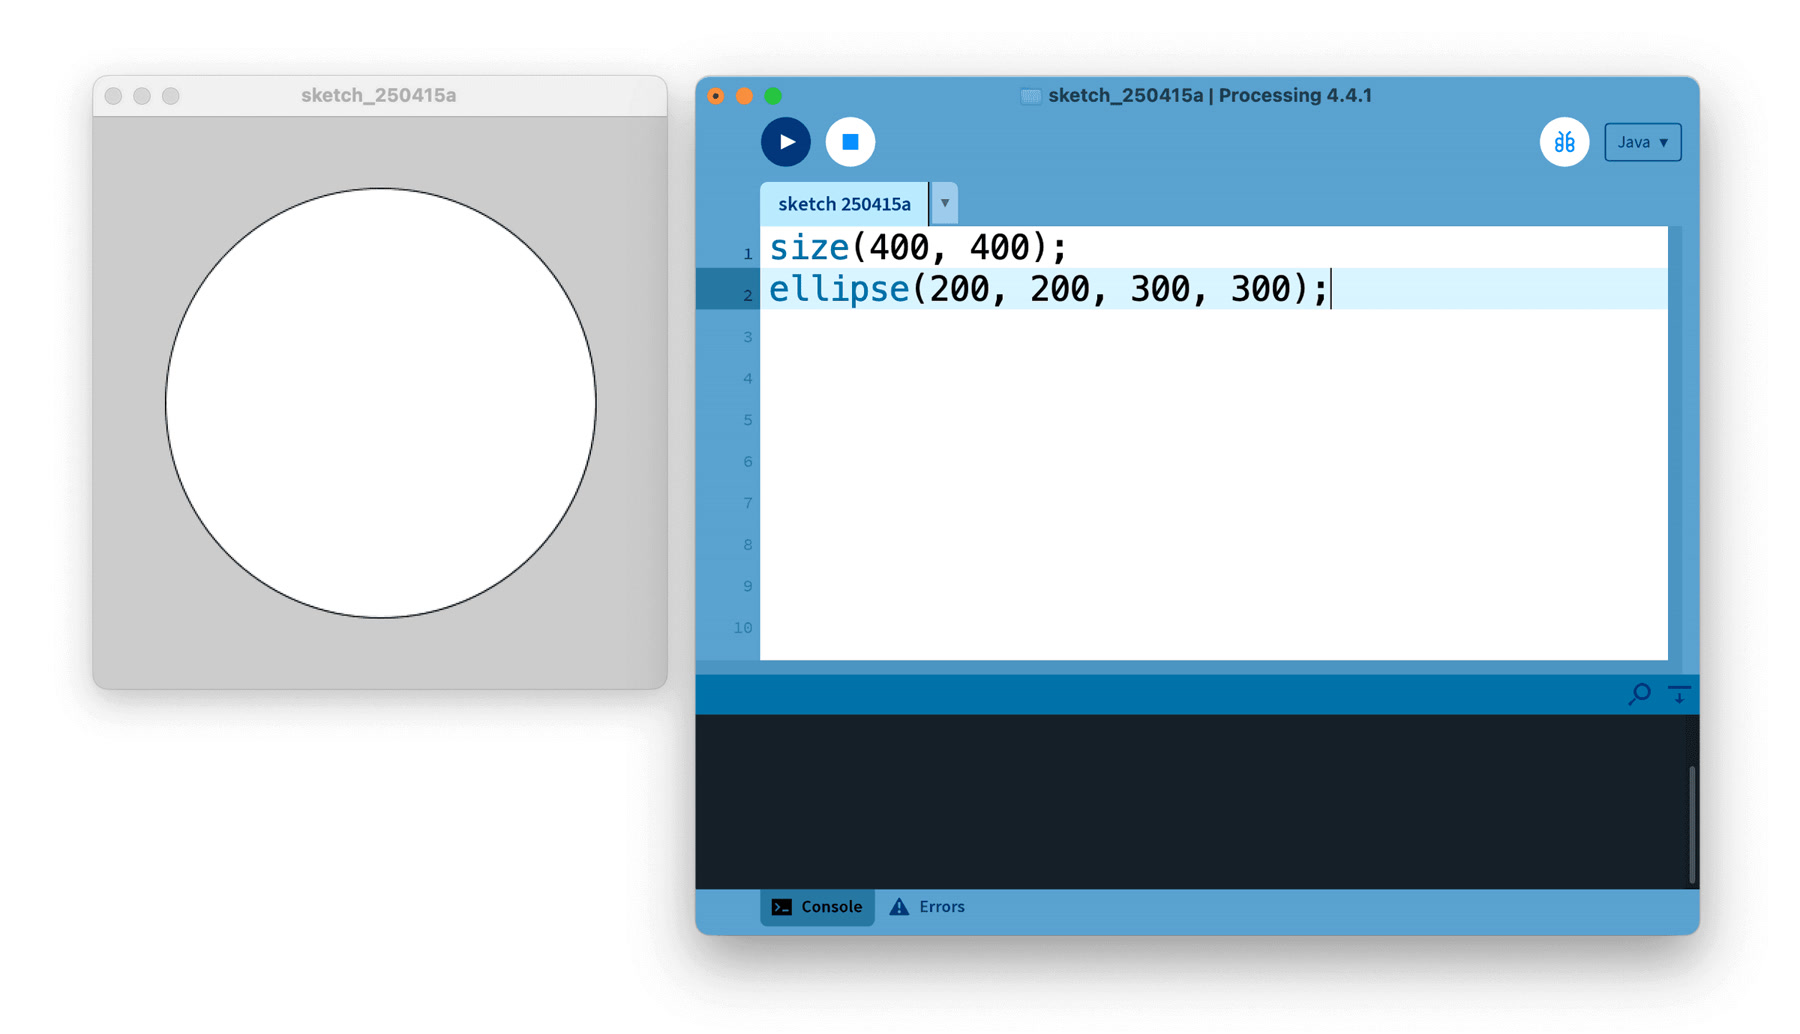
- The Rapid Prototyping Bridge: Processing Before diving into complex web development, I needed a fast way to prove my data could be visualized over a network. I used Processing (Java). Because it is specifically built for the visual arts, I was able to whip up a quick UDP receiver sketch. It acted as my "Version 1" dashboard, proving that the physical Morin Khuur could successfully send real-time audio data to a computer screen without latency.
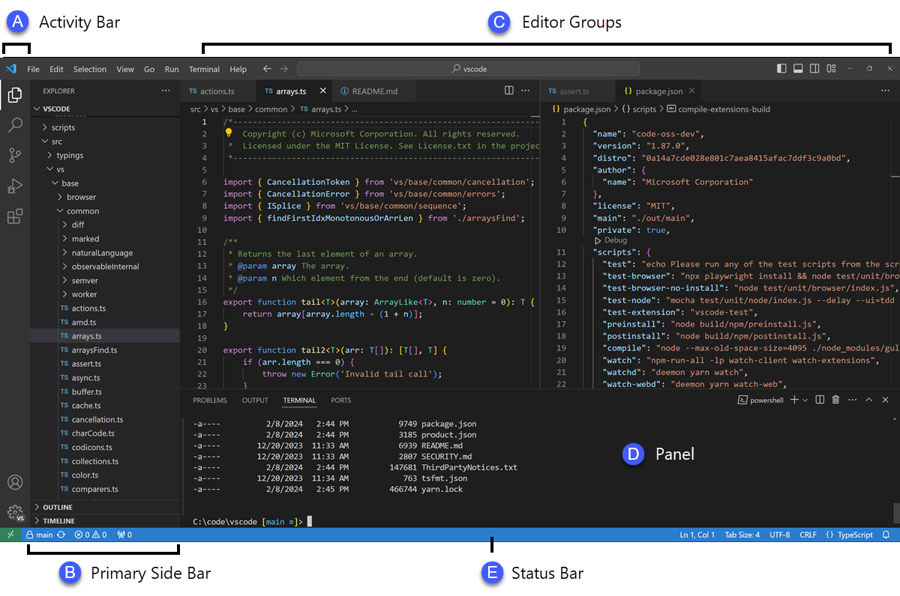
- The Frontend Shift: VS Code For the final interface, I wanted a standalone, modern dashboard. Our group's evaluation of VS Code convinced me to use it as my primary editor for building the Web UI. It provided the perfect lightweight environment to organize my HTML, CSS, and JavaScript files, while the live server extension allowed me to instantly see my WebSocket visualizer update as I tweaked the frontend code.
- The AI Pair-Programmer: Gemini over Autonomous Agents Interestingly, while my group tested highly autonomous agents like Cursor, I wanted to stay in complete control of my project's architecture. Instead, my biggest breakthrough came from using Gemini as a conversational pair-programmer. I would explain the system logic in plain English—such as, "I need a JavaScript WebSocket client that dynamically changes the radius of HTML canvas circles based on incoming FFT data." Gemini generated the snippets, explained the syntax, and I manually integrated them into VS Code.
Conclusion: This group exercise taught me that building a complex interface isn't about memorizing every line of syntax, but about system design. By chaining together the raw hardware reliability of Arduino IDE, the rapid prototyping power of Processing, the frontend flexibility of VS Code, and the conversational AI assistance of Gemini, I successfully built a real-time web dashboard that brought my digital Morin Khuur to life.
Individual Assignment
Introduction: Visualizing the Digital Morin Khuur
For this week's Interface and Application Programming assignment, my goal was to build a real-time visual dashboard that could "read" the live audio data generated by my final project, the new designed musical instrument Morin Khuur. I needed to create a seamless bridge between the embedded hardware inside the instrument and a computer screen.
The core hardware is an ESP32-C3 that uses an FFT algorithm to slice incoming I2S microphone audio into Bass, Mid, and Treble frequencies. To translate this invisible data into a graphical interface, I actually went through two major software iterations:
The Prototype (Processing & UDP): I started by writing a custom visualizer sketch in Processing. I programmed ESP32 to broadcast the frequency values over the local Wi-Fi using the UDP protocol. Because UDP is connectionless and extremely fast, it was the perfect "quick and dirty" starting point to prove that real-time audio streaming worked without lag.
The Final Application (Web UI & WebSockets): For the final version, I wanted a more modern, standalone interface that didn't require installing Processing to run. I upgraded the ESP32 firmware to act as a WebSocket server. Then, using VS Code, I programmed a custom, browser-based dashboard using HTML, CSS, and JavaScript. This allowed me to create a highly responsive, generative visualizer that breathes with the music and runs natively in any web browser.
This page documents my workflow and the code evolution from setting up that first UDP packet in Processing to developing the final interactive WebSocket web app.
A Quick Note on the Network Architecture
In Week 11: Networking and Communications, I already documented the embedded firmware side of this project. I detailed how the ESP32-C3 processes the I2S microphone data, sets up a Wi-Fi connection, and formats the packets for the initial UDP prototype.
Therefore, for this Week 15 documentation, I will strictly focus on the Application layer—specifically, how I programmed the computer-side interfaces (Processing and the Web Browser) to catch that incoming data stream, parse it, and render it into a real-time responsive visualizer.
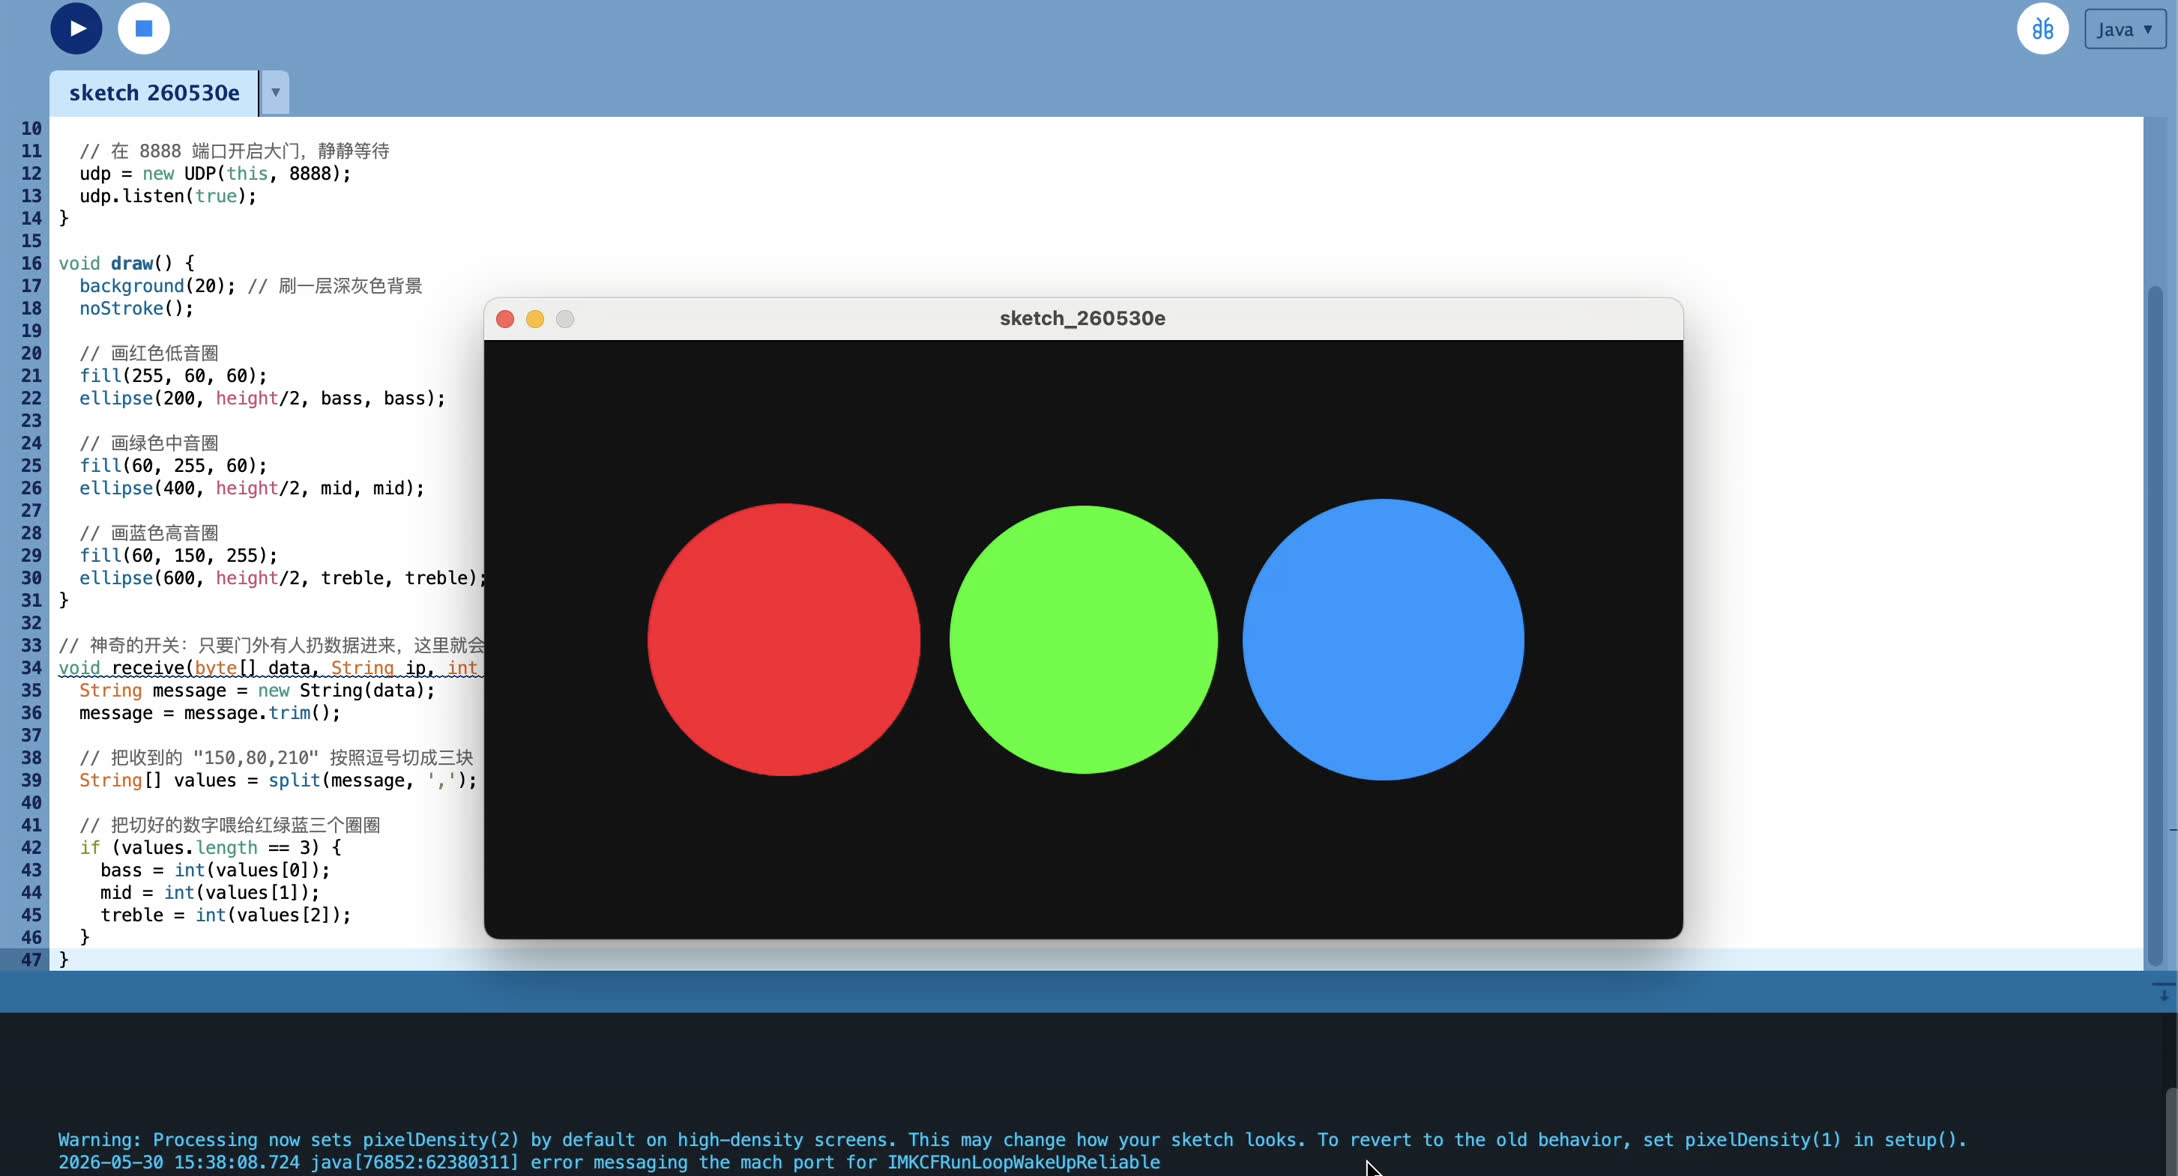
UDP Prototype
**Hardware-in-the-Loop Integration **
With the network verified, I merged the UDP transmitter into my main Morin Khuur program. Now, instead of generating random numbers, the ESP32C3 reads the live I2S audio stream, computes the FFT, categorizes the frequencies into Bass, Mid, and Treble energies, and maps them to a 0-255 scale.
To prevent the network transmission from blocking my local LED animations, I avoided using the delay() function. Instead, I used a millis() timer to ensure the UDP packet is fired exactly every 20 milliseconds (~50 FPS) asynchronously.
Arduino Code (Sender):
#include <Adafruit_NeoPixel.h>
#include <driver/i2s.h>
#include "arduinoFFT.h"
#include <WiFi.h>
#include <WiFiUdp.h>

// ================= Network Configuration (UDP) =================
/* * Connect the ESP32C3 to a 2.4GHz local network.
 * Ensure the computer running Processing is on the same network.
 */
const char* ssid = "Xiaomi 12S Ultra";
const char* password = "13572468";
const char* pc_ip = "192.168.183.102·";
const int udp_port = 8888;
WiFiUDP udp;

unsigned long lastUdpSendTime = 0;
const int udpInterval = 50; // Send packet every 50ms (20Hz)

// ================= Hardware Pin Configuration =================
#define LED_PIN     9
#define NUMPIXELS   160
Adafruit_NeoPixel strip(NUMPIXELS, LED_PIN, NEO_GRB + NEO_KHZ800);

#define I2S_PORT    I2S_NUM_0
#define I2S_SCK     D0
#define I2S_WS      D1
#define I2S_SD      D2

// ================= FFT Audio Processing Parameters =================
const uint16_t samples = 256;
const double samplingFrequency = 16000;
double vReal[samples];
double vImag[samples];

ArduinoFFT<double> FFT = ArduinoFFT<double>(vReal, vImag, samples, samplingFrequency);

void setup() {
  Serial.begin(115200);

  // 1. Initialize Network Connection
  Serial.print("Connecting to Wi-Fi...");
  WiFi.begin(ssid, password);
  while (WiFi.status() != WL_CONNECTED) {
    delay(500);
    Serial.print(".");
  }
  Serial.println("\nWiFi Connected! UDP Ready.");

  // 2. Initialize LED strip
  strip.begin();
  strip.setBrightness(20);
  strip.clear();
  strip.show();

  // 3. Configure I2S Microphone
  i2s_config_t i2s_config = {
    .mode = (i2s_mode_t)(I2S_MODE_MASTER | I2S_MODE_RX),
    .sample_rate = samplingFrequency,
    .bits_per_sample = I2S_BITS_PER_SAMPLE_32BIT,
    .channel_format = I2S_CHANNEL_FMT_ONLY_LEFT,
    .communication_format = I2S_COMM_FORMAT_STAND_I2S,
    .intr_alloc_flags = ESP_INTR_FLAG_LEVEL1,
    .dma_buf_count = 8,
    .dma_buf_len = 64,
    .use_apll = false
  };

  i2s_pin_config_t pin_config = {
    .bck_io_num = I2S_SCK,
    .ws_io_num = I2S_WS,
    .data_out_num = I2S_PIN_NO_CHANGE,
    .data_in_num = I2S_SD
  };

  i2s_driver_install(I2S_PORT, &i2s_config, 0, NULL);
  i2s_set_pin(I2S_PORT, &pin_config);
}

void loop() {
  // 1. Capture Audio Data
  size_t bytesIn = 0;
  int32_t sampleBuffer[samples];
  i2s_read(I2S_PORT, &sampleBuffer, sizeof(sampleBuffer), &bytesIn, portMAX_DELAY);

  int samplesRead = bytesIn / sizeof(int32_t);
  double totalVolume = 0;

  // 2. Data Cleaning
  for (int i = 0; i < samplesRead; i++) {
    int16_t audioValue = sampleBuffer[i] >> 14;
    vReal[i] = audioValue;
    vImag[i] = 0.0;
    totalVolume += abs(audioValue);
  }

  int averageVolume = totalVolume / samplesRead;

  // 3. Execute Fast Fourier Transform (FFT)
  FFT.windowing(FFT_WIN_TYP_HAMMING, FFT_FORWARD);
  FFT.compute(FFT_FORWARD);
  FFT.complexToMagnitude();

  // 4. Analyze Frequency Band Energy
  long bassEnergy = 0, midEnergy = 0, trebleEnergy = 0;
  for (int i = 2; i < (samplesRead / 2); i++) {
    if (i < 10) bassEnergy += vReal[i];
    else if (i < 40) midEnergy += vReal[i];
    else trebleEnergy += vReal[i];
  }

  // Variables for Visualizer and UDP
  int r = 0, g = 0, b = 0;
  strip.clear();

  // 5. Map Data to the LED Strip & Extract RGB Data
  if (averageVolume > 400) {
    int ledsToLight = map(averageVolume, 400, 8000, 1, NUMPIXELS / 2);
    if (ledsToLight > NUMPIXELS / 2) ledsToLight = NUMPIXELS / 2;

    r = map(bassEnergy, 0, 50000, 0, 255);
    g = map(midEnergy, 0, 30000, 0, 255);
    b = map(trebleEnergy, 0, 20000, 0, 255);

    r = constrain(r, 0, 255);
    g = constrain(g, 0, 255);
    b = constrain(b, 0, 255);

    int center = NUMPIXELS / 2;
    for (int i = 0; i < ledsToLight; i++) {
      strip.setPixelColor(center + i, strip.Color(r, g, b));
      strip.setPixelColor(center - 1 - i, strip.Color(r, g, b));
    }
  }
  strip.show();

  // 6. Non-blocking UDP Data Transmission
  unsigned long currentTime = millis();
  if (currentTime - lastUdpSendTime >= udpInterval) {
    lastUdpSendTime = currentTime;

    // Construct data packet format: "Bass,Mid,Treble"
    String dataString = String(r) + "," + String(g) + "," + String(b);

    udp.beginPacket(pc_ip, udp_port);
    udp.print(dataString);
    udp.endPacket();
  }
}
Processing Code (Receiver):
import hypermedia.net.*; // Import the UDP library

UDP udp;
int bass = 0;
int mid = 0;
int treble = 0;

void setup() {
  size(800, 400); // Set dashboard window size

  // Open port 8888 and listen for incoming packets from ESP32C3
  udp = new UDP(this, 8888);
  udp.listen(true);
}

void draw() {
  // Clear the background with a dark gray color each frame
  background(20);
  noStroke();

  // Draw Bass frequency indicator (Red)
  fill(255, 60, 60);
  ellipse(200, height/2, bass, bass);

  // Draw Mid frequency indicator (Green)
  fill(60, 255, 60);
  ellipse(400, height/2, mid, mid);

  // Draw Treble frequency indicator (Blue)
  fill(60, 150, 255);
  ellipse(600, height/2, treble, treble);
}

/**
 * Event Listener: Triggered automatically when a UDP packet arrives
 */
void receive(byte[] data, String ip, int port) {
  // Convert incoming raw bytes to string
  String message = new String(data);
  message = message.trim();

  // Parse the comma-separated values (e.g., "150,80,210")
  String[] values = split(message, ',');

  // Assign mapped RGB/Audio values to circle diameters
  if (values.length == 3) {
    bass = int(values[0]);
    mid = int(values[1]);
    treble = int(values[2]);
  }
}
RGB Circle Visual effect:
Visual Evolution (From Circles to Generative Waves)
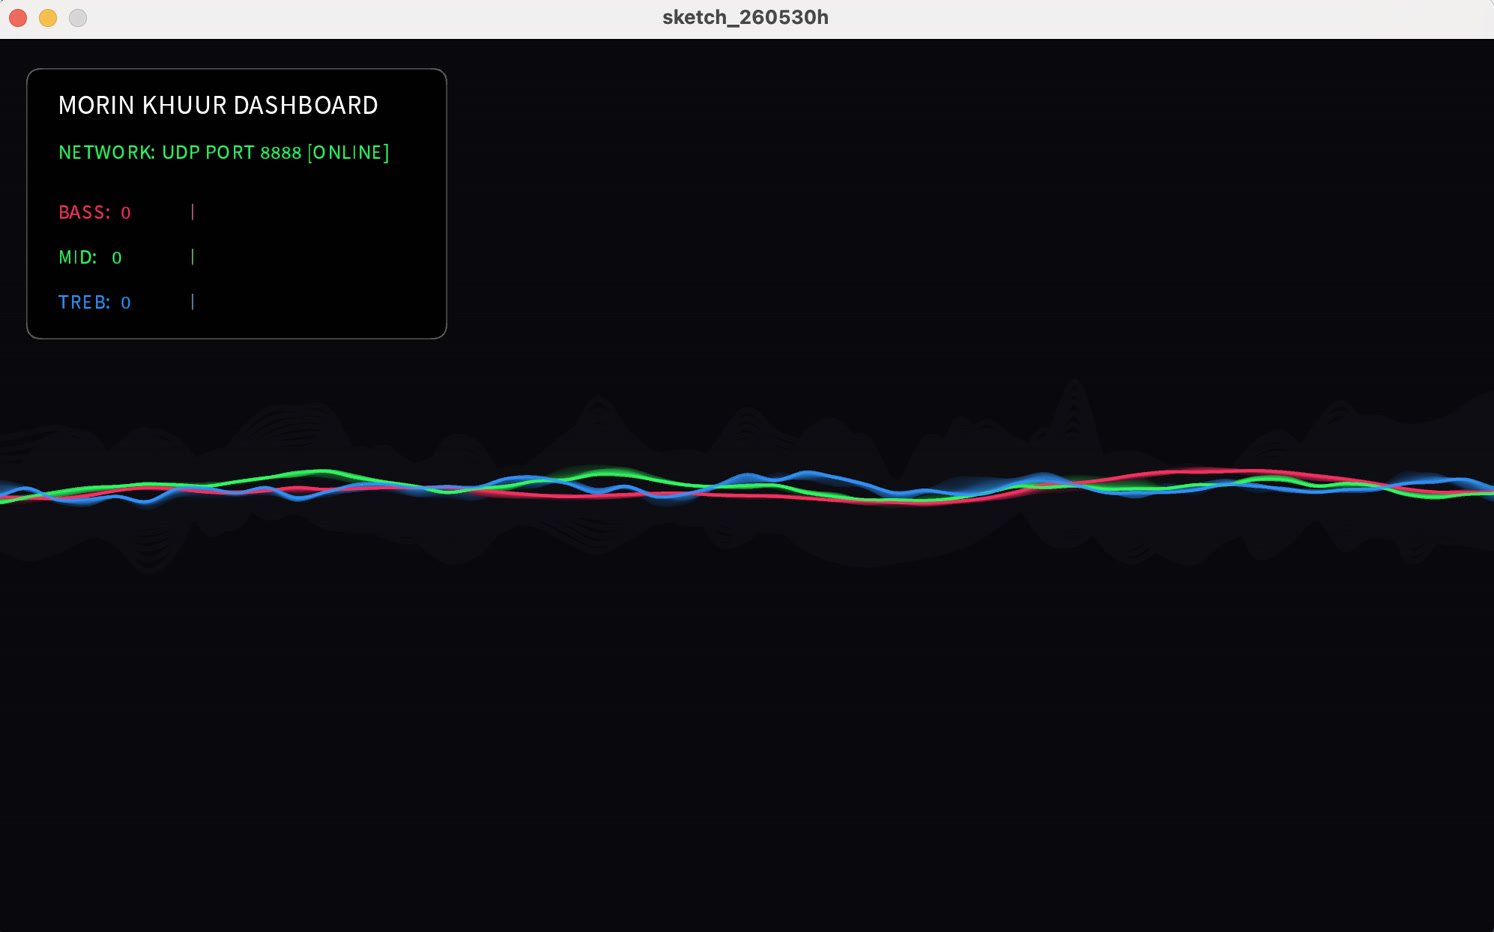
While the three bouncing circles proved the data was arriving, they did not capture the artistic essence of a musical instrument. I completely changed the Processing visual rendering engine to create organic, continuous linear waveforms.
Linear Interpolation (Lerp): Raw audio data is inherently noisy and jittery. I applied a lerp() function to the incoming variables. This acted as a mathematical shock-absorber, smoothing out the aggressive jumps and giving the visuals a fluid, damped motion.
Perlin Noise: Instead of drawing basic geometric shapes, I used the noise() function combined with curveVertex() to generate flowing, terrain-like neon lines. The amplitude of these waves was directly driven by the smoothed Bass, Mid, and Treble values.
**Processing Code (Audio Reactive Waveform)****: **
import hypermedia.net.*; // Import UDP library

UDP udp;
float bass = 0, mid = 0, treble = 0;

// 1. Easing variables (makes the jumping smooth like silk)
float smoothBass = 0, smoothMid = 0, smoothTreble = 0;
// 2. Time variable (makes the wave flow forward automatically)
float time = 0;

void setup() {
  // P2D mode enables GPU hardware acceleration for ultra-smooth rendering
  size(1000, 600, P2D);
  background(10, 10, 15); // Dark night gray background

  udp = new UDP(this, 8888);
  udp.listen(true);
}

void draw() {
  // Magic 1: Motion Blur Effect
  // Instead of clearing the screen with background(), we draw a
  // semi-transparent black rectangle to create a trailing ghost effect.
  fill(10, 10, 15, 40);
  noStroke();
  rect(0, 0, width, height);

  // Magic 2: Linear Interpolation (Lerp)
  // Buffers the violent jumps of raw audio data into smooth transitions
  smoothBass = lerp(smoothBass, bass, 0.1);
  smoothMid = lerp(smoothMid, mid, 0.1);
  smoothTreble = lerp(smoothTreble, treble, 0.1);

  // Time progression controls the scrolling speed of the waves
  time += 0.015;

  // Magic 3: Draw three organically flowing light waves
  // Parameters: (Intensity, Color, Noise Scale, Time, Layer Offset)
  drawNeonWave(smoothBass, color(255, 50, 100), 0.005, time, 1);       // Red Bass wave (Thick, slow)
  drawNeonWave(smoothMid, color(50, 255, 100), 0.01, time * 1.5, 2);   // Green Mid wave (Medium, faster)
  drawNeonWave(smoothTreble, color(50, 150, 255), 0.02, time * 2.0, 3);// Blue Treble wave (Thin, fastest)
}

/**
 * Core function to draw glowing fluid waves
 */
void drawNeonWave(float intensity, int c, float noiseScale, float t, int layer) {
  noFill();
  // The louder the sound, the thicker the line (from 1 to 6 pixels)
  strokeWeight(map(intensity, 0, 255, 1, 6));
  // Set line color and add transparency (200) for a glowing halo effect
  stroke(c, 200);

  beginShape();
  // Draw from the far left to the far right of the screen
  for (float x = -20; x <= width + 20; x += 20) {

    // The louder the sound, the larger the wave amplitude (up and down fluctuation)
    float amplitude = map(intensity, 0, 255, 10, height / 2.5);

    // Use Perlin Noise to calculate highly natural, terrain-like organic undulations
    float noiseVal = noise(x * noiseScale, t + layer * 100);
    float y = height / 2 + (noiseVal - 0.5) * amplitude * 2;

    // Draw the curve vertex
    curveVertex(x, y);
  }
  endShape();
}

/**
 * Event Listener: Triggered automatically when a UDP packet arrives
 */
void receive(byte[] data, String ip, int port) {
  // Convert incoming raw bytes to string
  String message = new String(data);
  message = message.trim();

  // Parse the comma-separated values (e.g., "150,80,210")
  String[] values = split(message, ',');

  if (values.length == 3) {
    // Assign mapped values to variables (wait for draw() to smooth them out)
    bass = float(values[0]);
    mid = float(values[1]);
    treble = float(values[2]);
  }
}
Constructing the Engineering Dashboard (HUD)
I developed an overlay function (drawDashboard()) to act as a Head-Up Display (HUD) on top of the waveforms. This Dashboard features:
Network Status Indicator: Displays whether the UDP connection is active and listening on the designated port.
Raw Data Readouts: Prints the exact parsed integers (0-255) for the frequency bands in real-time.
Dynamic Bar Charts: Visualizes the numerical data as horizontal progression bars, giving an immediate, quantifiable representation of the audio energy.
Processing Code (HUD Dashboard):
import hypermedia.net.*; // Import UDP library

UDP udp;
float bass = 0, mid = 0, treble = 0;

// Easing variables
float smoothBass = 0, smoothMid = 0, smoothTreble = 0;
float time = 0;

void setup() {
  size(1000, 600, P2D);
  background(10, 10, 15);

  udp = new UDP(this, 8888);
  udp.listen(true);
}

void draw() {
  // 1. Motion Blur Background
  fill(10, 10, 15, 40);
  noStroke();
  rect(0, 0, width, height);

  // 2. Data Smoothing
  smoothBass = lerp(smoothBass, bass, 0.1);
  smoothMid = lerp(smoothMid, mid, 0.1);
  smoothTreble = lerp(smoothTreble, treble, 0.1);
  time += 0.015;

  // 3. Draw Generative Art Waves (The visual feedback)
  drawNeonWave(smoothBass, color(255, 50, 100), 0.005, time, 1);
  drawNeonWave(smoothMid, color(50, 255, 100), 0.01, time * 1.5, 2);
  drawNeonWave(smoothTreble, color(50, 150, 255), 0.02, time * 2.0, 3);

  // 4. DRAW THE DASHBOARD INTERFACE (The engineering requirement!)
  drawDashboard();
}

/**
 * 🆕 新增功能:绘制经典的工程控制面板 (Dashboard GUI)
 */
void drawDashboard() {
  // Draw a semi-transparent dark panel for the UI
  fill(0, 0, 0, 180);
  stroke(100, 100, 100, 100);
  strokeWeight(1);
  rect(20, 20, 280, 180, 10); // Rounded rectangle panel

  // Dashboard Title
  fill(255);
  textSize(18);
  text("MORIN KHUUR DASHBOARD", 40, 50);

  // Network Status
  textSize(14);
  fill(50, 255, 100); // Green online text
  text("NETWORK: UDP PORT 8888 [ONLINE]", 40, 80);

  // Raw Data Readouts & Bar Charts
  // BASS
  fill(255, 50, 100);
  text("BASS:  " + int(smoothBass), 40, 120);
  rect(130, 110, map(smoothBass, 0, 255, 0, 140), 10); // Dynamic Bar Chart

  // MID
  fill(50, 255, 100);
  text("MID:   " + int(smoothMid), 40, 150);
  rect(130, 140, map(smoothMid, 0, 255, 0, 140), 10);  // Dynamic Bar Chart

  // TREBLE
  fill(50, 150, 255);
  text("TREB:  " + int(smoothTreble), 40, 180);
  rect(130, 170, map(smoothTreble, 0, 255, 0, 140), 10); // Dynamic Bar Chart
}

/**
 * Core function to draw glowing fluid waves
 */
void drawNeonWave(float intensity, int c, float noiseScale, float t, int layer) {
  noFill();
  strokeWeight(map(intensity, 0, 150, 2, 12));
  stroke(c, 200);

  beginShape();
  for (float x = -20; x <= width + 20; x += 20) {
    float amplitude = map(intensity, 0, 150, 20, height / 1.2);
    float noiseVal = noise(x * noiseScale, t + layer * 100);
    float y = height / 2 + (noiseVal - 0.5) * amplitude * 2;
    curveVertex(x, y);
  }
  endShape();
}

/**
 * Event Listener: Receives UDP packets
 */
void receive(byte[] data, String ip, int port) {
  String message = new String(data);
  message = message.trim();
  String[] values = split(message, ',');

  if (values.length == 3) {
    bass = float(values[0]);
    mid = float(values[1]);
    treble = float(values[2]);
  }
}
By combining the generative art with the precise engineering data dashboard, the interface serves both as a diagnostic tool for system tuning and a captivating audio-visual performance piece.
System Tuning and Calibration
During the final test, the visualizer was too sensitive to background room noise. I had to tune the High Dynamic Range (HDR) of the system in the Arduino code. I raised the activation threshold to 300. Now, the system ignores fan noise and only reacts to the actual resonance of the Morin Khuur.
I expanded the mapping ceiling from 5000 to 8000 (map(averageVolume, 300, 8000, 1, NUMPIXELS / 2);). This gives me a massive expressive range: light bowing creates gentle ripples, while aggressive playing sends the neon waves crashing across the entire screen.

Fixing Visual Stuttering & Latency
During the initial test, the generative waveform in the Processing dashboard appeared jittery and stuttering, lacking the fluid motion expected from an audio visualizer. The issue was caused by a synchronization mismatch between the hardware data transmission and the software rendering. In the initial Arduino code, the udpInterval was set to 50 milliseconds, meaning the ESP32C3 was sending data at 20 FPS (frames per second). However, the Processing draw() loop refreshes the computer screen at 60 FPS. Since the screen was updating faster than the data was arriving, it created visual gaps and sudden jumps.
To achieve a buttery-smooth visualization, I made two quick adjustments across the system:
- Hardware Side (Arduino): I decreased the
udpIntervalto16milliseconds. This forces the ESP32C3 to broadcast UDP packets at roughly 60Hz, perfectly matching the refresh rate of the computer display.

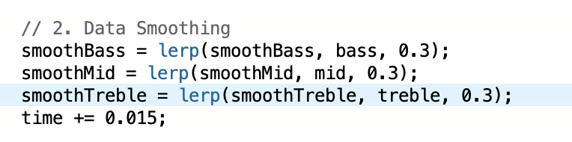
- Software Side (Processing): To eliminate any remaining micro-jitters without losing the snappy responsiveness to the instrument, I fine-tuned the Linear Interpolation (
lerp) factor. I increased it from0.1to0.3, which provided the perfect balance between a fluid organic look and real-time audio reactivity.
After this adjustment, the latency is gone. The physical Morin Khuur playing and the generative cyber-waves on the screen are now perfectly synchronized in real-time at 60 FPS.
[1d3cd7a689117c04f979cbc64f9edb4a.mp4]
Web-Based Audio Visualizer using WebSocket and p5.js
While the local Processing application worked perfectly, I wanted to elevate the project by making the dashboard accessible via any standard web browser. This required an architectural shift. Standard web browsers cannot directly receive raw UDP packets due to security protocols. To bridge the gap between the microcontroller and the browser, I upgraded the ESP32C3 to act as a WebSocket Server. WebSocket provides a persistent, low-latency, full-duplex communication channel over a single TCP connection, which is the industry standard for real-time web applications.
Hardware Implementation (ESP32C3 WebSocket Server)
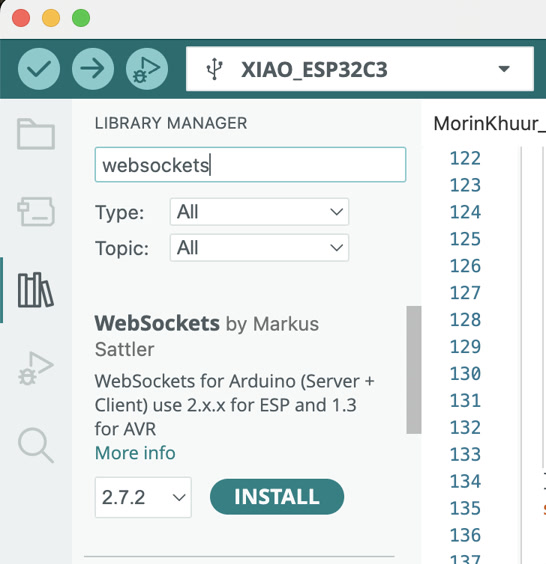
I utilized the WebSocketsServer library by Markus Sattler. The ESP32C3 now opens port 81 and waits for incoming connections from a web client. To ensure the generative art animation on the web runs smoothly without the stuttering issues I encountered earlier, I optimized the data transmission rate. I set the broadcast interval to 20 milliseconds, which means the ESP32 pushes data at 50 FPS. This perfectly synchronizes the hardware sampling with the browser's rendering cycle.
Arduino WebSocket Sender Code:
#include <Adafruit_NeoPixel.h>
#include <driver/i2s.h>
#include "arduinoFFT.h"
#include <WiFi.h>
#include <WebSocketsServer.h>

// ================= 1. Network Configuration =================
// Replace with your actual Wi-Fi hotspot credentials
const char* ssid = "Xiaomi 12S Ultra";
const char* password = "13572468";

// Start WebSocket server on port 81
WebSocketsServer webSocket = WebSocketsServer(81);

unsigned long lastSendTime = 0;
// Set transmission interval to 20ms (~50 FPS) for buttery smooth visuals
const int sendInterval = 20;

// ================= 2. Hardware & FFT Configuration =================
#define LED_PIN     9
#define NUMPIXELS   160
Adafruit_NeoPixel strip(NUMPIXELS, LED_PIN, NEO_GRB + NEO_KHZ800);

#define I2S_PORT    I2S_NUM_0
#define I2S_SCK     D0
#define I2S_WS      D1
#define I2S_SD      D2

const uint16_t samples = 256;
const double samplingFrequency = 16000;
double vReal[samples];
double vImag[samples];
ArduinoFFT<double> FFT = ArduinoFFT<double>(vReal, vImag, samples, samplingFrequency);

void setup() {
  Serial.begin(115200);

  // Initialize Wi-Fi Connection
  Serial.print("Connecting to Wi-Fi...");
  WiFi.begin(ssid, password);
  while (WiFi.status() != WL_CONNECTED) {
    delay(500);
    Serial.print(".");
  }
  Serial.println("\nWiFi Connected!");

  // CRITICAL: Print the ESP32 IP address. You need this for the HTML file!
  Serial.print("ESP32 IP Address: ");
  Serial.println(WiFi.localIP());

  // Initialize WebSocket Server
  webSocket.begin();

  // Initialize NeoPixel LED Strip
  strip.begin();
  strip.setBrightness(20);
  strip.clear();
  strip.show();

  // Configure I2S Microphone
  i2s_config_t i2s_config = {
    .mode = (i2s_mode_t)(I2S_MODE_MASTER | I2S_MODE_RX),
    .sample_rate = samplingFrequency,
    .bits_per_sample = I2S_BITS_PER_SAMPLE_32BIT,
    .channel_format = I2S_CHANNEL_FMT_ONLY_LEFT,
    .communication_format = I2S_COMM_FORMAT_STAND_I2S,
    .intr_alloc_flags = ESP_INTR_FLAG_LEVEL1,
    .dma_buf_count = 8,
    .dma_buf_len = 64,
    .use_apll = false
  };
  i2s_pin_config_t pin_config = {
    .bck_io_num = I2S_SCK,
    .ws_io_num = I2S_WS,
    .data_out_num = I2S_PIN_NO_CHANGE,
    .data_in_num = I2S_SD
  };
  i2s_driver_install(I2S_PORT, &i2s_config, 0, NULL);
  i2s_set_pin(I2S_PORT, &pin_config);
}

void loop() {
  // Keep WebSocket connection alive
  webSocket.loop();

  // 1. Capture Audio Data
  size_t bytesIn = 0;
  int32_t sampleBuffer[samples];
  i2s_read(I2S_PORT, &sampleBuffer, sizeof(sampleBuffer), &bytesIn, portMAX_DELAY);

  int samplesRead = bytesIn / sizeof(int32_t);
  double totalVolume = 0;

  // 2. Data Cleaning
  for (int i = 0; i < samplesRead; i++) {
    int16_t audioValue = sampleBuffer[i] >> 14;
    vReal[i] = audioValue;
    vImag[i] = 0.0;
    totalVolume += abs(audioValue);
  }

  int averageVolume = totalVolume / samplesRead;

  // 3. Execute Fast Fourier Transform (FFT)
  FFT.windowing(FFT_WIN_TYP_HAMMING, FFT_FORWARD);
  FFT.compute(FFT_FORWARD);
  FFT.complexToMagnitude();

  // 4. Analyze Frequency Band Energy
  long bassEnergy = 0, midEnergy = 0, trebleEnergy = 0;
  for (int i = 2; i < (samplesRead / 2); i++) {
    if (i < 10) bassEnergy += vReal[i];
    else if (i < 40) midEnergy += vReal[i];
    else trebleEnergy += vReal[i];
  }

  int r = 0, g = 0, b = 0;
  strip.clear();

  // 5. Map Data to the LED Strip (Using tuned HDR parameters)
  if (averageVolume > 400) {
    int ledsToLight = map(averageVolume, 400, 8000, 1, NUMPIXELS / 2);
    if (ledsToLight > NUMPIXELS / 2) ledsToLight = NUMPIXELS / 2;

    r = map(bassEnergy, 0, 50000, 0, 255);
    g = map(midEnergy, 0, 30000, 0, 255);
    b = map(trebleEnergy, 0, 20000, 0, 255);

    r = constrain(r, 0, 255);
    g = constrain(g, 0, 255);
    b = constrain(b, 0, 255);

    int center = NUMPIXELS / 2;
    for (int i = 0; i < ledsToLight; i++) {
      strip.setPixelColor(center + i, strip.Color(r, g, b));
      strip.setPixelColor(center - 1 - i, strip.Color(r, g, b));
    }
  }
  strip.show();

  // 6. Broadcast Data via WebSocket
  unsigned long currentTime = millis();
  if (currentTime - lastSendTime >= sendInterval) {
    lastSendTime = currentTime;

    // Construct data packet: "R,G,B"
    String dataString = String(r) + "," + String(g) + "," + String(b);

    // Broadcast text to all connected HTML clients
    webSocket.broadcastTXT(dataString);
  }
}
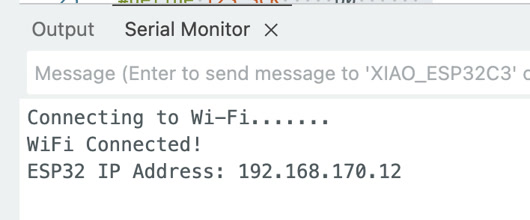
I copied the ESP32 IP address from Serial Monitor which will be used for the HTML & JS receiver code.
ESP32 IP Address: 192.168.170.12
Development Environment & Workflow (VS Code)
To develop the frontend interface, I shifted from the Arduino IDE to Visual Studio Code (VS Code). It's my first time using VS Code, I downloaded it from the website.
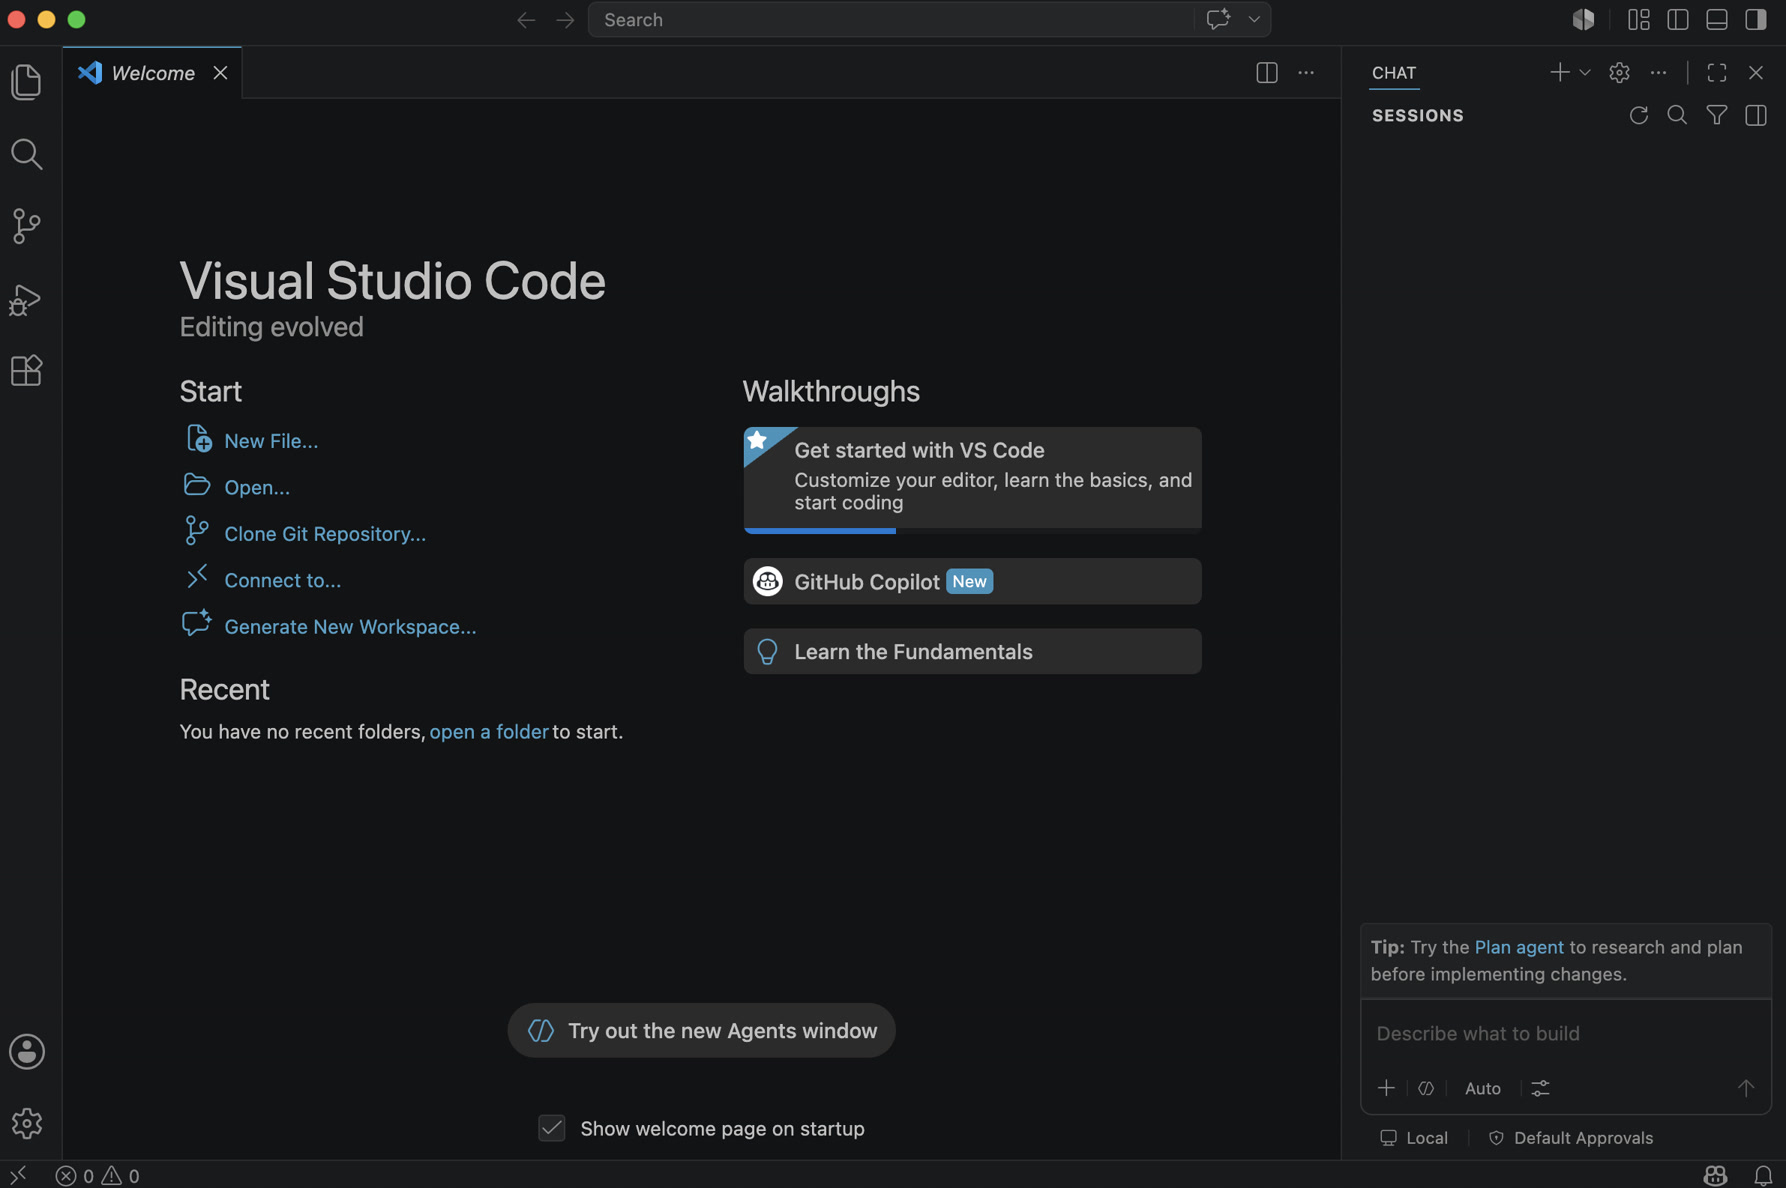
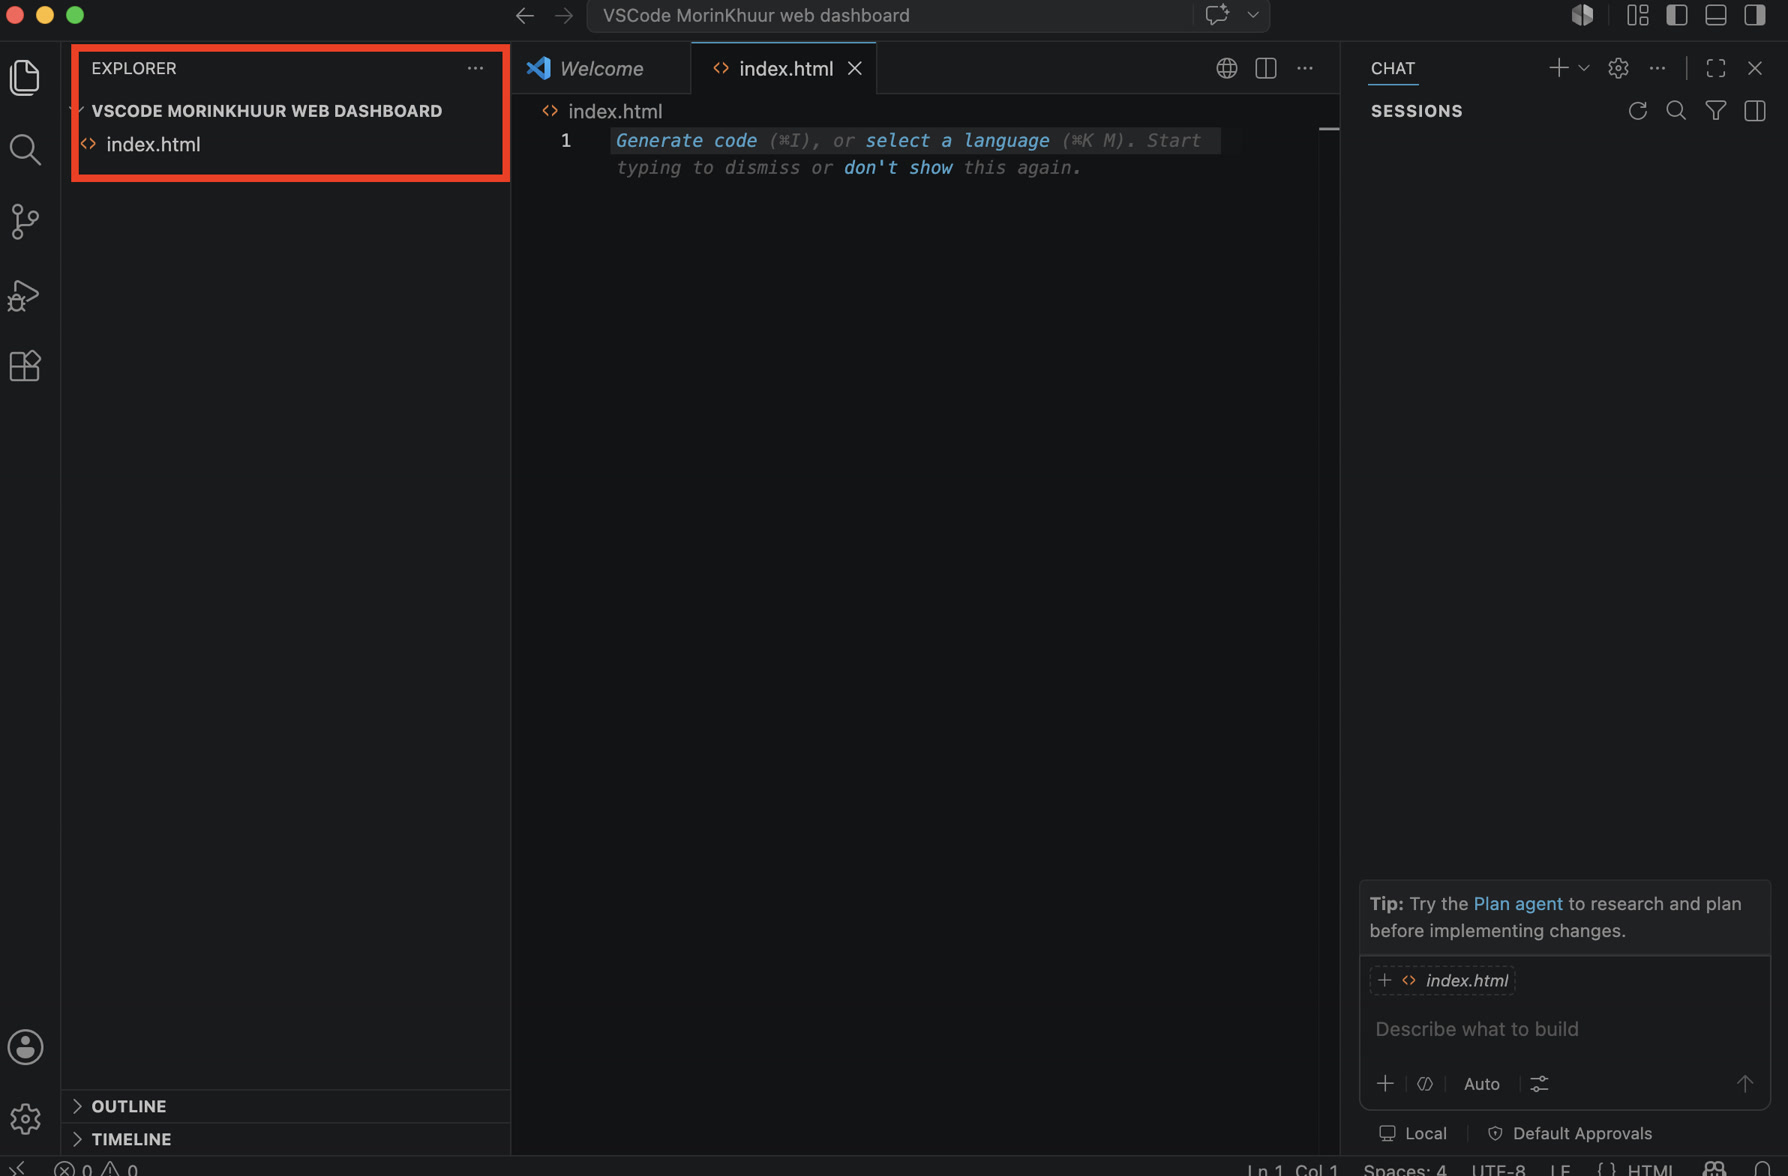
I created a dedicated project directory and initialized an index.html file. VS Code provided an environment for writing and formatting both the HTML structure and the embedded JavaScript (p5.js) logic.
Software Implementation (HTML UI & p5.js Generative Art)
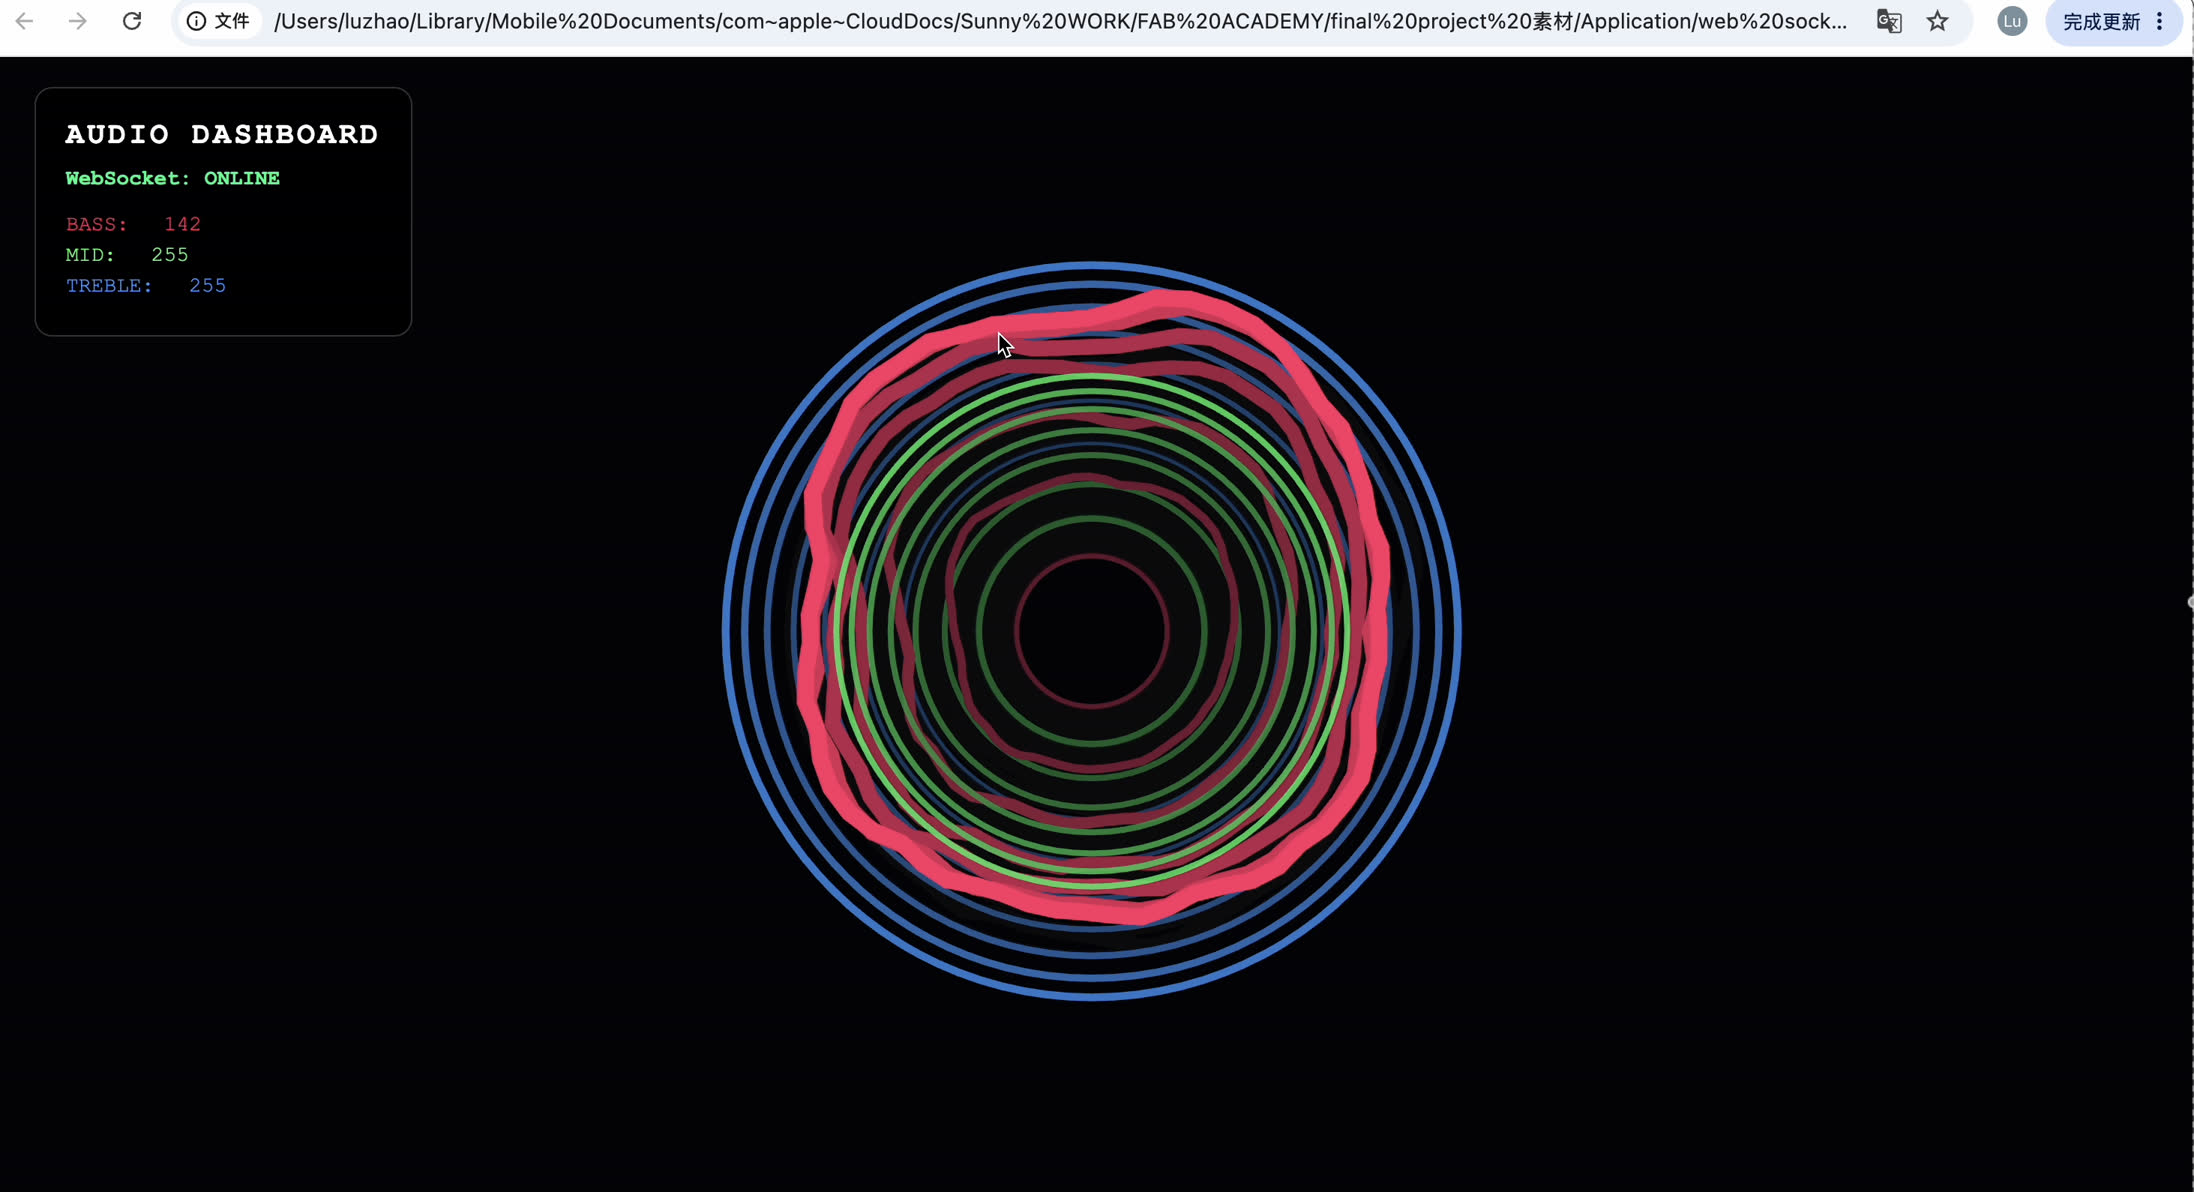
For the web client, I combined standard HTML/CSS with the p5.js library to build an "Audio Mandala".
-
The HUD Overlay: An HTML
<div>acts as a cyber-punk style Head-Up Display in the top-left corner. It parses the incoming WebSocket string and updates the exact Bass, Mid, and Treble numerical values dynamically. -
The p5.js Canvas: Instead of simple bar charts, I used generative art algorithms to visualize the sound. The high frequencies (Treble) drive a reactive outer blue ring, the vocal range (Mid) drives a breathing green ring, and the low frequencies (Bass) drive a pulsating red core.
-
Algorithmic Beauty: I utilized the
lerp()function to smooth out the incoming data, giving the visuals a natural damping effect. For the red bass core, I implementednoise()(Perlin Noise) on a circular path. This distorts the perfect circle into an organic, amoeba-like shape that physically reacts to the beats of the Morin Khuur, creating an incredibly immersive connection between the traditional instrument and the digital browser.
HTML & JS Receiver Code:
I used the ESP32 address above to fill in the line 36.
<!DOCTYPE html>
<html lang="en">
<head>
    <meta charset="UTF-8">
    <title>Morin Khuur Dashboard</title>
    <script src="https://cdnjs.cloudflare.com/ajax/libs/p5.js/1.6.0/p5.js"></script>
    <style>
        body { margin: 0; padding: 0; overflow: hidden; background-color: #08080A; font-family: 'Courier New', Courier, monospace; color: white;}
        #ui-layer { position: absolute; top: 20px; left: 30px; z-index: 10; background: rgba(0,0,0,0.6); padding: 20px; border-radius: 12px; border: 1px solid #333;}
        h1 { margin: 0 0 10px 0; font-size: 20px; letter-spacing: 2px; }
        .status { color: #00FF88; font-weight: bold; margin-bottom: 15px; font-size: 14px;}
        .data-row { margin: 5px 0; font-size: 14px;}
        span.val { display: inline-block; width: 40px; text-align: right; }
    </style>
</head>
<body>
    <div id="ui-layer">
        <h1>AUDIO DASHBOARD</h1>
        <div class="status" id="ws-status">Connecting to Instrument...</div>
        <div class="data-row" style="color: #FF3366;">BASS:   <span class="val" id="val-bass">0</span></div>
        <div class="data-row" style="color: #33FF66;">MID:    <span class="val" id="val-mid">0</span></div>
        <div class="data-row" style="color: #3399FF;">TREBLE: <span class="val" id="val-treb">0</span></div>
    </div>

    <script>
        let ws;
        let bass = 0, mid = 0, treble = 0;
        let sBass = 0, sMid = 0, sTreble = 0;

        function setup() {
            createCanvas(windowWidth, windowHeight);

            // =========================================================
            // REPLACE 192.168.X.X WITH YOUR ACTUAL ESP32 IP ADDRESS
            // =========================================================
            ws = new WebSocket("ws://192.168.170.12:81/");

            ws.onopen = function() {
                document.getElementById('ws-status').innerText = "WebSocket: ONLINE";
            };

            ws.onmessage = function(event) {
                let vals = event.data.split(',');
                if(vals.length === 3) {
                    bass = parseFloat(vals[0]);
                    mid = parseFloat(vals[1]);
                    treble = parseFloat(vals[2]);

                    // Update HTML DOM elements
                    document.getElementById('val-bass').innerText = Math.round(bass);
                    document.getElementById('val-mid').innerText = Math.round(mid);
                    document.getElementById('val-treb').innerText = Math.round(treble);
                }
            };
        }

        function draw() {
            // Motion blur effect background
            background(8, 8, 10, 40);

            // Linear interpolation (lerp) for buttery smooth visual transitions
            sBass = lerp(sBass, bass, 0.15);
            sMid = lerp(sMid, mid, 0.15);
            sTreble = lerp(sTreble, treble, 0.15);

            translate(width / 2, height / 2);
            noFill();

            // Treble (High Frequency): Blue reactive outer ring
            stroke(50, 150, 255, 200);
            strokeWeight(2 + sTreble / 50);
            let trebSize = 250 + sTreble * 1.5;
            ellipse(0, 0, trebSize);

            // Mid (Vocals/Strings): Green breathing middle ring
            stroke(50, 255, 100, 200);
            strokeWeight(4);
            let midSize = 150 + sMid * 1.2;
            ellipse(0, 0, midSize);

            // Bass (Low Frequency): Red organic pulsating core (using Perlin Noise)
            stroke(255, 50, 100, 255);
            strokeWeight(sBass / 15 + 3);
            beginShape();
            for (let i = 0; i < TWO_PI; i += 0.1) {
                let offset = noise(cos(i) + frameCount * 0.05, sin(i) + frameCount * 0.05) * sBass;
                let r = 50 + sBass * 0.8 + offset;
                vertex(cos(i) * r, sin(i) * r);
            }
            endShape(CLOSE);
        }

        // Auto-resize canvas when window changes
        function windowResized() {
            resizeCanvas(windowWidth, windowHeight);
        }
    </script>
</body>
</html>
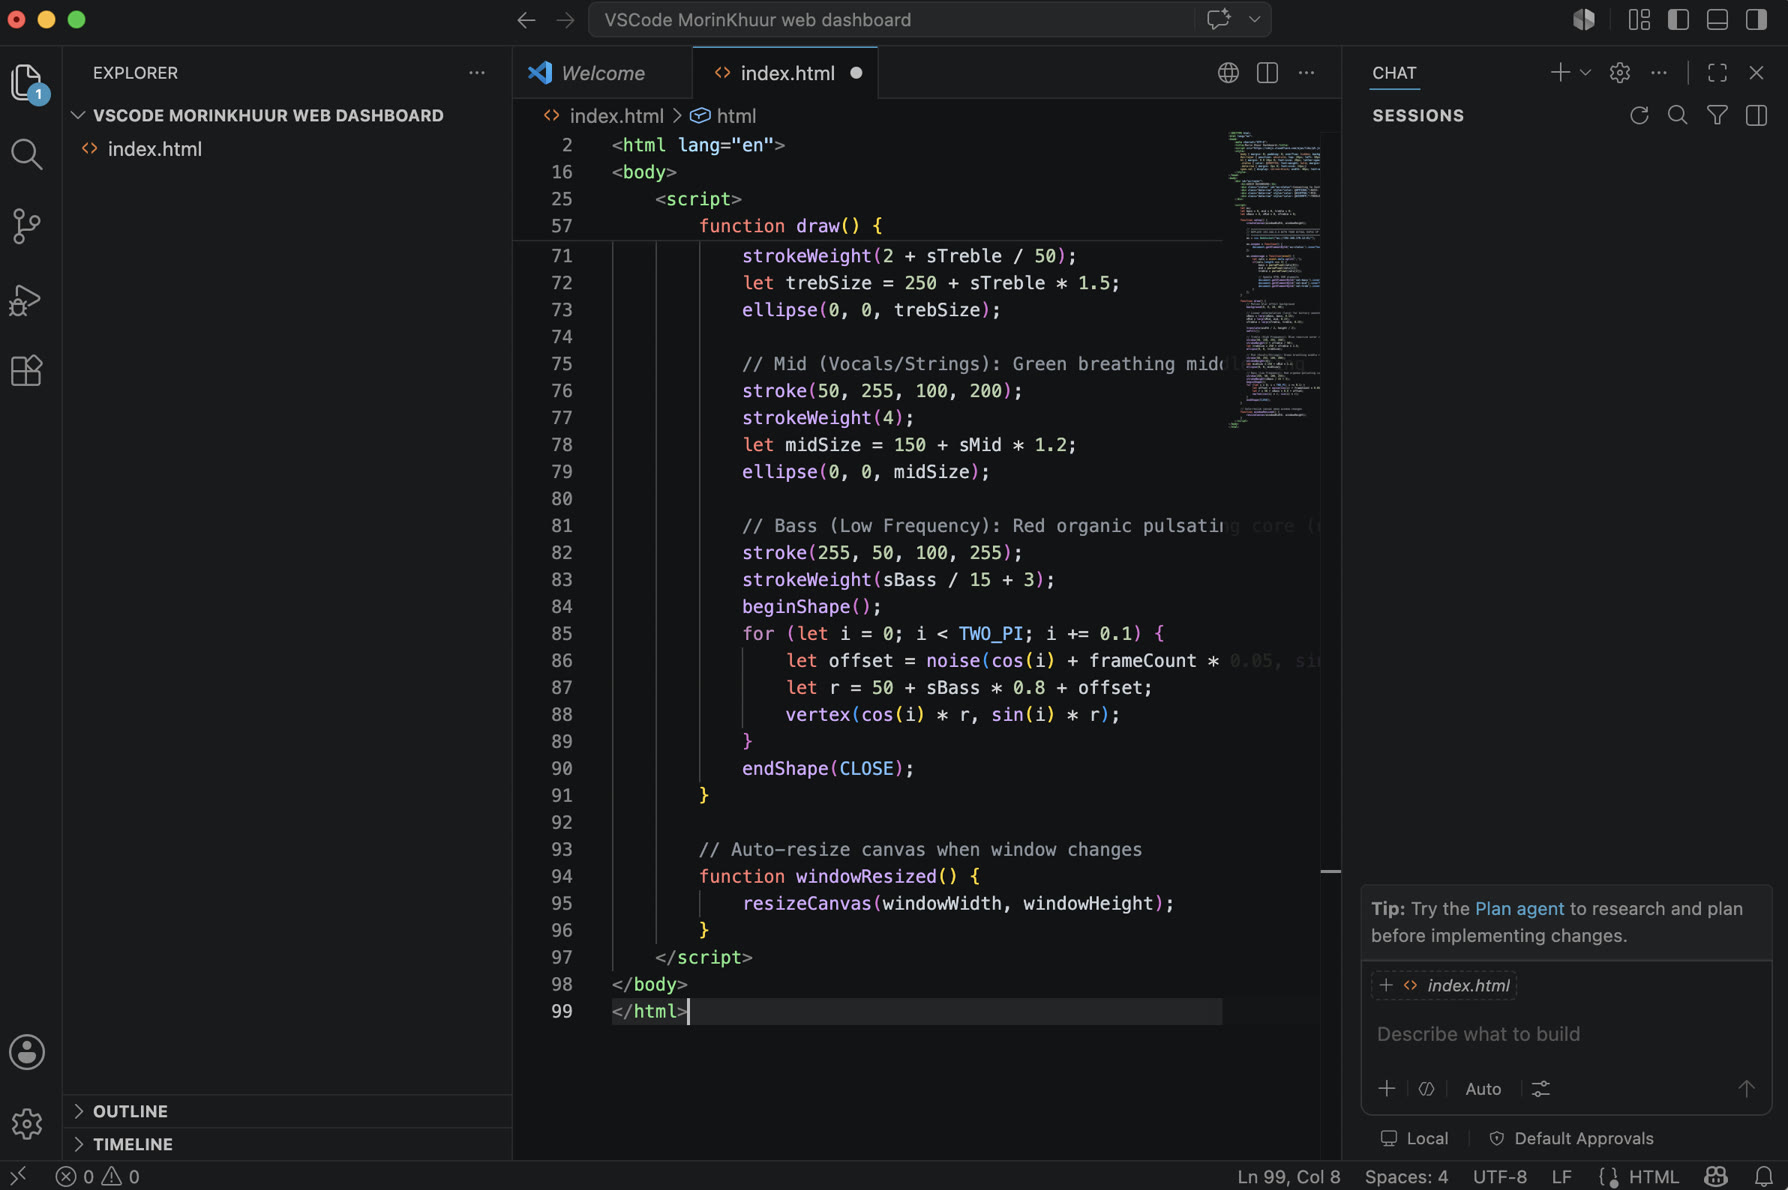
After writing the code, the deployment process was straightforward: since standard web browsers natively support WebSockets and HTML5 Canvas, I simply opened the index.html file locally in Google Chrome. As long as my computer and the ESP32C3 were connected to the same local Wi-Fi hotspot, the browser successfully established the WebSocket handshake using the ESP32's assigned local IP address (e.g., ws://192.168.170.12:81/)
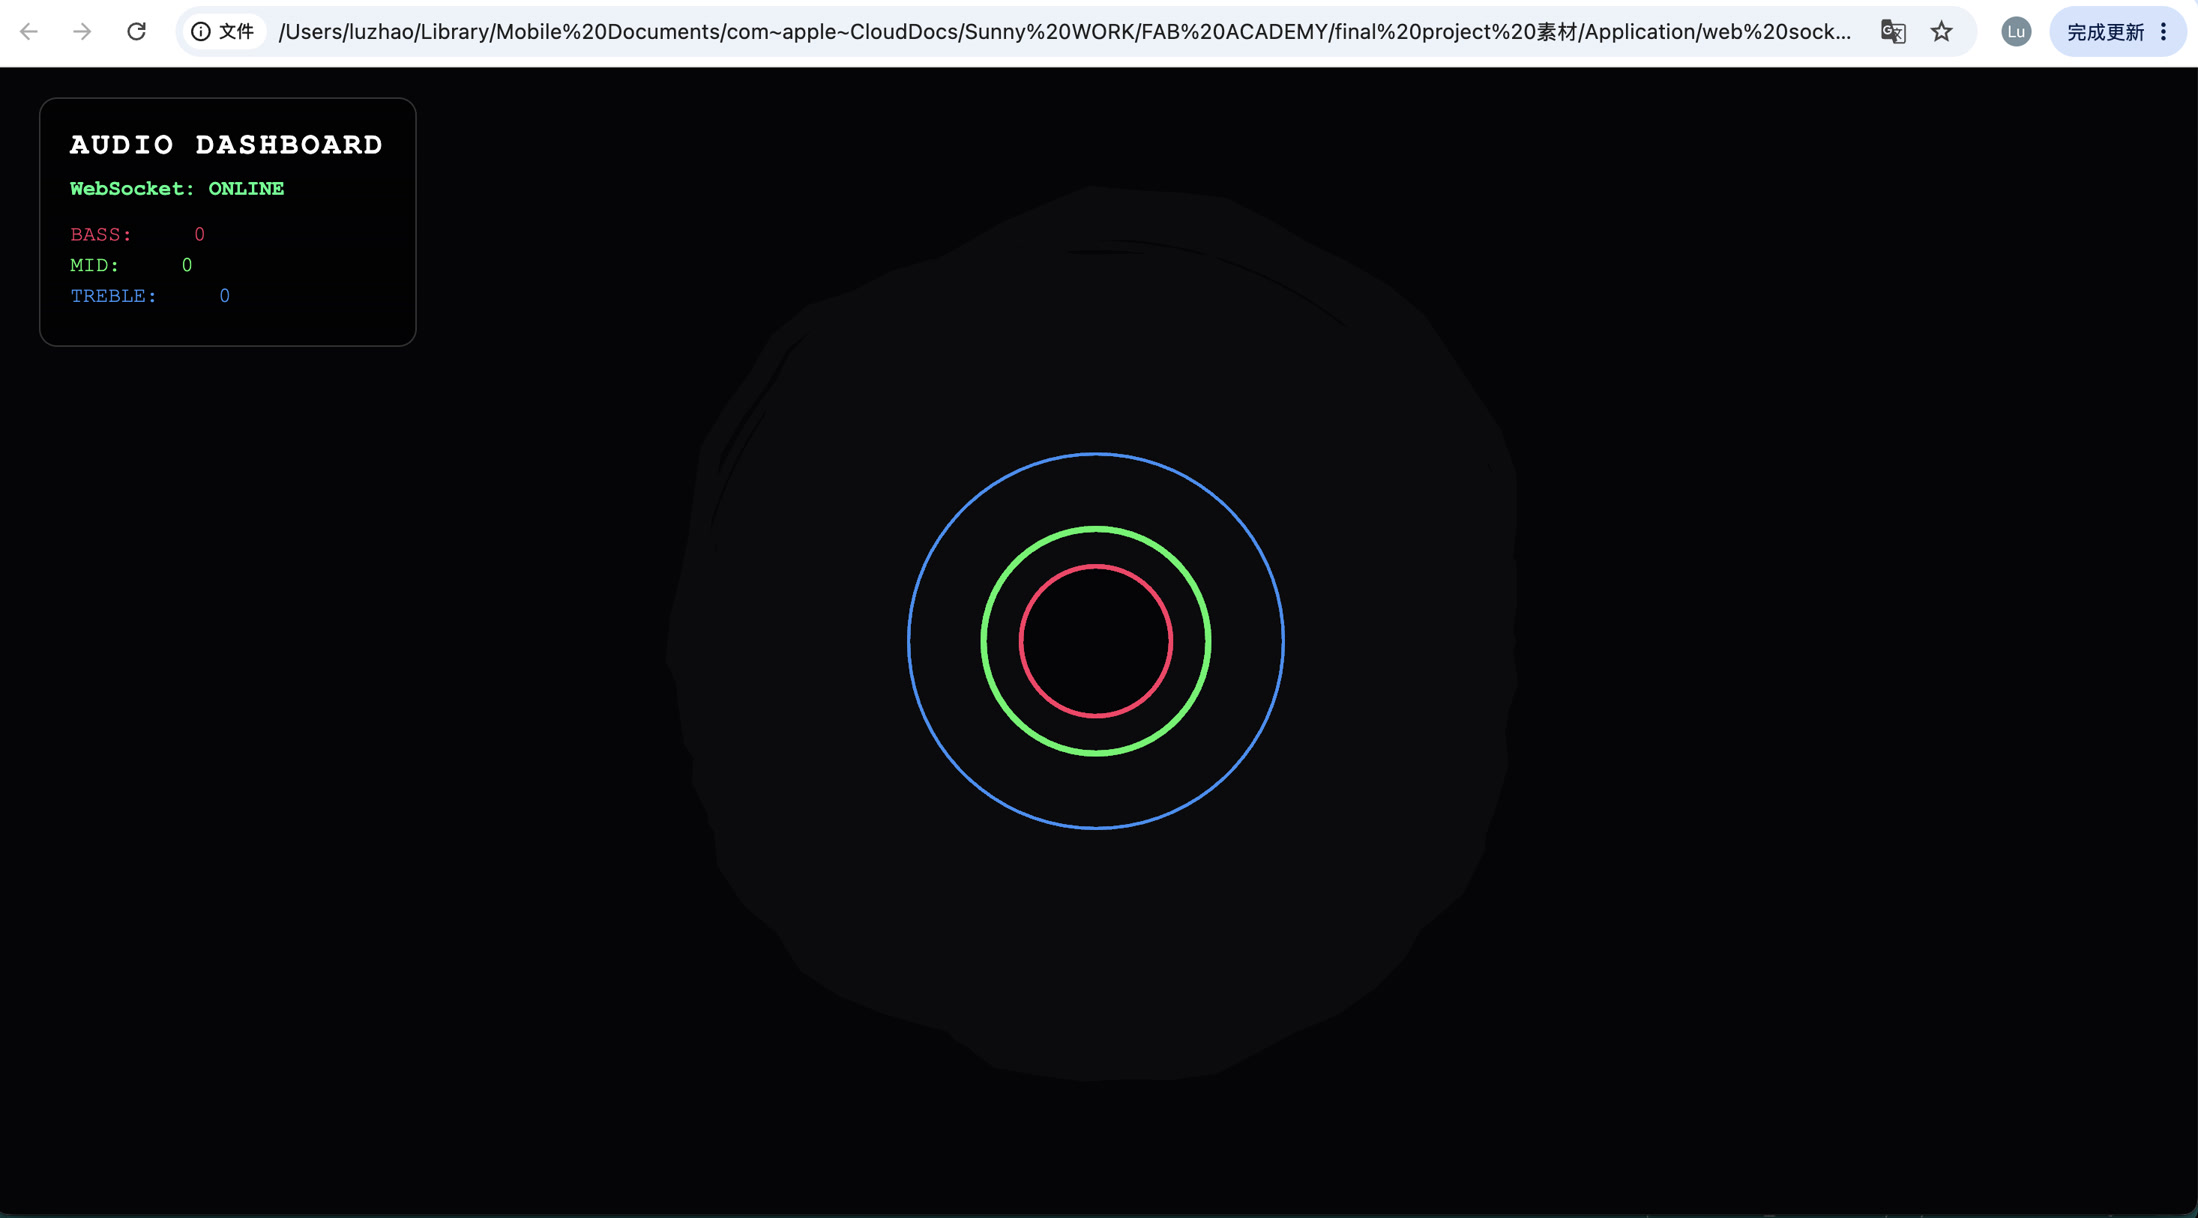
The demonstration video below showcases the real-time web-based audio visualizer in action. Its core principle relies on the ESP32C3 pushing FFT frequency data to the browser via the WebSocket protocol at an ultra-high frame rate of 50 FPS, while the frontend utilizes p5.js and Perlin Noise algorithms to smoothly render this data into a zero-latency generative art animation.
Change the Audio Clipping & Dynamic Range
During testing with full studio music, I noticed the mid (green) and treble (blue) rings remained statically expanded due to data clipping. Complex music tracks contain much denser high-frequency energy than a solo Morin Khuur, causing the original mapped values to constantly max out at the 255 limit. To resolve this, I significantly increased the dynamic range (mapping ceilings) in the Arduino code—for example, raising the mid-range limit from 30,000 to 80,000. This prevented the data from peaking and successfully restored the fluid, dynamic reactivity of the web visualizer.
Revised Arduino Code:
#include <Adafruit_NeoPixel.h>
#include <driver/i2s.h>
#include "arduinoFFT.h"
#include <WiFi.h>
#include <WebSocketsServer.h>

// ================= 1. Network Configuration =================
// Replace with your actual Wi-Fi hotspot credentials
const char* ssid = "Xiaomi 12S Ultra";
const char* password = "13572468";

// Start WebSocket server on port 81
WebSocketsServer webSocket = WebSocketsServer(81);

unsigned long lastSendTime = 0;
// Set transmission interval to 20ms (~50 FPS) for buttery smooth visuals
const int sendInterval = 20;

// ================= 2. Hardware & FFT Configuration =================
#define LED_PIN     9
#define NUMPIXELS   160
Adafruit_NeoPixel strip(NUMPIXELS, LED_PIN, NEO_GRB + NEO_KHZ800);

#define I2S_PORT    I2S_NUM_0
#define I2S_SCK     D0
#define I2S_WS      D1
#define I2S_SD      D2

const uint16_t samples = 256;
const double samplingFrequency = 16000;
double vReal[samples];
double vImag[samples];
ArduinoFFT<double> FFT = ArduinoFFT<double>(vReal, vImag, samples, samplingFrequency);

void setup() {
  Serial.begin(115200);

  // Initialize Wi-Fi Connection
  Serial.print("Connecting to Wi-Fi...");
  WiFi.begin(ssid, password);
  while (WiFi.status() != WL_CONNECTED) {
    delay(500);
    Serial.print(".");
  }
  Serial.println("\nWiFi Connected!");

  // CRITICAL: Print the ESP32 IP address. You need this for the HTML file!
  Serial.print("ESP32 IP Address: ");
  Serial.println(WiFi.localIP());

  // Initialize WebSocket Server
  webSocket.begin();

  // Initialize NeoPixel LED Strip
  strip.begin();
  strip.setBrightness(20);
  strip.clear();
  strip.show();

  // Configure I2S Microphone
  i2s_config_t i2s_config = {
    .mode = (i2s_mode_t)(I2S_MODE_MASTER | I2S_MODE_RX),
    .sample_rate = samplingFrequency,
    .bits_per_sample = I2S_BITS_PER_SAMPLE_32BIT,
    .channel_format = I2S_CHANNEL_FMT_ONLY_LEFT,
    .communication_format = I2S_COMM_FORMAT_STAND_I2S,
    .intr_alloc_flags = ESP_INTR_FLAG_LEVEL1,
    .dma_buf_count = 8,
    .dma_buf_len = 64,
    .use_apll = false
  };
  i2s_pin_config_t pin_config = {
    .bck_io_num = I2S_SCK,
    .ws_io_num = I2S_WS,
    .data_out_num = I2S_PIN_NO_CHANGE,
    .data_in_num = I2S_SD
  };
  i2s_driver_install(I2S_PORT, &i2s_config, 0, NULL);
  i2s_set_pin(I2S_PORT, &pin_config);
}

void loop() {
  // Keep WebSocket connection alive
  webSocket.loop();

  // 1. Capture Audio Data
  size_t bytesIn = 0;
  int32_t sampleBuffer[samples];
  i2s_read(I2S_PORT, &sampleBuffer, sizeof(sampleBuffer), &bytesIn, portMAX_DELAY);

  int samplesRead = bytesIn / sizeof(int32_t);
  double totalVolume = 0;

  // 2. Data Cleaning
  for (int i = 0; i < samplesRead; i++) {
    int16_t audioValue = sampleBuffer[i] >> 14;
    vReal[i] = audioValue;
    vImag[i] = 0.0;
    totalVolume += abs(audioValue);
  }

  int averageVolume = totalVolume / samplesRead;

  // 3. Execute Fast Fourier Transform (FFT)
  FFT.windowing(FFT_WIN_TYP_HAMMING, FFT_FORWARD);
  FFT.compute(FFT_FORWARD);
  FFT.complexToMagnitude();

  // 4. Analyze Frequency Band Energy
  long bassEnergy = 0, midEnergy = 0, trebleEnergy = 0;
  for (int i = 2; i < (samplesRead / 2); i++) {
    if (i < 10) bassEnergy += vReal[i];
    else if (i < 40) midEnergy += vReal[i];
    else trebleEnergy += vReal[i];
  }

  int r = 0, g = 0, b = 0;
  strip.clear();

  // 5. Map Data to the LED Strip (Using tuned HDR parameters)
  if (averageVolume > 400) {
    int ledsToLight = map(averageVolume, 400, 8000, 1, NUMPIXELS / 2);
    if (ledsToLight > NUMPIXELS / 2) ledsToLight = NUMPIXELS / 2;

    r = map(bassEnergy, 0, 60000, 0, 255);
    g = map(midEnergy, 0, 80000, 0, 255);
    b = map(trebleEnergy, 0, 60000, 0, 255);

    r = constrain(r, 0, 255);
    g = constrain(g, 0, 255);
    b = constrain(b, 0, 255);

    int center = NUMPIXELS / 2;
    for (int i = 0; i < ledsToLight; i++) {
      strip.setPixelColor(center + i, strip.Color(r, g, b));
      strip.setPixelColor(center - 1 - i, strip.Color(r, g, b));
    }
  }
  strip.show();

  // 6. Broadcast Data via WebSocket
  unsigned long currentTime = millis();
  if (currentTime - lastSendTime >= sendInterval) {
    lastSendTime = currentTime;

    // Construct data packet: "R,G,B"
    String dataString = String(r) + "," + String(g) + "," + String(b);

    // Broadcast text to all connected HTML clients
    webSocket.broadcastTXT(dataString);
  }
}
Finally, I played a piece of music by Morin Khuur and got the more dynamic visual effect corresponding to the music and the LED strip shining together in real time!
Summary
To sum up this week, creating the visual interface was the final puzzle piece that truly brought the new digital Morin Khuur (horse-head fiddle) to life. This assignment pushed me out of my hardware comfort zone and forced me to think like a full-stack system architect.
I successfully navigated the entire evolution of an application: starting from raw FFT data verification in the Arduino IDE, building a lightning-fast UDP prototype in Processing to prove the wireless concept, and ultimately coding a modern, WebSocket-driven Web Dashboard in VS Code.
Rather than getting completely bogged down by frontend syntax, treating an AI like Gemini as a conversational pair-programmer allowed me to focus purely on data mapping and visual design. Fixing the data clipping issues and seeing the physical bowing of the strings instantly translated into a breathing, generative digital visualizer on my screen was incredibly rewarding. It proved that the entire hardware-to-software loop works perfectly.