Week 06 - Group assignment
We tested 3 different equipments to test electric circuits. We did our tests on a demo PCB of our instructor. It provides the following features, which we will use for our tests:
- RGB leds
- a PWM output
Multimeter
It allows us to measure:
- voltage (alternative or continuous) in Volts
- resistance in Ohms
- currents in Amps
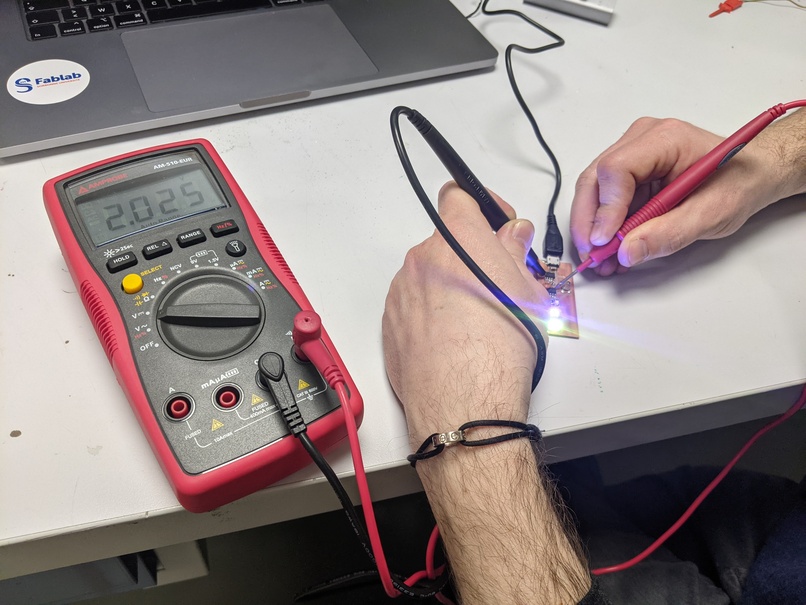
It is not so easy to measure currents, because you have to do electric connections in series. It is easier to measure voltages, as you can do it in parallel. Simply plug the black multimeter probe to the COM port and the red to the V port, then make a contact with the black probe to the circuit ground, and with the red probe to the track you want to measure the voltage of.
It is convenient to:
- check that you have the expected voltage
- check continuity
- read the PWM mean amplitude
Oscilloscope
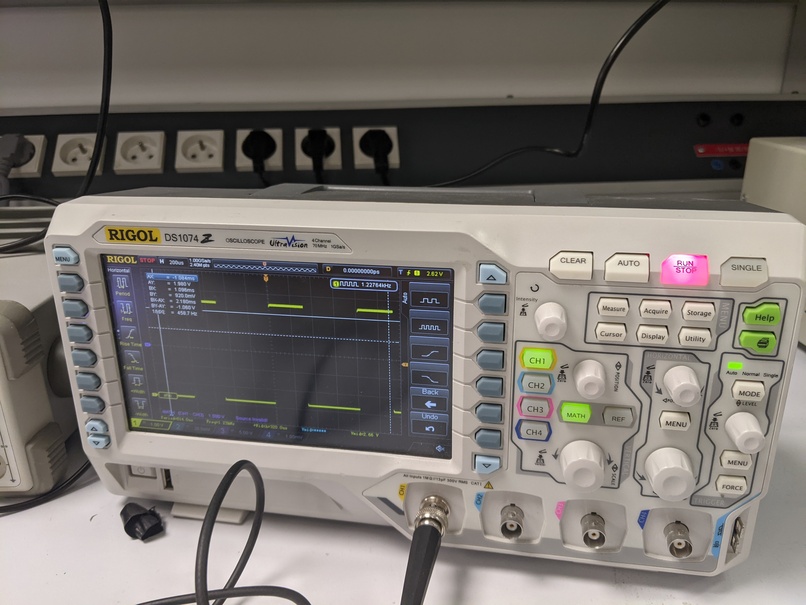
This equipment is mainly used to analyze analogic signals. In our case (digital electronics) it can be convenient to: * measure the voltage evolution in time * detect signals parasites and transmission problems
To test it we placed the probe at the PWM output line, and could observe the voltage variations between the high state and the low state. The overall signal frequency doesn't change but we can clearly observe the ratio between high state and low state.
Logic analyzer
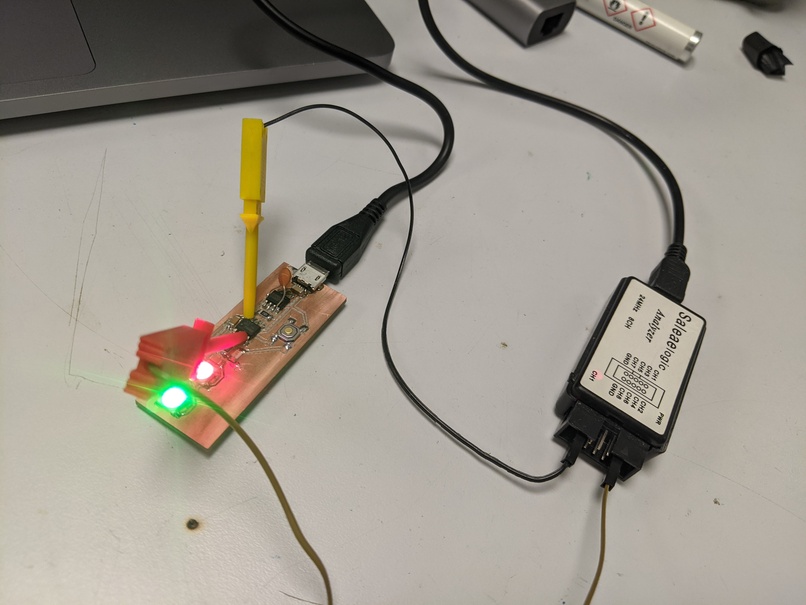
This small device allows us to retrieve the binary signals that pass through the electronic circuit (digital one!). If you want to observe various signals at the same time, you can check the schematic on the sticker glued to the logic analyzer.
To use it, you have to plug it with USB to a computer, then open a software such as PulseView. Then plug one small clamp to the ground pin and grab the ground somewhere on your circuit. Then plug another clamp to another pin and grab the leg / route where you want to retrieve the binary signal.
Then in the software on your computer you can set the sampling frequency and the number of samples. As stated by the Shannon theorem, if you know your signal frequency, double it to know the sample frequency to observe it. Indeed, the software cannot interprate the signal if it doesn't have enough samples at a sufficient frequency.
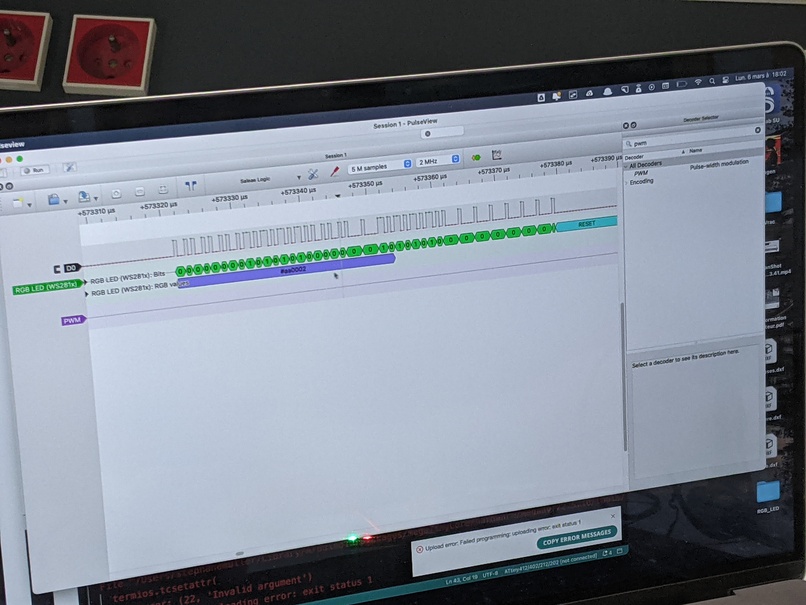
For a given channel, you also have to pick what kind of signal you expect. In our case, we thus chose to observe a WS2812B data signal and a PWM signal.
Finally, click on run and observe your signals. You might need to zoom a lot to see something happenning!
The software was able to decipher:
- The PWM voltage ratio
- the color of the RGB led in hexadecimal!