dummy
15.INTERFACE AND APPLICATION PROGRAMMING
I have always been curious about this subject because it plays a vital role in conveying the outcomes of our programming to others through a visual interface. However, since programming is entirely new to me, I find it to be a challenging subject.
As we approach the conclusion of the course, I am trying to make progress on the Final Project each week. For this week, I have accomplished the following:
- Sub-Boards Soldering, see Final Project.
- Testing the Sub-Boards with the Blink Code, see Final Project.
- 3D Printing of the “Bevel Gears”, see Final Project.
- Making the Module “A” Probe of concept and control it a potentiometer, see Final Project.
- Programing the Sensor light to get data range, w12.Input devices.
HERO IMAGE
ASSIGNMENTS
Gropup Assignment
- Compare as many tool options as possible
Individual Assignment
- Write an application that interfaces a user with an input and/or output device that I made.
GROUP ASSIGNMENT
For the group assignment, we explored simple and user-friendly ways to create GUIs. We tested two options: MIT App Inventor and a combination of HTML, CSS, and JavaScript.
MIT App Inventor is an online software that enables a broad audience to create basic codes and develop apps for tablets and smartphones. This is a significant advantage; however, it is challenging to integrate it with a board to read and interpret input data. This makes it a bit restrictive for certain applications.
While HTML, CSS, and JavaScript are the three core technologies used for building websites, including creating their graphical user interfaces (GUIs). HTML is used to create the structure of web pages, CSS is used to style the layout and appearance of the pages, and JavaScript is used to add interactivity to the pages. Because web pages are accessed through a web browser, GUIs created with these technologies can be shared on the web.
You can see HERE more about the group assignment.
INDIVIDUAL ASSIGNMENT
For this week's assignment, I utilized the XIAO RP2040 Board that I worked with in Week 8 of Electronics Production. I connected the Light Sensor Board from my final project to the XIAO RP2040 Board.
To do the GUI (Graphical user interface) I used “PROCESSING” which is an open-source IDE (integrated development environment) software used to make interactive interfaces. Additionally, I utilized “Python” language, with “THONNY”, this IDE software is an "Entry" level for people starting to program.
1. Arduino Processing
To create an interface for the data from the light sensor using Arduino, I realized I was being too ambitious. Firstly, it was necessary to run an Arduino code to determine the range of the sensor data and upload it to the microcontroller. After that, it was important to close the Arduino as the COM port needed to be free for "Processing" to connect and run its program.
This is the Arduino Code:
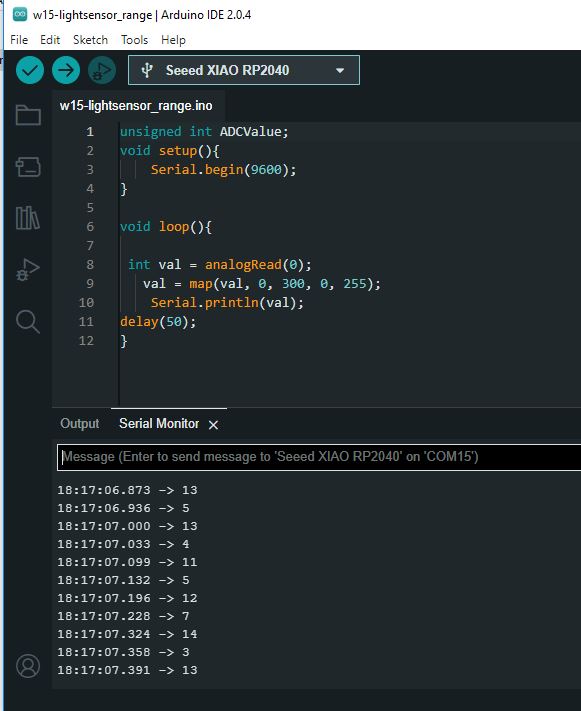
I found a code in this ARDUINO TUTORIAL, an example of what I wanted to show with my GUI. I utilized the “Interactive ellipse” to convey the information from the Light sensor.
The circle size and color change based on the amount of light detected. When there is more light, the circle becomes smaller and redder, and when there is less light, the circle becomes bigger and yellower.
This is the Processing Code:
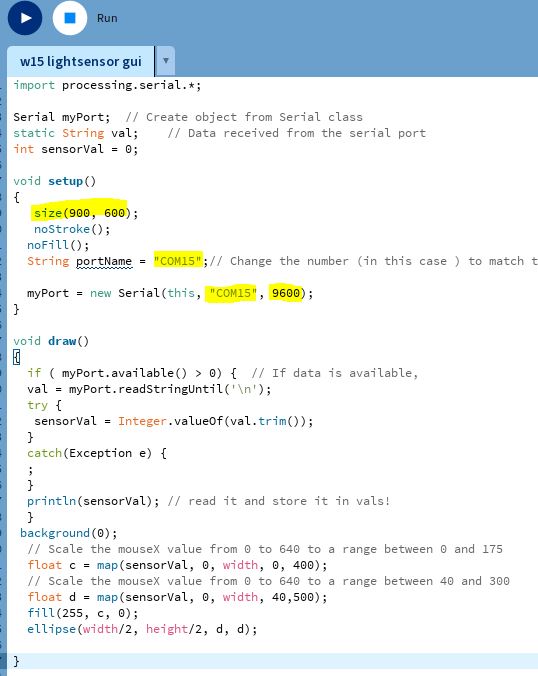
Admittedly, I only have a clear understanding of these parts:
- It is important to match the Baud rate the same for the Arduino and Processing programs
- Both programs should have too the same COM Port
- The size of the window is in the void setup.
This is the GUI working:
2. Arduino with Thonny (Python)
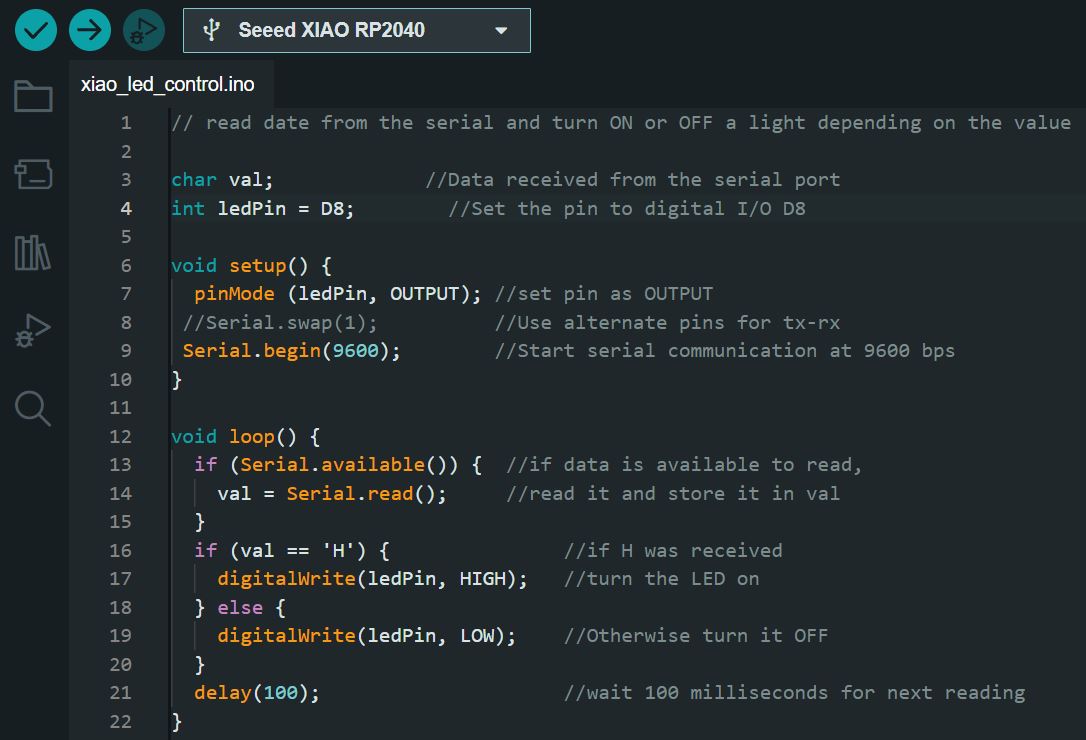
To better understand the process of creating a GUI, I followed another tutorial by Steven, this time using Arduino with “Python” language written in “Thonny”, the tutorial had a “simpler” code. The code's objective was to turn the Board integrated LED light ON or OFF through the computer.
This is the Arduino Code:
This is the Thonny Code:
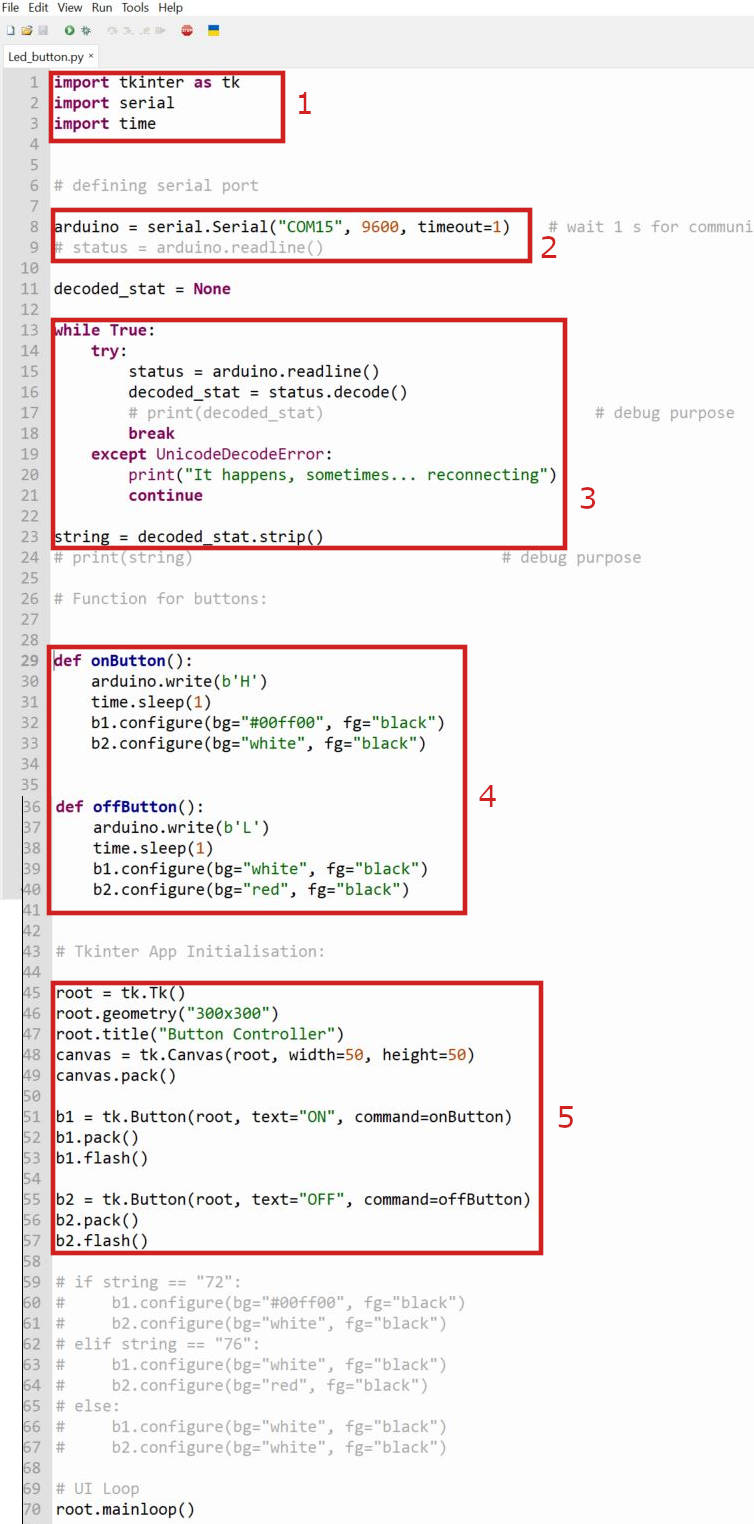
As Programming/Coding is a new subject for me, I took some notes of what Steven explain while coding it, and I have used CHAT GPT to explain line per line the code, and make sure I understand it, at least the general concept.
- The first three lines of the code import the necessary libraries: "tkinter" for the GUI, "serial" for communication with the external device, and "time" for managing timing in the program.
- This line creates a “serial” object called “Arduino” and establishes a serial connection with a device connected to the “COM15” port with a baud rate of “9600” and a timeout of 1 second. This allows the program to send and receive data to and from the device over the serial connection. in this case, my Baud rate is 9600, it doesn’t need to be a fast connection, and the Port is COM15 for both programs.
- After connecting to the device, the code enters a while loop that reads the status of the device over the serial connection. The loop will continue until it receives a properly decoded status message from the device.
- These lines define two functions called “onButton()” and “offButton()”. The onButton() function sends a signal to turn the device on, while the “offButton()” function sends a signal to turn the device off. Each function also changes the background color of the buttons in the GUI to reflect the current state of the device.
- “root = tk.Tk()” This line initializes the GUI with the “Tkinter” library and creates a “Tk()” object called “root”, which represents the main window of the GUI.
“canvas = tk.Canvas(root, width=50, height=50)” This line creates a canvas widget inside the main window with a width and height of 50 pixels.
“b1 and b2” lines create two buttons and associate them with the “onButton()” and “offButton()” functions, respectively. The buttons are also added to the canvas.
“flash()” code is for buttons to indicate to the user when the program starts that they can be clicked.
3. Learning Outcome
Learning programming has been challenging for me in this course. However, I have found that searching for information online can be helpful. There are many tutorials and articles available to guide me through programming concepts.
It is a great advantage that most programming tools and resources are free and easily accessible with a computer and an internet connection.
In addition to programming, it is crucial to be able to interpret and communicate data effectively. Through the use of PCBs, we can gather data and show it with GUI in a way that is more graphic and understandable. This makes it easier to share information with others. By utilizing PCBs and other data visualization tools, we can better understand and analyze the data we collect.