dummy
12.INPUT DEVICES
This week, we have the opportunity to work with input devices using a printed circuit board (PCB) that we have produced. To accomplish this, I am utilizing my PCB alongside the XIAO RP2040 microcontroller (you can refer to week 8 for more information) to measure a device input.
Furthermore, I have decided to begin designing, milling, and assembling one of the PCB modules required for my final project. If time permits, I will also measure an input device using this module, see more in the Final Proyect link.
HERO IMAGE
ASSIGNMENTS
Gropup Assignment
- Probe an input device(s)'s analog and digital signals.
- Document my work on the group work page and reflect on my page what I learned.
Individual Assignment
- Measure something: add a sensor to a microcontroller board that you have designed and read it.
GROUP ASSIGNMENT
For our group assignment, we obtained measurements from a motion sensor, a step response sensor, and a temperature sensor.
You can see HERE more about the group assignment, where we see in detail the different experiments.
To begin with, it is crucial to clarify the distinction between Input devices and Output devices, as I was initially unclear about it. This page provides a comprehensive explanation of the two concepts that helped me gain a deeper understanding, HERE.
-INPUT DEVICES
These components receive and process incoming data and instructions. These devices translate the data into a binary code format composed of electrical signals that can be interpreted by the digital computer. They feed data that later we can measure or analyze.
-OUTPUT DEVICESS
Output devices transform digitized signals into a format that can be easily comprehended by the user. In other words, these devices serve as the opposite of input devices in the sense that they present the processed data in a readable format to the user meaning they present data from the computer or Microcontroller in our case.
-SENSORS
Sensors are Input devices that detect and react to a specific type of input from the physical environment, such as light, heat, motion, moisture, pressure, or other environmental phenomena. We can measure the output signals and this was our week's experiment.
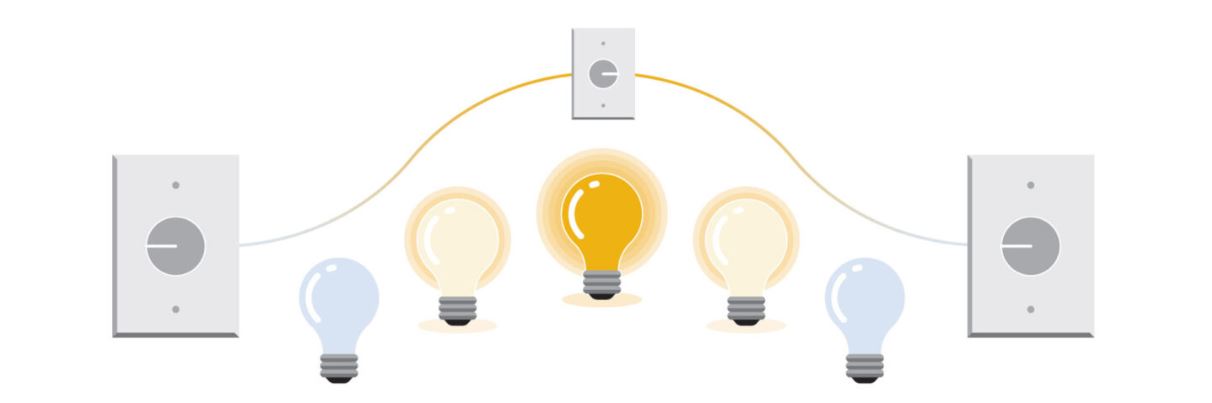
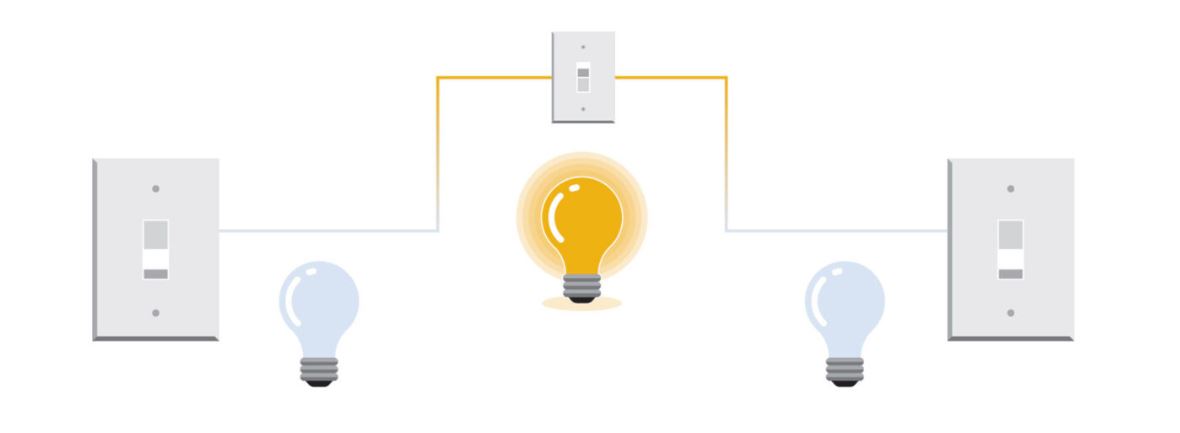
There are two types of sensors, Analog and Digital. An analog signal is continuous where the data varies depending on the time of measurement. While the Digital signal is comprised of two values Low and High. I came across an infographic that effectively illustrates the distinction between an Analog and Digital signal . Click Here for more information.
Analog, you can see there is a continuation of information or signal given, the light bulb is transitioning between being OFF to completely ON and then transitioning to be OFF again.
Digital, the signal is LOW, light OFF, HIGH Light ON, it is logic-level information.
INDIVIDUAL ASSIGNMENT
After learning about how to measure an RCWL-0516 Microwave Doppler Radar Motion sensor, I wanted to replicate the exercise using my XIAO RP2040 PCB board that I designed in WEEK 6. ELECTRONICS PRODUCTION. I began by experimenting with the sensor input only and later incorporated the board light as an output to turn ON when movement was detected.
1. Motion Sensor With XIAO RP2040
Connecting the components was relatively simple since I had left all the microcontroller pins exposed in the PCB design, and there was a 5V power outlet readily available. I connected the ground, the 5V, and a signal pin (in this case, D10). The code I used to detect motion was:
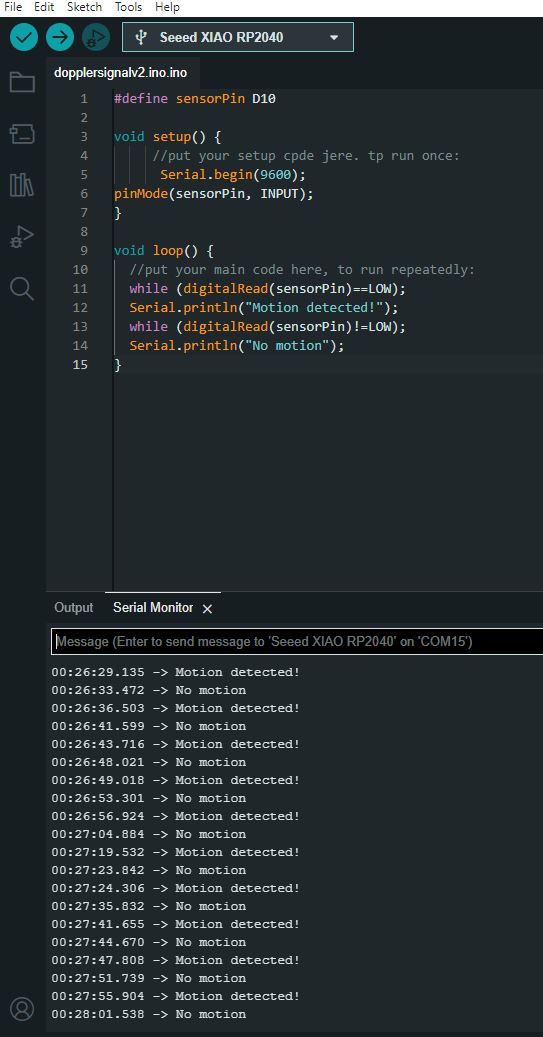
When movement is detected, the serial terminal displays the message "Motion detected". Conversely, when there is no movement, the message printed is "No motion".
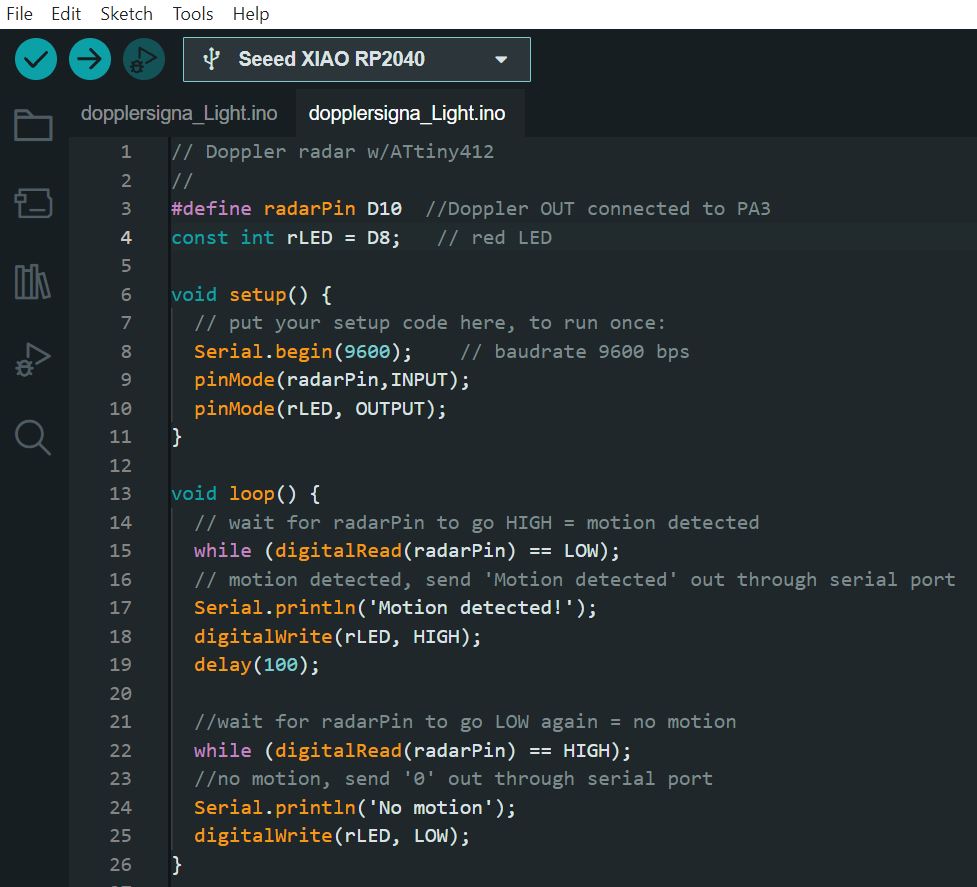
2. Motion Sensor and PCB Light
I added some additional code to the existing sensor program to activate the red LED light on the PCB when movement is detected. After one second, the light turns off indicating that no movement has been detected.
We can see that the light turns off even before the hand that activates the movement appears on the screen as the sensor is highly sensitive.
3. Measuring the Motion Sensor Signals
After uploading the code to the microcontroller, we were able to measure the signals of the sensor. I connected the PCB to a 5V battery and kept the connections to the sensor the same. However, this time, I connected an oscilloscope to the signal pin (D10) and to ground on the PCB using a probe set, to see the signals.
We observed waves on the oscilloscope screen that corresponded to the sensor's output. The waves appeared as either HIGH (indicating movement detected) or LOW (indicating no movement detected). These waves were similar to the example shown in the infographic of light bulbs being either ON or OFF, as this device is a Digital Sensor.
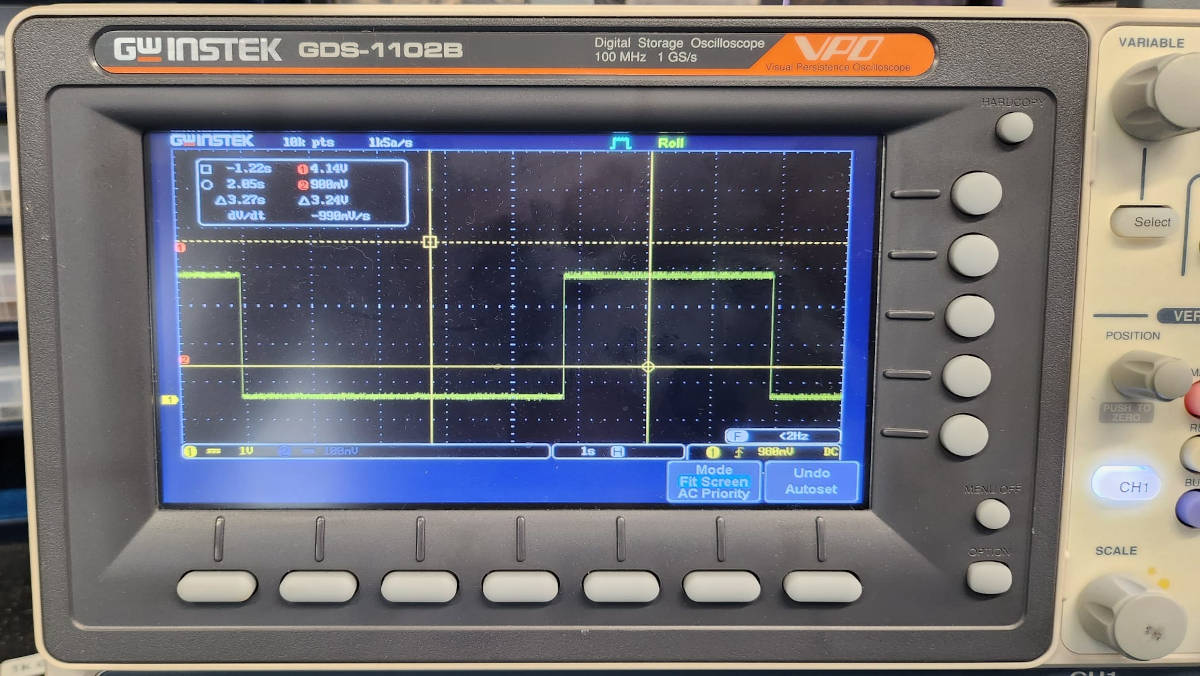
We can observe that the height and duration of the signal is constant, the sensor is Height for 2 seconds once it detects motion, for the Low signal the time is variable.
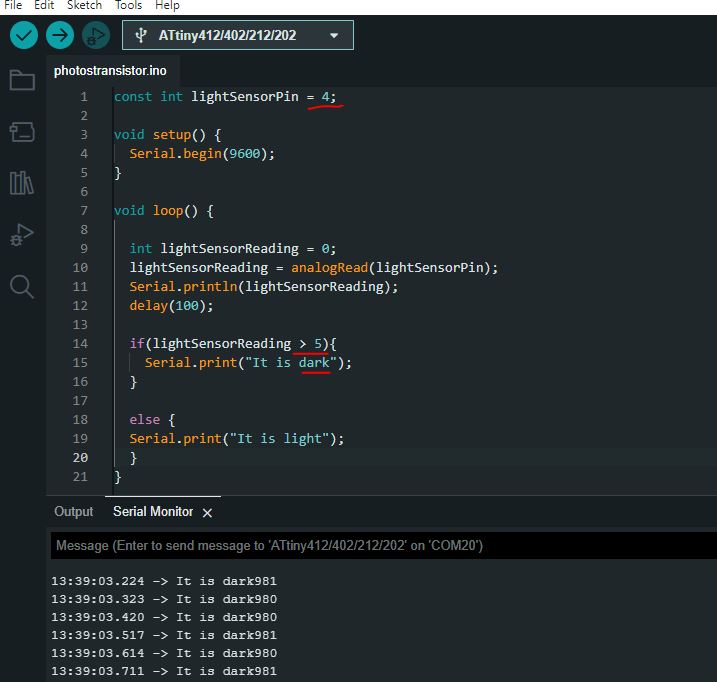
4. Light Sensor Checking
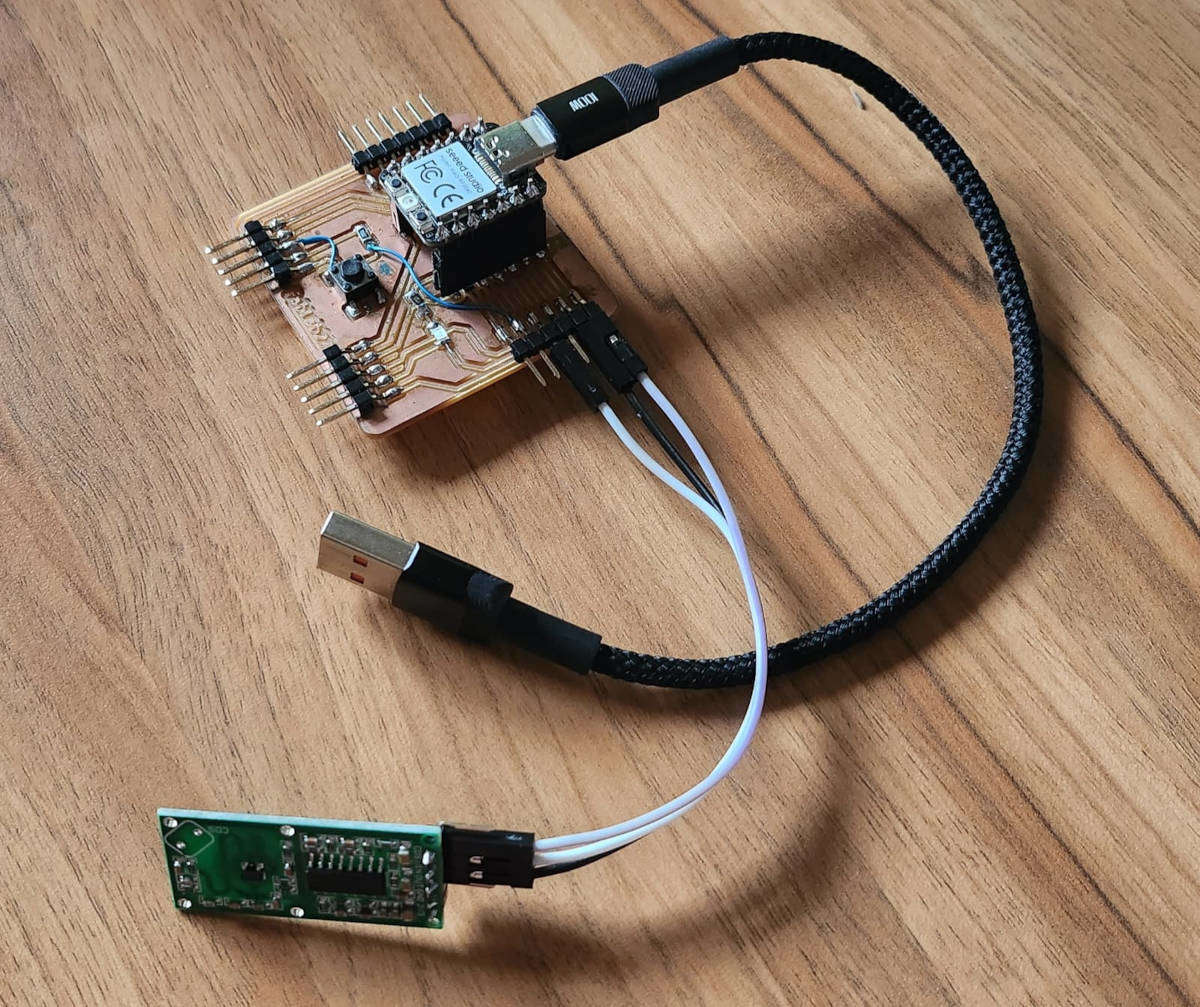
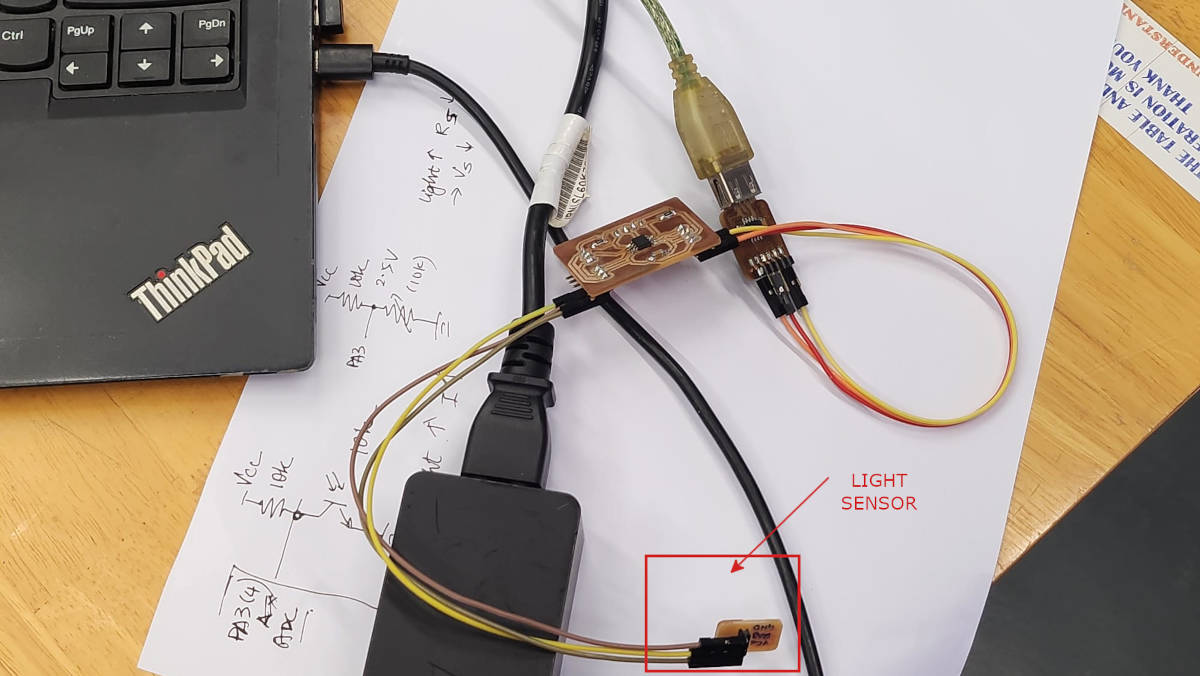
Once the board for the light sensor was completed, I began testing it to ensure it was functioning properly and could receive signals from the light sensor.
To do this, I utilized the Main board from my final project, which features an ATtiny 412 Microcontroller. During the design process, I had left pins available for the light sensor connections, which simply require a Ground, VCC, and Signal connection.
I proceeded to upload the code to the board, which allowed me to read signals from the sensor. Specifically, I utilized Pin connection 4 (PA3) to establish a connection with the sensor.
To determine whether the sensor was detecting light or darkness, I wrote in the code that any readings greater than 5V would indicate a "dark" state, while readings less than 5V would indicate a "light" state.
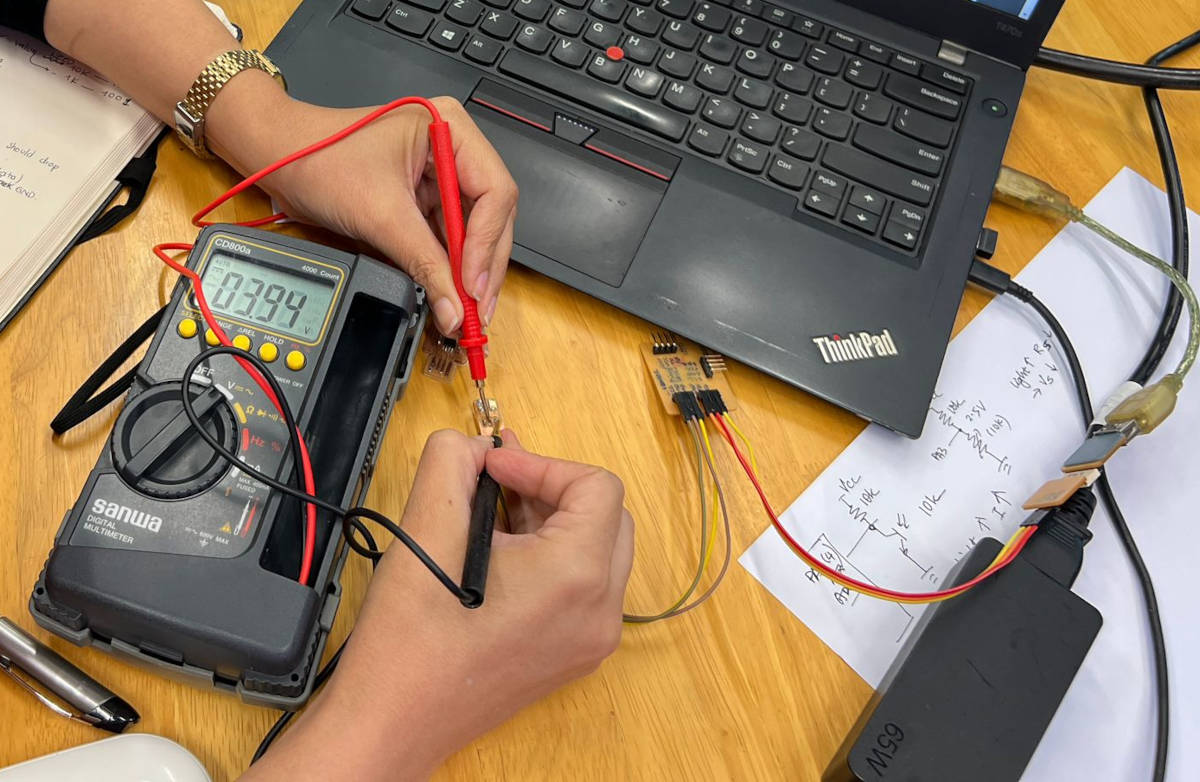
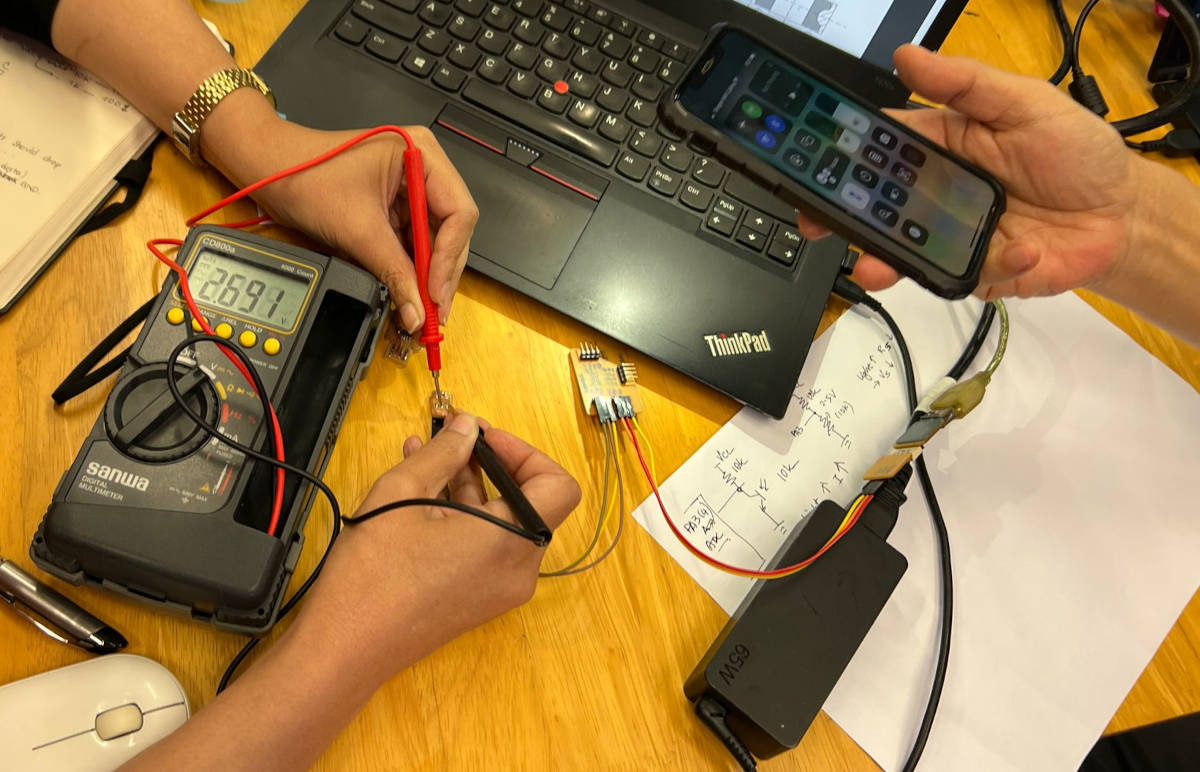
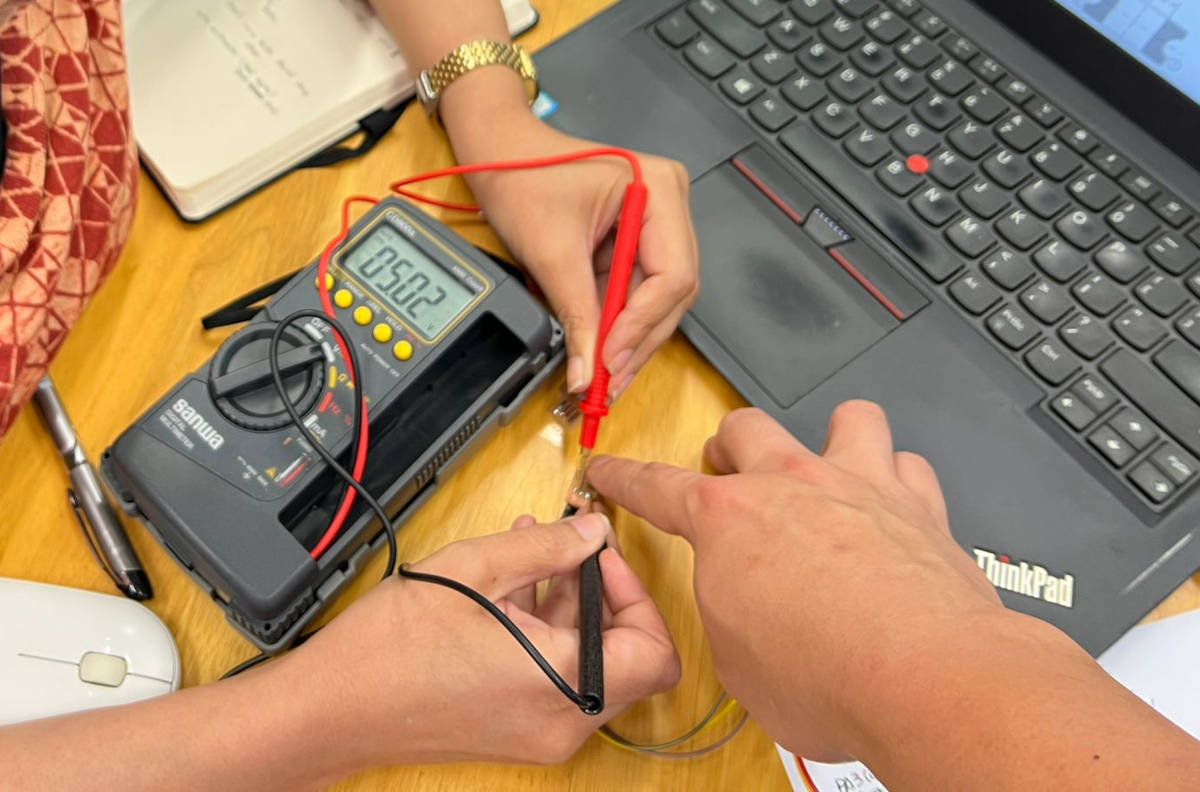
I established the threshold of 5V based on multimeter readings. When there was ambient light around the sensor, the multimeter reading was approximately 3.9V. When we directed a mobile phone light at the sensor, the reading dropped to 2.6V. Finally, when the environment was completely dark, the reading rose to 5.2V. Based on these readings, I determined that any values above 5V would be classified as "dark" readings, while values below 5V would be classified as "light" readings.
|
|
I was unable to obtain readings from the light sensor even when it was exposed to full light. However, I could verify that the board was functioning and receiving signals correctly through the sensor check. It appears that further work is required in the coding to obtain the expected values, specially as I will be using this light sensor in my final project.
5. Updating the Code
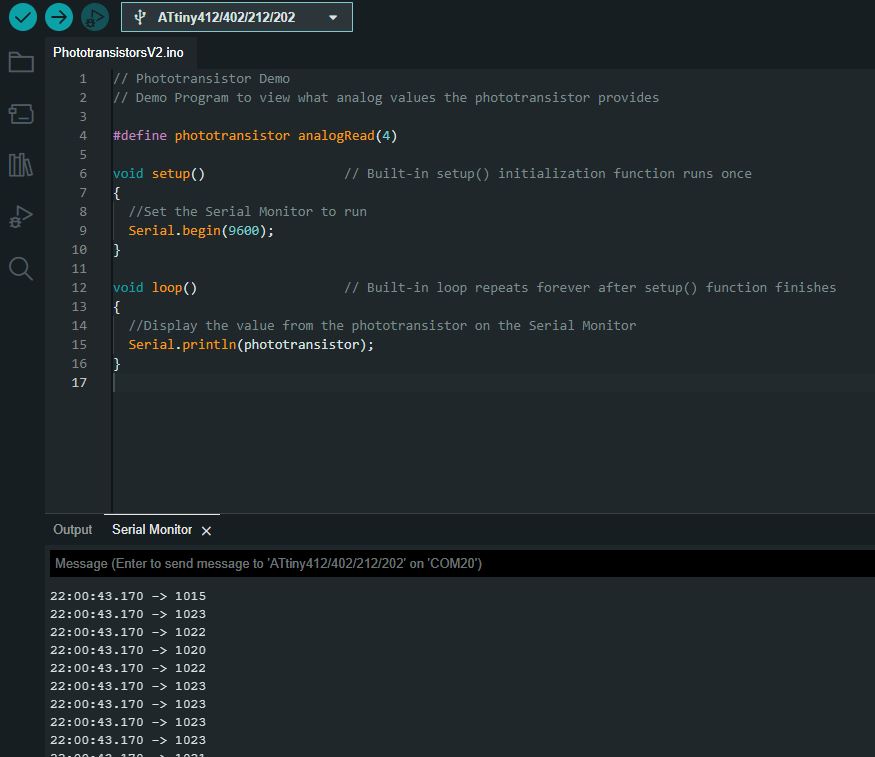
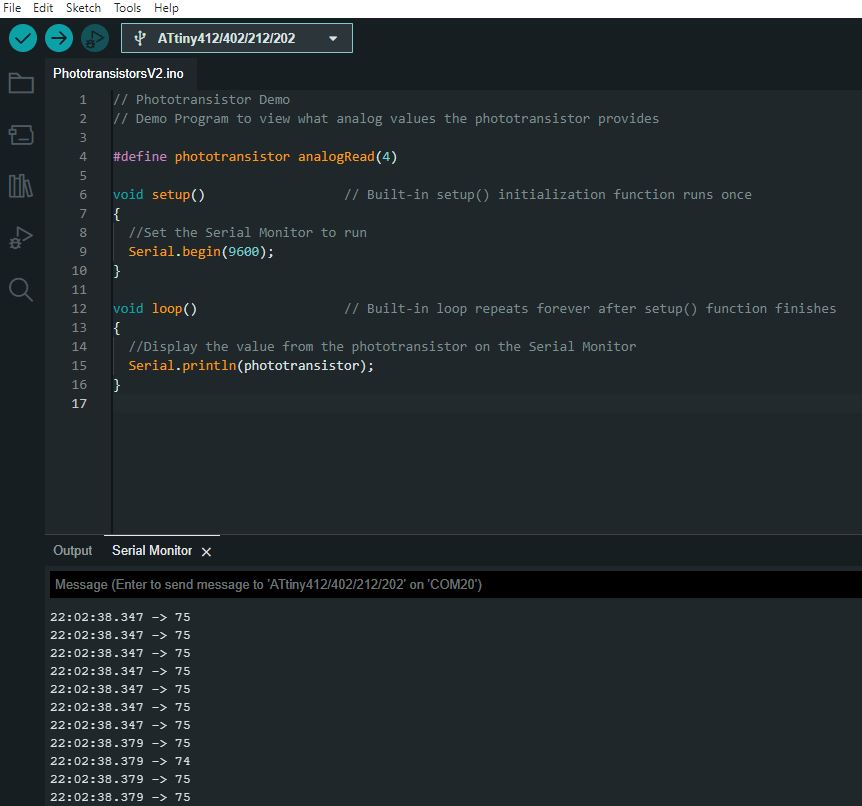
The previous code demonstrated the connection between the sensor and the board, but the data it provided was not particularly helpful. So, I found a code on THIS WEBSITE, that can be used to determine the range of values for the light intensity on the serial monitor.
I then tested the code to see what the values were when the sensor was exposed to direct LED light, when it was under normal room lighting, and when it was completely covered and received no light.
After testing the code, I found that the range for the light intensity values was between 75 and 1023.
A value of 75 represents complete brightness:
While a value of 1023 indicates complete darkness: