14. Interface
Group Assignment
For this week’s Group Assignement I will SumUp all the tools that I have tried in the workshops. All the example will not be fully detailed as we saw them quickly, but I want to use this assignment to have a set of possibilities for the day I want to develop a nice interface for one of my projects
Grasshopper-firefly
Using Firefly module in GrassHopper we saw how to interface an Arduino with our webcam. The communication flow is a bit like with Arduino when working with serial :
- Be sure to have the Serial available
- Choose the correct baud rate
In the example we used, we played with the color content of the webcam video stream make an average of color content to create points and then once we have the point we could play with them.
Aframe
Warning
I was not able to embbed the Aframe show the HTML content at the same time. So the text below is set as a place holder for when I will be able to do it. To see the effect created, one can copy the code to an html file and open it in the browser.
You might have seen that this week’s assignment is a bit different from what the other weeks look like. Indeed I have embedded my Aframe test in the page.
The code is presented below and I first tested it on Glitch where you can easliy code and check the result in real time.
We also saw the possiblity to link the vitural environment with a mobile application using the combo Aframe/AppInvetor/NodeRed.
    <script src="https://aframe.io/releases/1.2.0/aframe.min.js"></script>
    <script src="https://unpkg.com/aframe-environment-component@1.2.0/dist/aframe-environment-component.min.js"></script>

    <a-scene environment="preset: arches">
    <a-box position="0 4 -3" rotation="0 45 0" color="#4CC3D9" shadow></a-box>
    <a-sphere position="0 1.25 -5" radius="1.25" color="purple" shadow></a-sphere>
    <a-cylinder position="0 3 -3" radius="0.5" height="1.5" color="#FFC65D" shadow></a-cylinder>
    <a-man position="0 3 -3" radius="0.5" height="4" color="#FFC65D" shadow></a-man>
    <a-plane position="0 0.5 -4" rotation="-90 0 0" width="4" height="4" color="#7BC8A4" shadow></a-plane>
    <a-sky color="#ECECEC"></a-sky>
    </a-scene>
Processing
We did several examples with processing from simple graphic animation to a more complexe one to interface with an Ardnuio in both direction :
- Arduino board sends commands to the interface to change the color
- Processing sends commands to the Arduino to light some leds.
P5
It is the web equivalent from Processing. A bit more flexible on some syntax but more complicated to interface with the serial port as some extra software has to be installed. Each example done on processing was repeated on P5 so that we could get the equivalence in functions.
But P5 has a nice interface/compiler that tries to guide you through the correct syntax. It works pretty well (the correction advices) if you copy processing code into P5.
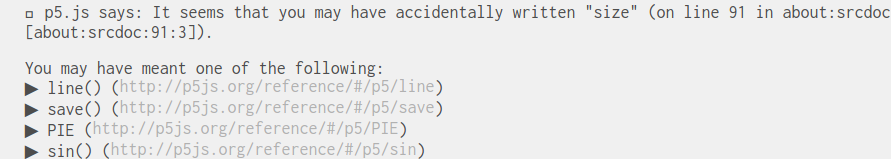
Nice no ?
The following codes and your P5 scripts added to the repo allow to add nice interface to the web page. All the scripts can be tested here : https://editor.p5js.org/
<script src="https://cdnjs.cloudflare.com/ajax/libs/p5.js/1.3.1/p5.js"></script>
<script src="https://cdnjs.cloudflare.com/ajax/libs/p5.js/1.3.1/addons/p5.sound.min.js"></script>
<link rel="stylesheet" type="text/css" href="style.css">
<meta charset="utf-8" />

<script src="sketch.js"></script>
html, body {
  margin: 0;
  padding: 0;
}
canvas {
  display: block;
}
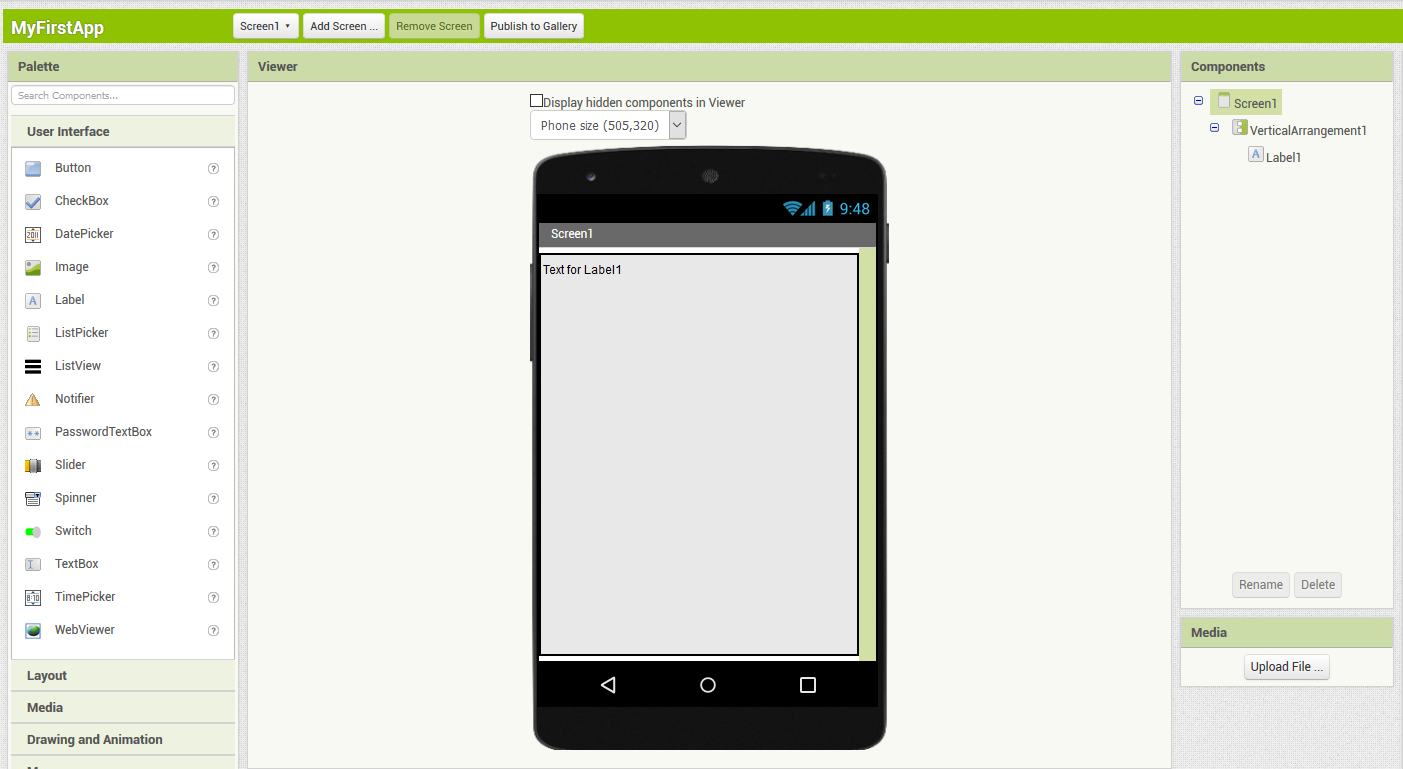
AppInventor
Then we did a quick intro to AppInventor. This web allows to easily create a mobile App from a simple button to more complicated user interaction. I had no time to investigate more but I will definitely use it to improve my final project after the fabacademy.
https://appinventor.mit.edu/
Personal assignment
For my personal assignement I have decided to create an interface to share the collected data with the Autonomous board of the Networking week with the user.
The board
One can see how the boards were designed in the Networking week for full details.
As an overview the setup is :
- An ESP32 board based on the Barduino project
- An Autonomous sensor board of my personal design.
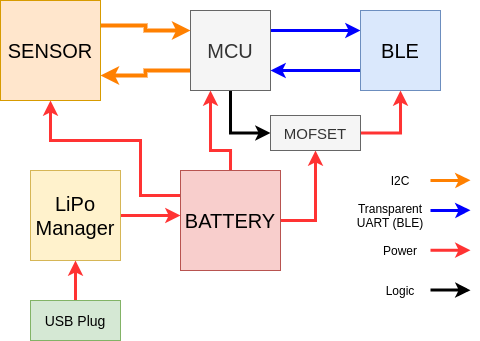
The idea is that the autnomous sensor board works on battery and holds a temperature/humidity sensor managed by an ATTiny1614 that sends the data to the ESP32 using a BLE chip.
Here one can see the structure of the board
And here is the video (from networking week) where we can see the whole setup working.
Criteria and Process
To reach the goal of creating the interface that share the collected data I fix myself the following goals :
- It must have a live feed for the user
- It must have the possiblity to see old data on demand
I have done this using the following scheme
- MQTT Library on the ESP32 to Stream data
- MQTT (Mosquitto) on the RaspberryPi to collect the data
- NODE-red to organize the data pipeline
- Node-red interface to create the interface
- InfluxDB to store the data
This scheme was inspired from the information found in the Barcelona FabLab repo : https://gitlab.com/fablabbcn-projects/learning/multinetworking/-/tree/master/remote
A word on the used Software
The OpenSource software I will be using in this assignment are the folloging ones :
Mosquitto
Mosquitto is a message broker that implements MQTT that allows to read/send publications.
To install it on RaspberryPi
sudo apt-get install mosquitto
sudo apt-get install mosquitto_sub
Node-red
Presentation
Node red is a graphical web interface that works based on flows. A flow is a set of “nodes” and “links” that exchange/modify/diplay data.
It will run in the background of your system as a service. Then when you start it it will show the graphical interface in the web browser.
Here is a quick description of the interface. The user drap&drop nodes from the node-area to the flow area. Link them by click and drag and then adapt the nodes option using the right-hand side tab. The whole concept is based on messages. The message has several properties of which one of the most important is the *payload which holds the information to be transmitted. The software is based on Javascript so it can be useful to know the basics to interact with the messages content but it it not compulsory.

Another point to know about NODE-red is the contribution of the public. Being Opensource, anyone can propose contribution in the form of components that will add node to the node area. Below I give a bit more explanation about how I used that for my project.
Installation
To install it on RaspberryPi
bash <(curl -sL https://raw.githubusercontent.com/node-red/linux-installers/master/deb/update-nodejs-and-nodered)
This command does more than installing node-red. Indeed it will do the whole setup to run the service associated.
Components
Installing Node-red components
For this part, I strongly recommand to install all the “contribs” (extra modules of node-red) using the node-red tools available from within the node-red interface. In the raspberryPi, the contribs installed “from outside” were not recognized and did not work”
To do the work I present below I installed 3 extra contribs (components as explained above). Click on the link to see the nice explanations on how to use them :
Info
For node-red-contrib-json I had some difficulty to properly get the info I needed from the json string. The following github repo (official one) give some example that I used to pass this step : https://github.com/lloyd/JSONSelectTests/tree/master/level_1
Some other links I used to finish my flow :
- Prepare data for 1 shot graph : https://github.com/node-red/node-red-dashboard/blob/master/Charts.md
- Influxdb tutorial : https://funprojects.blog/2020/02/01/influxdb-with-node-red/
InfluxDB
InfluxDB is an SQL TimeBased Serie database.
Here is a nice description of all the key concepts of IDB that one should read before starting : https://docs.influxdata.com/influxdb/v1.8/concepts/key_concepts/
It makes all things really clear and give you an overview on how your database should be built.
To install InfluxDB on raspberryPi :
sudo apt-get install influxdb
sudo apt-get install influxdb-client
Let’s put that in practice
ESP32 streaming the data
To send the data over MQTT I have used the following code. Getting it to work was a long process of data packaging. The most important line is :
client.publish(“autonomousboard”,json_string);
static void notifyCallback(
  BLERemoteCharacteristic* pBLERemoteCharacteristic,
  uint8_t* pData,
  size_t length,
  bool isNotify) {

    DynamicJsonDocument doc(1024);
    doc["sensor"] = "TH_1";
    uint8_t delim = ';';
    String temp;
    for (int i = 0 ; (uint8_t)pData[i] != delim ; i++){

       temp += (char)pData[i];
      int j = i;
    }
    doc["temperature"] = temp.toFloat();// temp; //atof(temp);
    bool hum = 0;

    temp = "";
    for(size_t i = 0; i < length ; i++){//Strictly inferior to lenght because last element is an empty string
      if (hum){
        temp += (char)pData[i];
      }
      if ((uint8_t)pData[i] == delim){
        hum = 1;
        //hum_start = i+1;
      }
    }
    doc["humidity"] = temp.toFloat();// temp; //atof(temp);
    if (doc["humidity"] != -1){// Check if data is valid to be sent to MQTT
      bSend = 1;
    }
    serializeJson(doc, Serial);
    Serial.println("");
    char json_string[1024];
    serializeJson(doc, json_string);
      digitalWrite(LEDBLEIN,HIGH);
    if (bSend == 1){ //Message is complete we send it.
      //We are now connected to the BLE and send info to wifi
        client.publish("autonomousboard",json_string);
Reading MQTT subject : Mosquitto
I installed Mosquitto and Mosquitto_sub on my raspberryPi and using the following command I could read the topic autonomousboard.

Creating the database : InfluxDB
Let’s start InfluxDB typing the following in the terminal
idb
Then I ran the following commands to create my databases.
CREATE DATABASE temperature  // To create one for temperature
CREATE DATABSE humidity  // To create one for humidity
SHOW DATABASES   // To confirm that they are properly created
SELECT * from temperature  // To check if any measurment has been created
Info
As I learnt during my final project, this was not the best way to create the database. Indeed as explained here the influxdb databases are TimeSeries databases and Humidity and Temperature should have been fields of one unique database. That is no issue in my simple example but I loose capacity of the influxDB possibilities.
Node-red
Now that I have put in place the tools to pipe and store my data I can use Node-Red to organize the whole stream.
The flow I created has three main parts
- Part 1 : to read the MQTT stream and convert the data
- Part 2 : to send the data to the live graph and the database
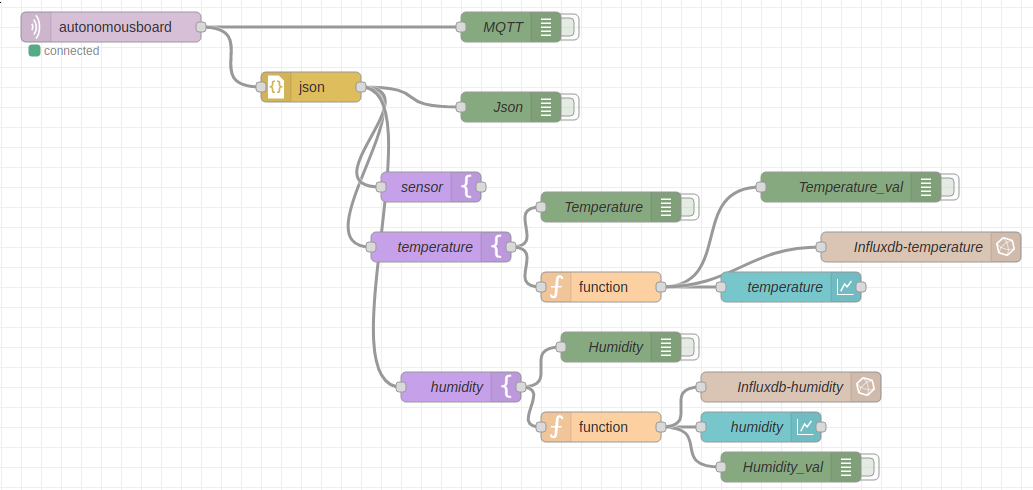
- Part 3 : to ask the user a date and fetch the corresponding data from the database and plot it.

Once the flow is running the user can see the following graphs !
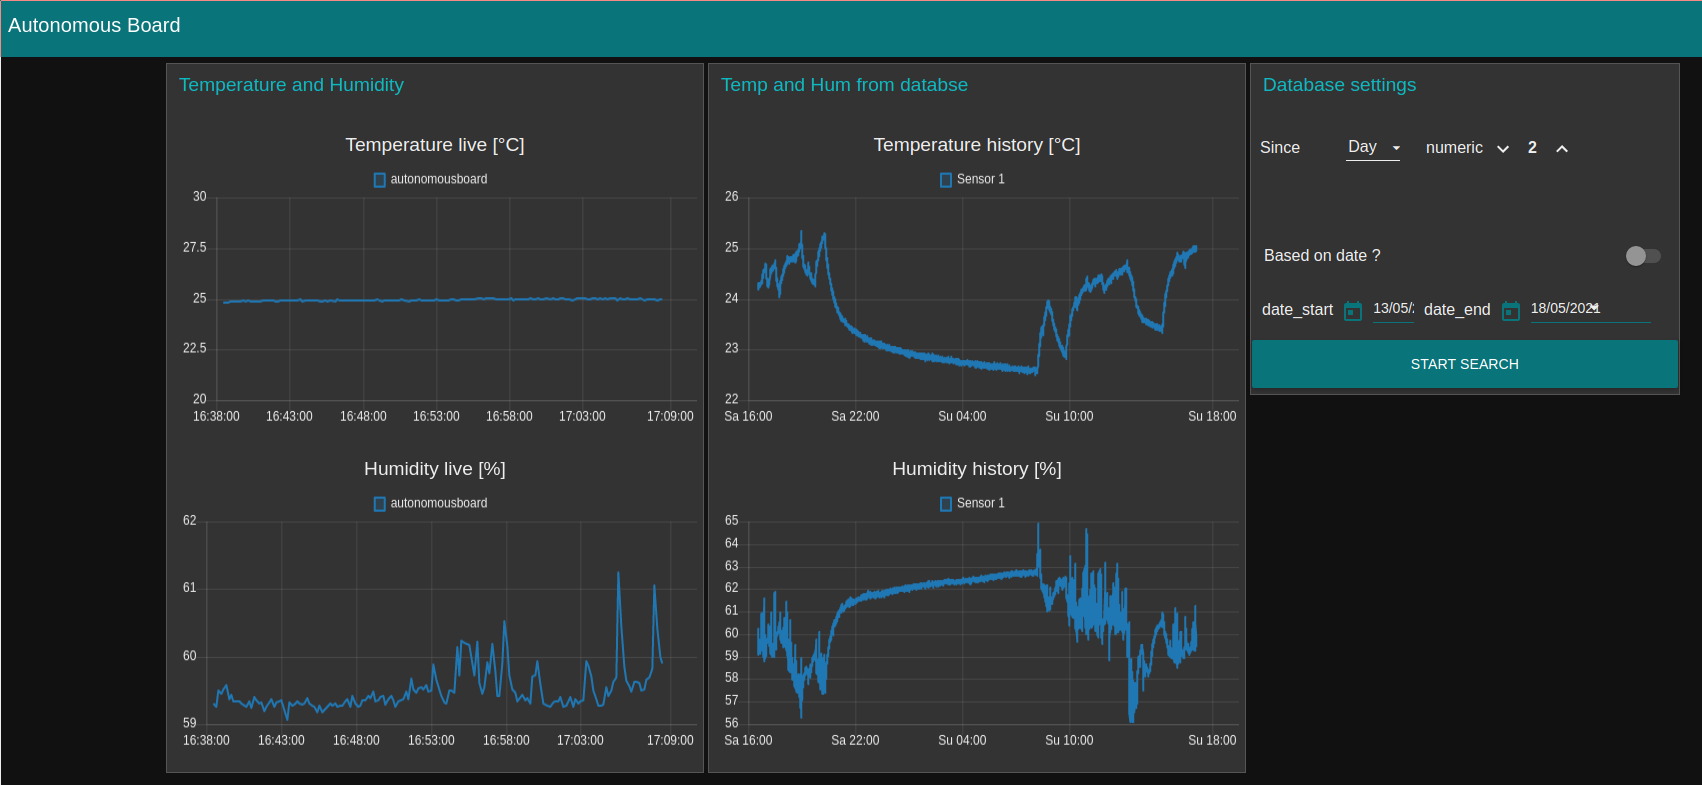
Info
One next step to be done would be to use Nginx to create a server on the raspberry and have the data available from anywhere in the world. But as this would give access to anyone if not done properly I will take time after the fabacademy or during the final project to properly do this step.