10. Inputs
Group assignment
For this week group assignment we tested a lot of different sensor; digital and analogic.
The results are present on Carla Molins web page: http://fabacademy.org/2021/labs/barcelona/students/carla-molins/week10-inputs/.
Personal assignment
This week I will use the board I created during the electronic design week to start my final project.
Reminder
My final project’s goal is to measure the power consumption at home and to be able to know what consums what
I will measure 3 main physical value :
- Current
- Voltage
- Light pulses
As explained in my main project page, I get the inspiration for this project from the web OpenEnergyMonitor and most of the information I will present below was learnt on this web.
The goal of my final project is to measure Power Consumption at home. To measure power one needs two information : Current and Voltage.
Power = Current * Voltage
The light sensor is to detect the pulses of my home Power meter. Indeed it has a small led that flashes every 1/4000kWh. The idea is to compare this information with the physical measurment to calibrate properly my system.
I will step by step describe how I set up my inputs.
Voltage measurement
Theory
The voltage at home in Spain is a sinusoidale signal with an rms value of 230V. This is much higher that what the ADC of the ESP32 can support. So we have to scale down this signal in several steps.
First step is to lower the voltage level using a 230-9V transformer as recommanded by OpenEnergyMonitor.
Info
I personnaly used a 220-7.5v transformer because this is what was available for PCB in my local store. Worst case the measure will not be that good but that does not change the theory of the measurement and I can update this in a future step of improvement. As explained in the ###Setting up the board, I want only one power cable to reach the board so I have to do the transformation within the board.
Second step is to scale down even further the signal to a peak-peak voltage equals to the measuring range of the ADC which is 3.3V. Indeed if the peak-to-peak range is bigger than the ADC range, a part of the information will be lost. In our case we will do it with a voltage divider composed by and 10kOhm and 100kOhm resistors.
Third step is to offset the signal so that it gets fully positive. Indeed the ADCs do not read negative voltage. So we input half of the Vref of the ADC to the measured signal to offset it by 1.15v
What helped me understand the process is the following graph from OEM (https://learn.openenergymonitor.org/electricity-monitoring/voltage-sensing/measuring-voltage-with-an-acac-power-adapter).

Before showing the computation steps, a small reminder. The 230V of the signal are what we call 230V RMS for Root Mean Square. It is a voltage value that represent the equivalent continuous signal with the same power as a sinuosidal signal. It is one of the way to represent a signal and has this advantage of having a physical meaning that can be used in computation.
In other words from OpenEnergyMonitor :
The root-mean-square (r.m.s) value is important because it represents the value of a direct voltage or direct current that will give the same heating effect in a resistor.
The link between RMS and the signal is the following :
Peak Voltage = Sqrt(2) * RMS Voltage = 1.41 * 230 = 235V Peak-to-Peak Voltage = 2* Peak Voltage = 470V
Warning
The OEM says that the voltage output of the transformer can easily reach 12V RMS for a 220-9V transformer. So for safety and dimensionning of the system I will 12*7/9 = 9.5V RMS.
Putting this in numbers will give :
- Peak Voltage after Transformer = My PeakVoltage * transformer ratio = 235 * 9.5/220 = 10.14 V
- Peak Voltage after Voltage divider = Peak Voltage after Transformer * 10kOhm ( 10kOhm + 100kOhm ) = 10.14 * 10 /110 = 0.922 V (Peak-to-Peak = 2 *0.922 = 1.84V)
- Offseted peak Voltage = Peak Voltage after Voltage divider + Vref / 2 = 0.922 + 3.3/2 = 2.072 V
- Min Voltage Value = Offseted peak Voltage - Peak-to-peak = 2.072 - 1.84 = 0.232V
As a consequency the ESP32 ADC will see a signal that goes from 0.232V to 2.072V at a frequency of 50Hz. It could be better optimized to enjoy the full range of the ESP32 ADC but :
- If the approximation is wrong there is a risk to miss part of the signal (and destory the ADC)
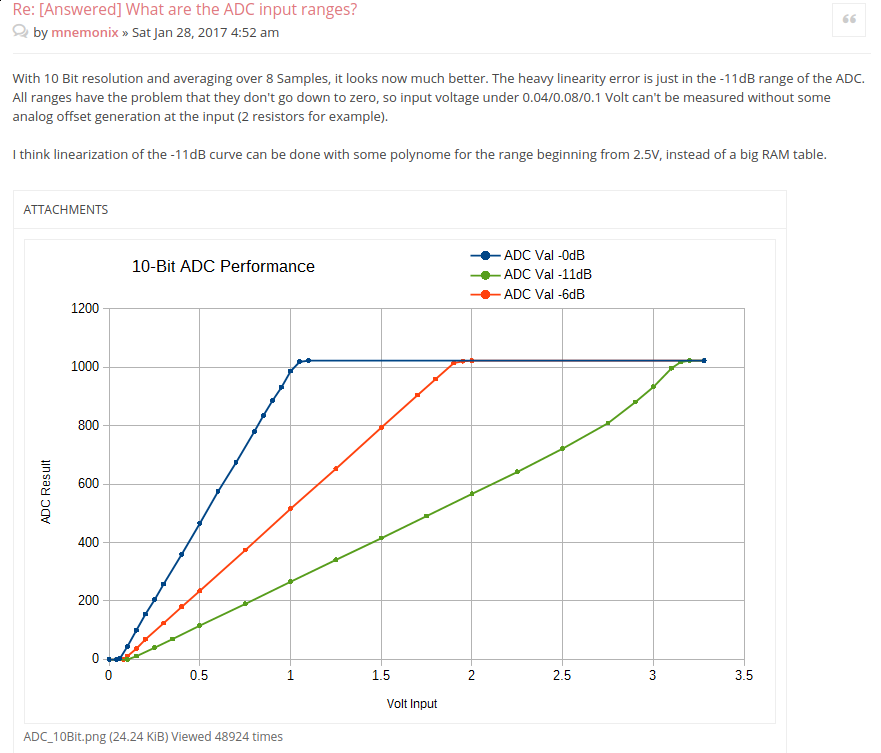
- The ESP32 ADC linearity is criticized on the internet so it is advised not to use the full scale of to execute some calibration.
- As shown on the graph below the lineary improves when using no ADC attenuation. (Thus having a limited measuring scale)
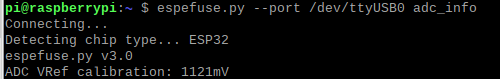
Note
It seems my generation of ESP32 has some in built calibration from the plant. Someday with more time I could check the improvement. But that information about ADC quality will lead me note to use the ESP32 ADC for the final project as explained in the final project pages.
Now that the theory is in place let’s see how I prepare the hardware for that.
Hardware
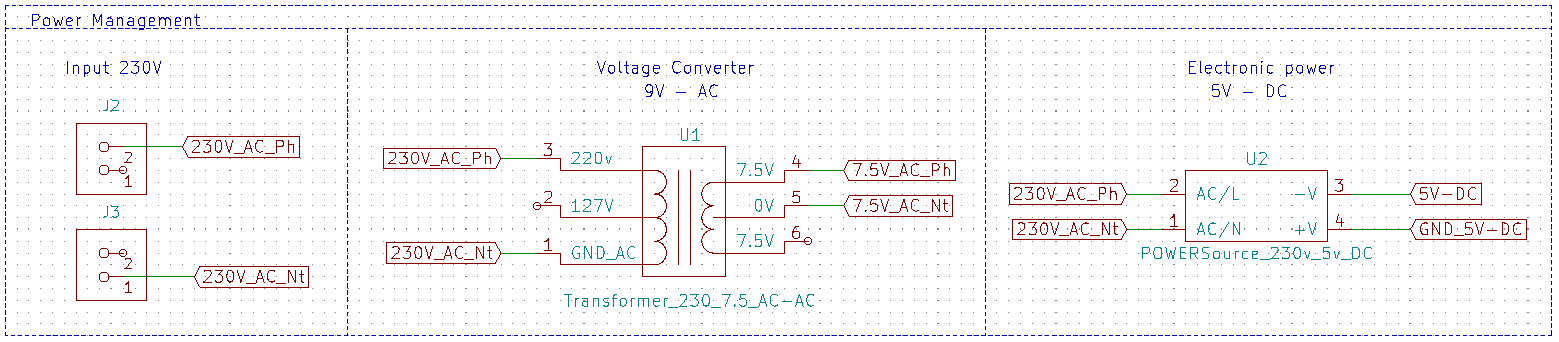
The schematic of the voltage measurement is as follows.
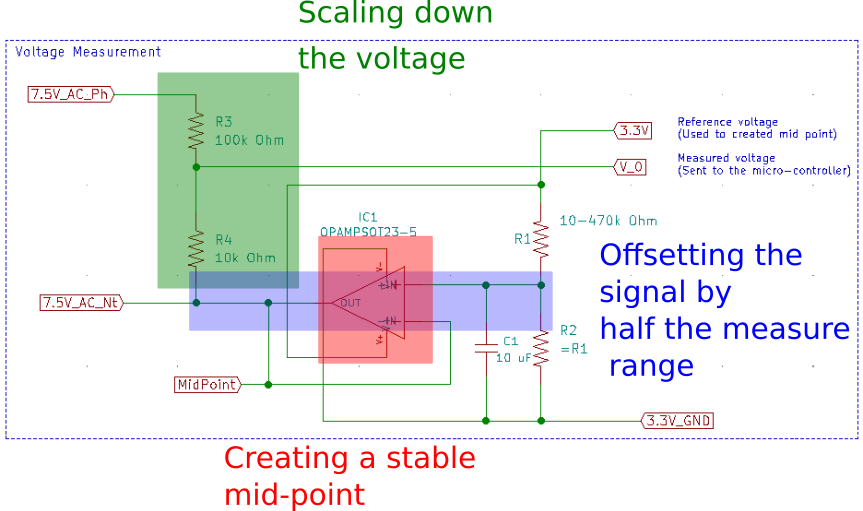
I have highlighted the different functional parts of the circuit. And one can notice a component I did not mention earlier. Indeed an Op-Amp was added to the design as a recommandation from OEM and Robin Emley (https://learn.openenergymonitor.org/electricity-monitoring/ctac/acac-buffered-voltage-bias)
The Op-Amp having a high impedance it helps stabilizing the the mid point signal what ever load is connected after. This set-up is called voltage follower. It’s role is to make the OUTPUT strictly following the positive INPUT. Indeed looping the negative input to the output makes the op-amp reducing the difference between INPUT + and OUTPUT.
Current measurement
Theory
For the votlage our “sensor” was a succession of voltage manipulation. Measuring currents can be done in several ways. I will explain two that I have seen. This is the core of the project.
Shunt resistance
This method consist in a direct application of the Ohm law U = R*I.
The goal is to let the current pass through a known resistor and measure the voltage drop.
This way one can deter,ine the current using I = U / R.
For this methode with high current one would like to use a low resitance to avoid high heat dissipation. Indeed Power = U * I = R * i².
The disadvantage of this methode is that it is really intrusive as one need to redirect the current flow to the measuring board.
Ampermetric clamp
This method is a passive method and the one I will use here. We use the fact that any moving current will create a magnetic field around the wire it flows in.
It works like this :
- Electrical current in the wire create a magnetic field
- Ampermetric clamp kernel drains the magnetic field and creates a current in the 2nd wire
- We measure this current making it pass through a burden resistor
The ampermetric clamps might or not have a burden resistor.
The clamp I use a SCT013 from YHDC company and has a 33Ohm burden resistor. It is rated as 30A/1V.
Once more the OEM diagram explains it really well and I based my design on this information.

Hardware
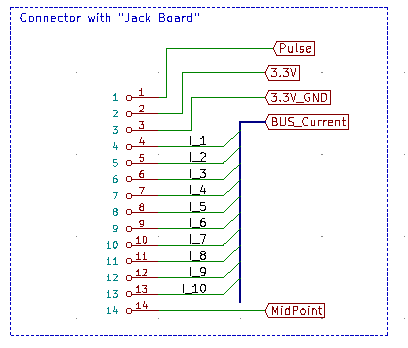
The only difference with respect to the hardware proposal of OEM is that as I have a Burden resistor within the clamp, I do not need to have it on my board.
So I created a specific board to route all my signal to the ESP32. This board receives what I call the mid point from the main board which is the offset to adapt the signal to the ESP32.
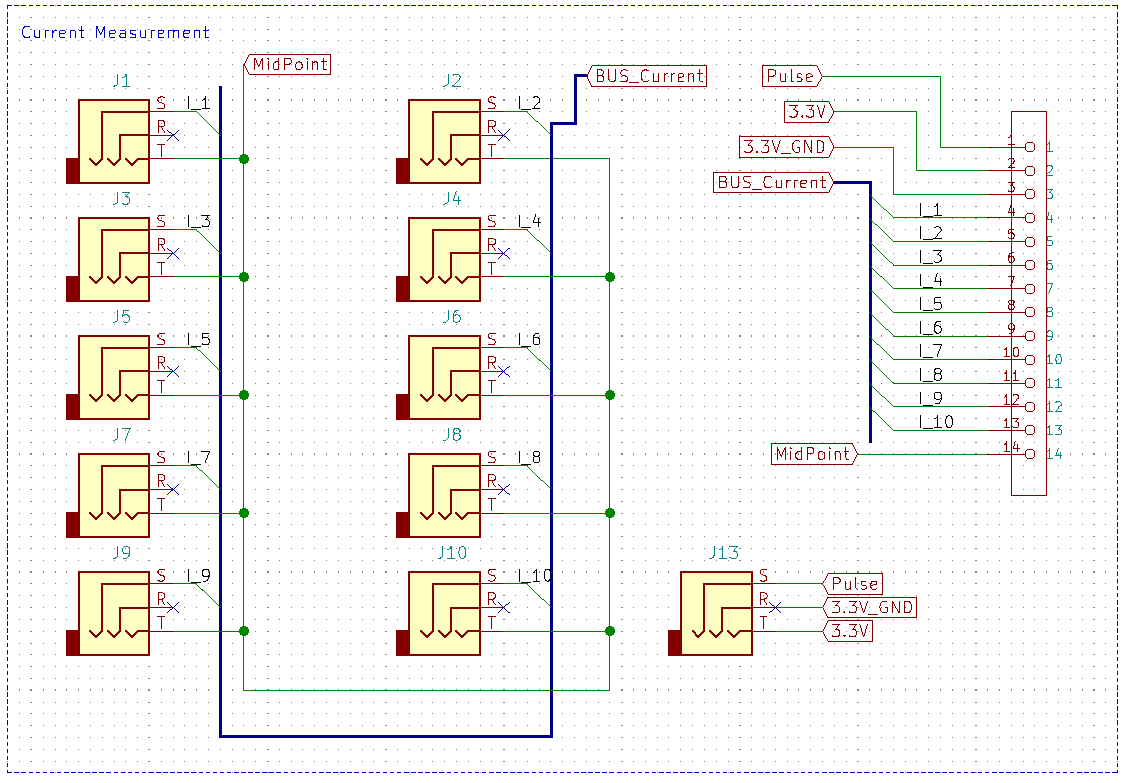
I used the “BUS” function of kicqd to make a clean diagram.
Light sensor
Electronic
Finally the light sensor. The goal is to record every light pusle using a specific LED called a phototransistor that reacts to light. This was a first for me to work with this kind of set up.
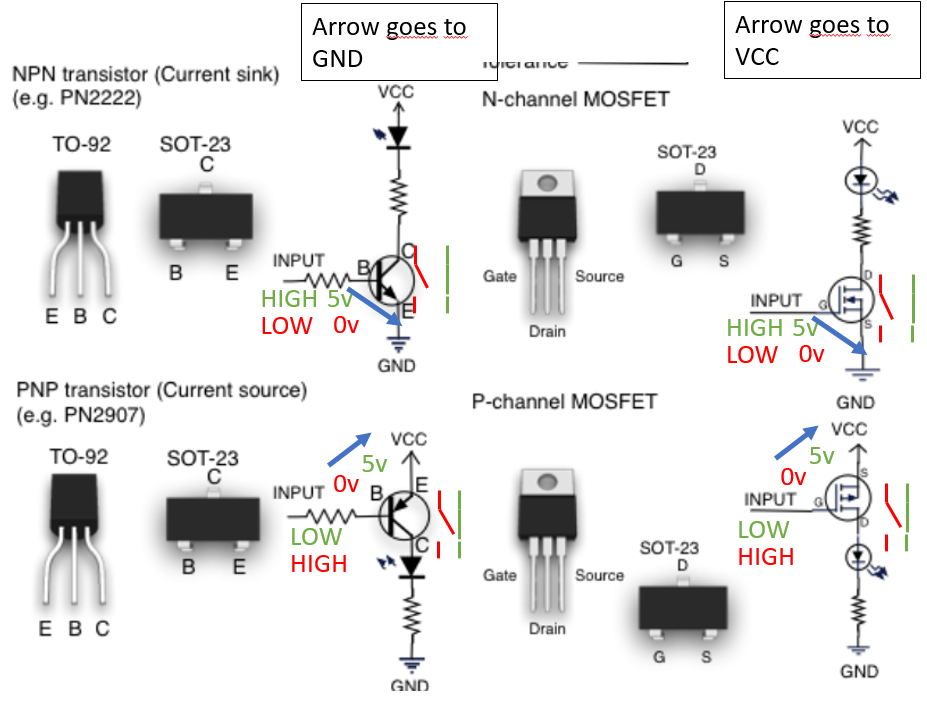
To understand well the properties of transistor and not to make mistake I adapted a resource given by my instructor.
My additions are as follows. The Voltage level indicated (5V or 0V) is the voltage needed to have the transistor in the state indicated by the drawing of the same color.
As an example, the N-channel MOSFET will behave as a closed switch if 5V is applied between the Gain and Source.
The design I will show below is based on my interpretation of the proposal of OEM :

As the phototransistor is sensor and transistor at the same time I created it as follows. Also there was some doubt on the resistor value and pull up/down.
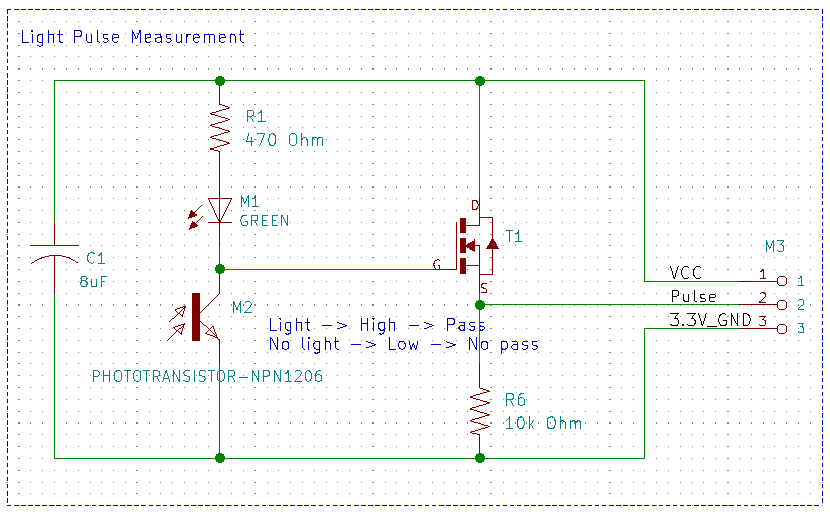
I lacked a bit of time for investigation and I will try to make it further during the final project. But with this set up I was able to confirm the sensor if working by lighting the green led that represent every pulse (but not sending the info to the ESP32).
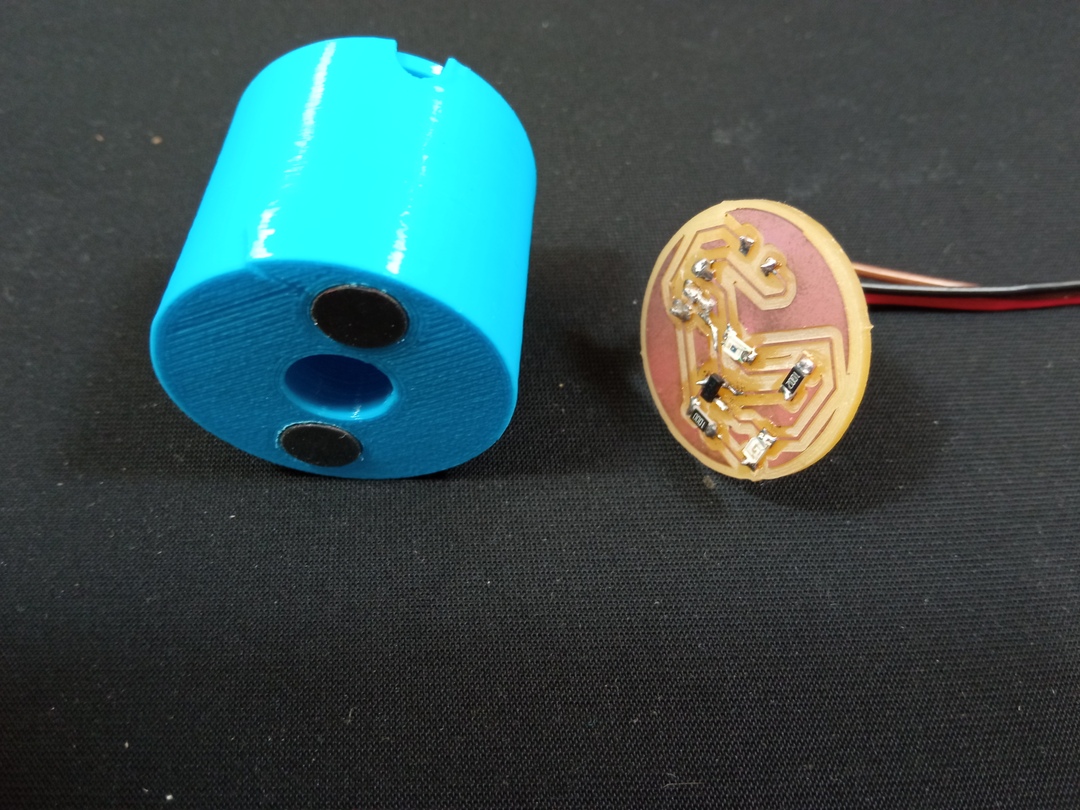
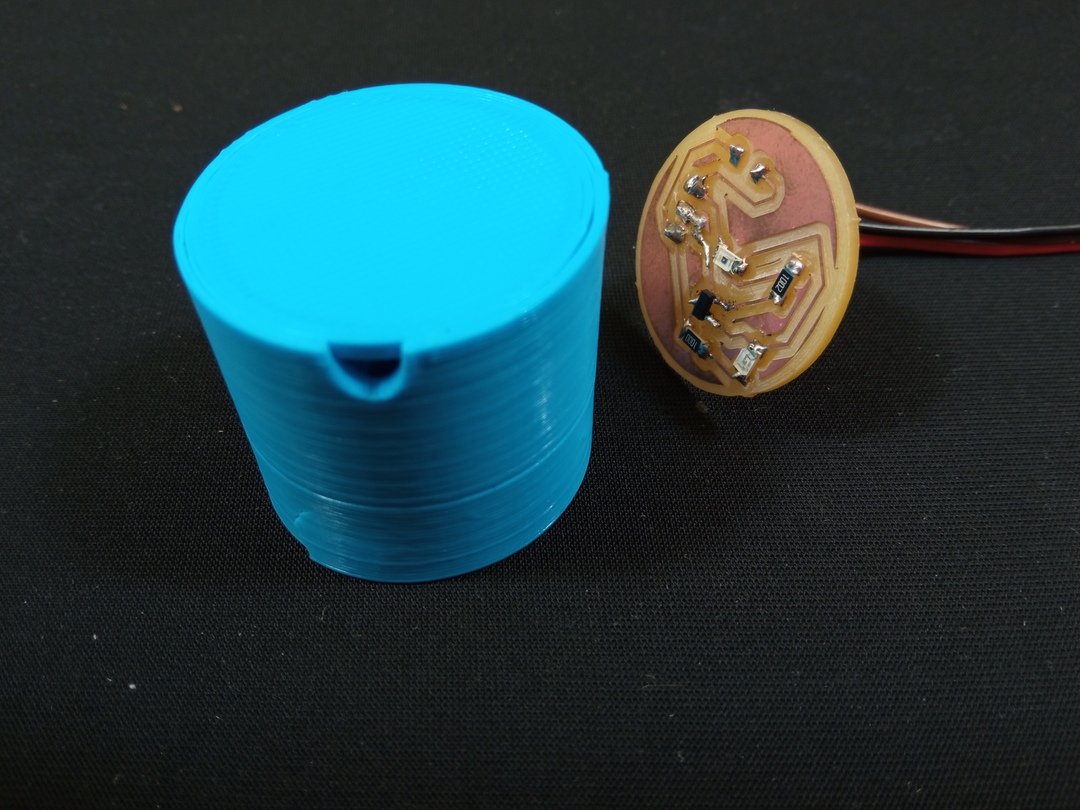
Casing
I used this occasion to create the sensor casing. In spain the energy meter has a circular magnetic place where to put the sensor.
This is the printing result
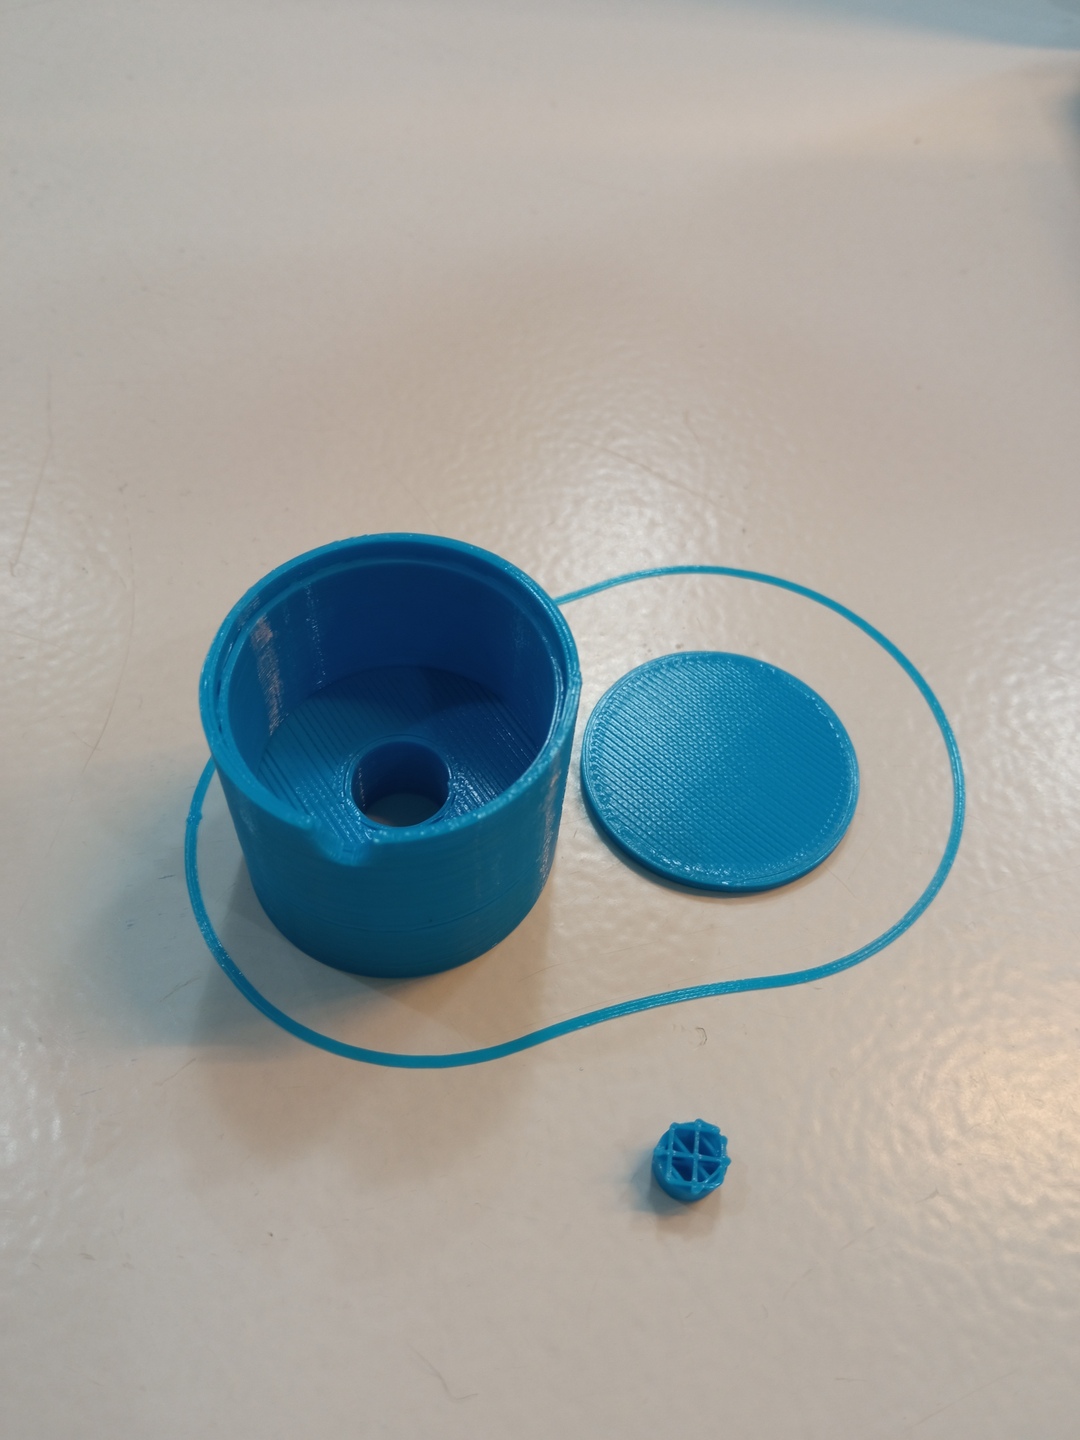
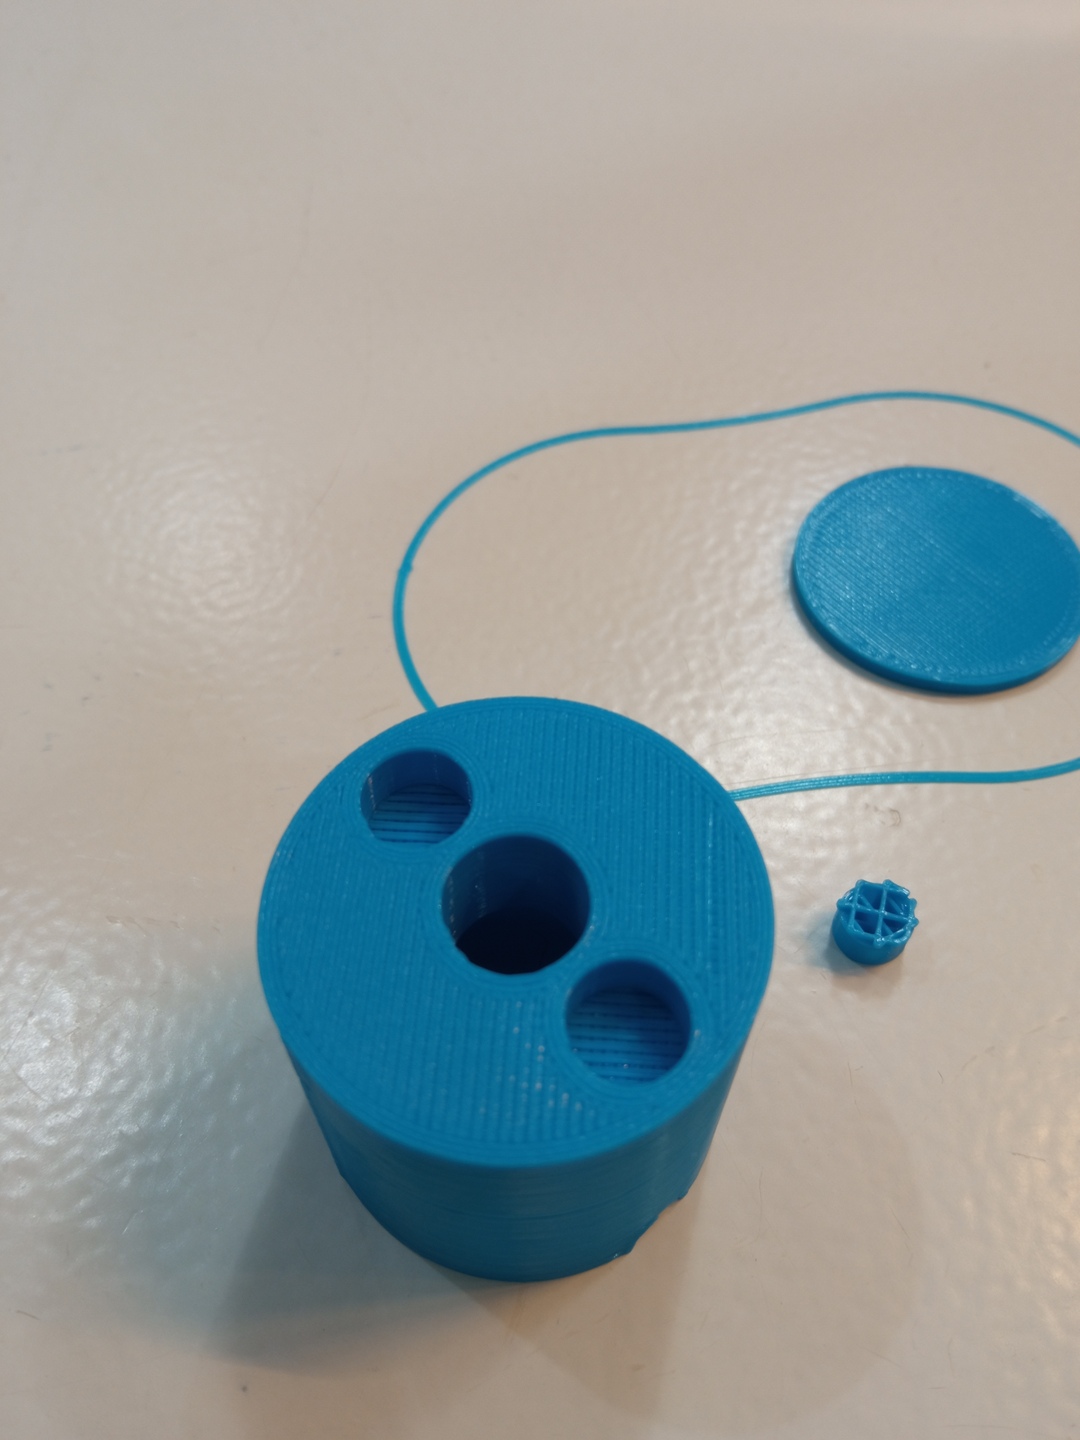
Now the casing and the board. As one can see, the LED that is supposed to detect the light is placed in front of the hole.
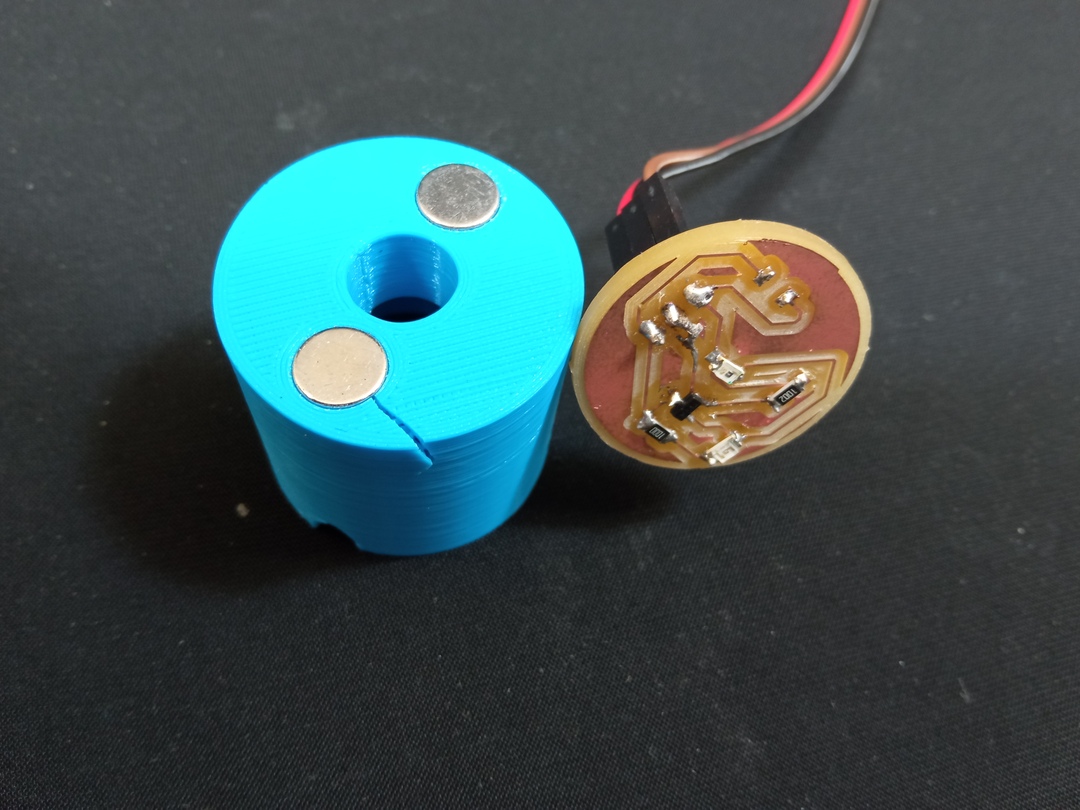
And I put it in place on my counter, it fits nicely
Setting up the board
Now that all the parts are designed and ready I worked of on how to arrange the electronic to make it fit in the fuse box.
It in not an easy task but the I ended up with the following setup.
At that moment the important part for me was to have the connections available as for any fuse -> on the lower part.
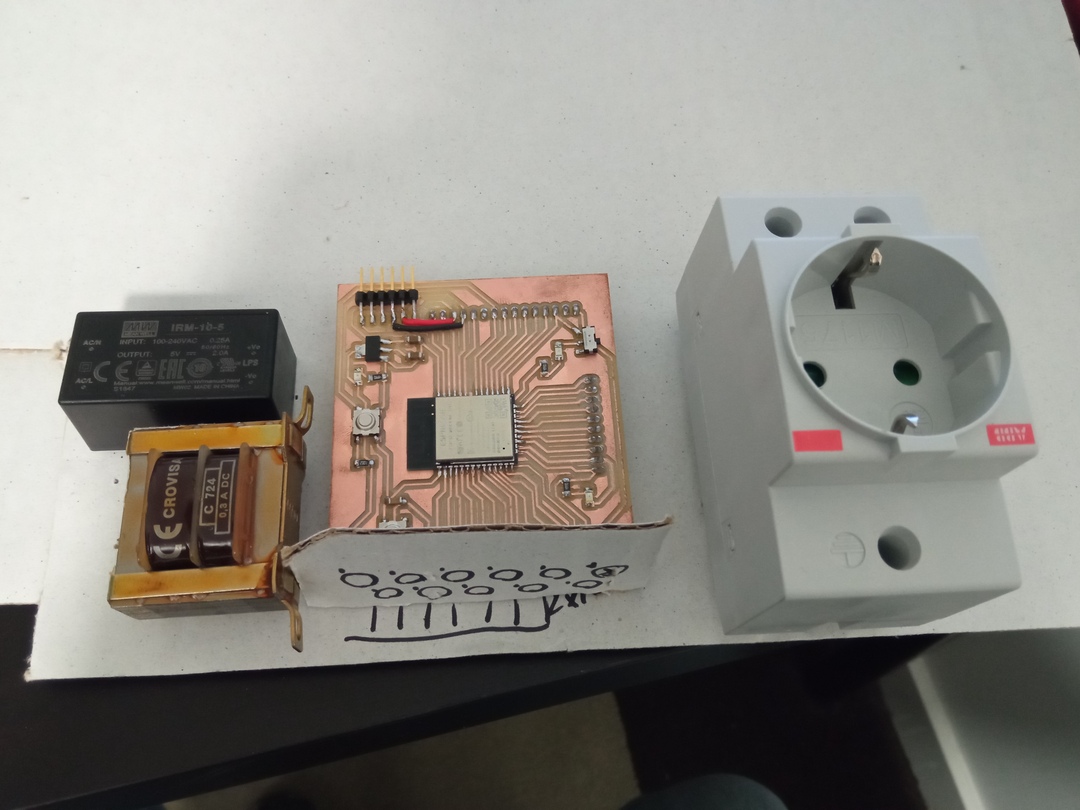
Powering the electronic
A specific part I want to mention. I want my project to have as less cable as possible (apart from the ten cables from the ampermetric clamps …) so I want the 230V to be used for Voltage measurment AND powering the electronic. So I introduced a 230-5V-2Amps power source in my design.
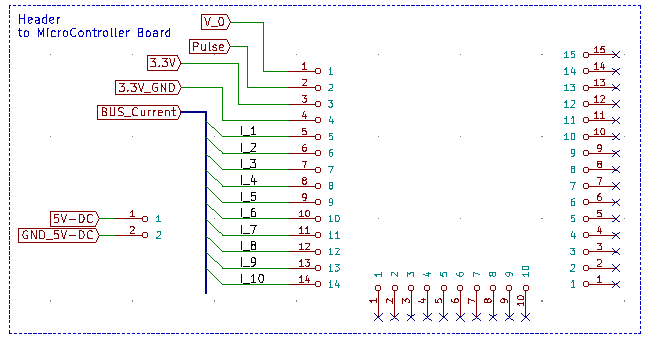
Shield
To connect the ESP32 (made during electronic design) and the jack board I prepared a few connectors.
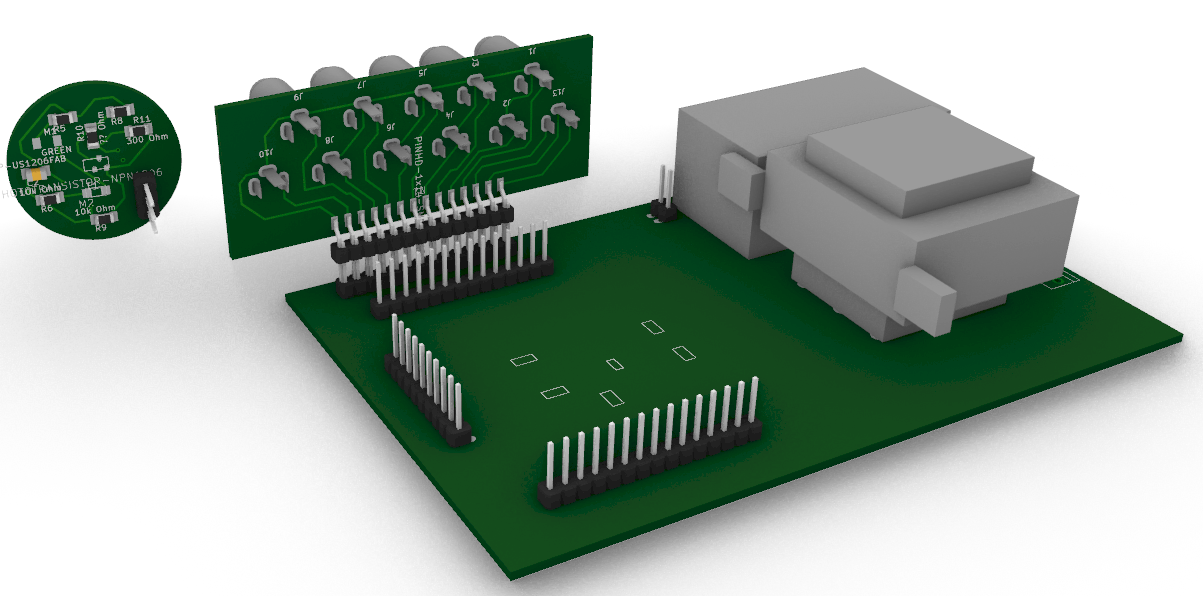
3D View
To be sure that everything would fit I worked a lot with FreeCAD and Kicad to have all the important parts in 3D and make my measurement. I spent a lot of time on this and making the components but that will help me A LOT during the final project.
Final result
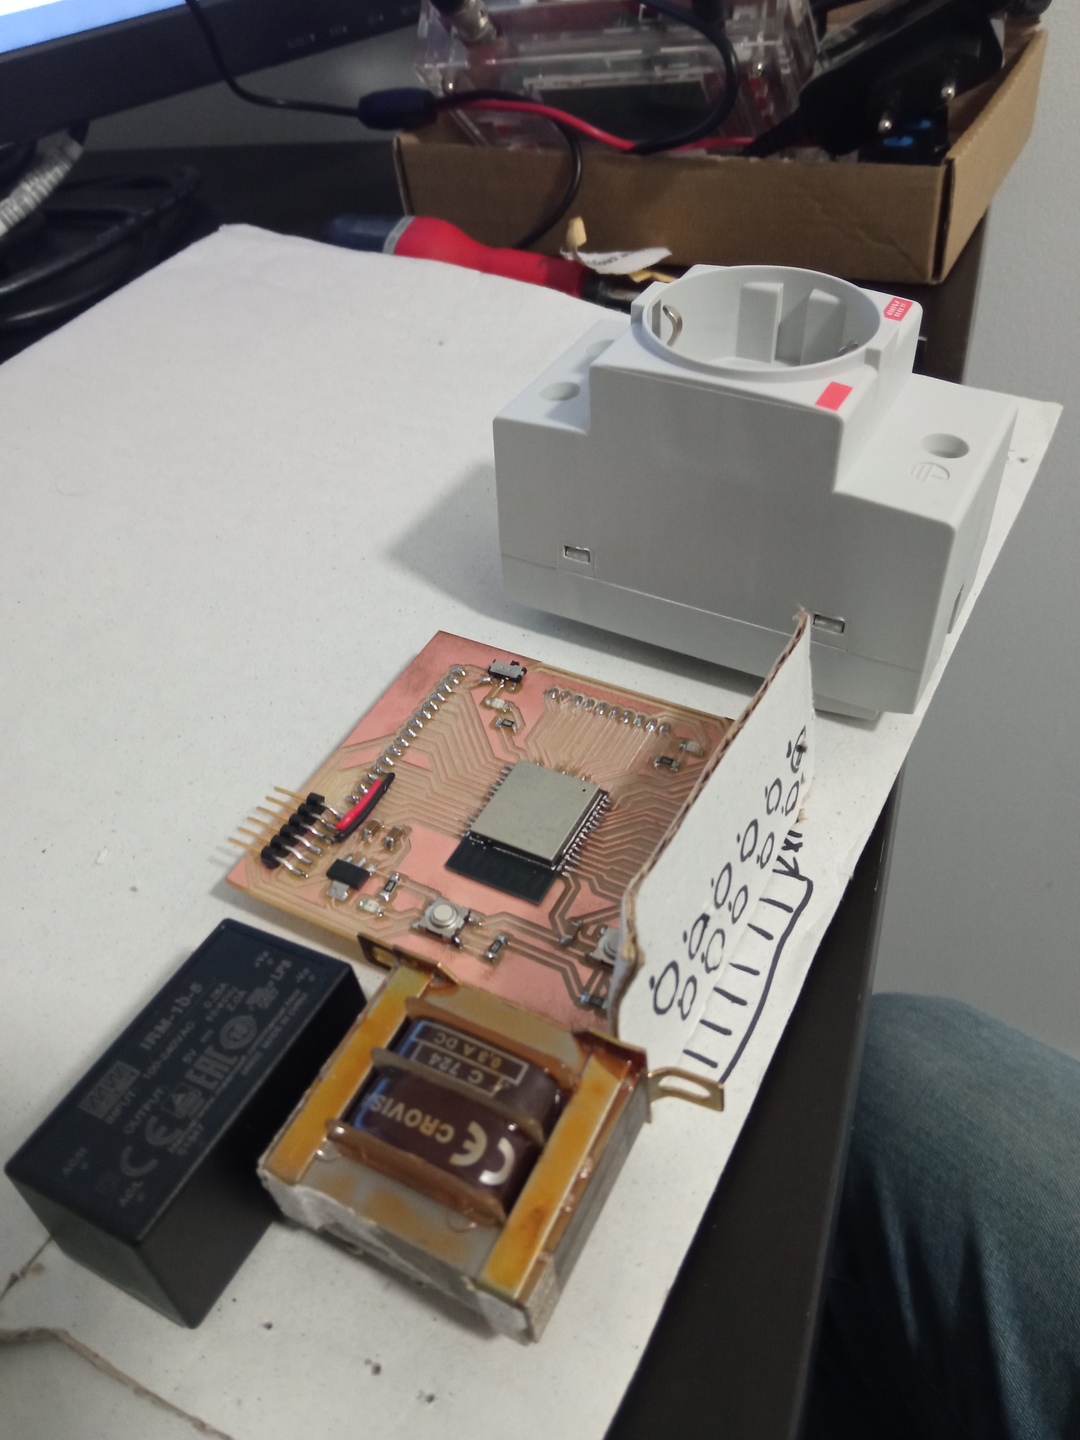
Hardware
Here is the prototype of my final project assembled. I am pretty happy with the result and layout.
As one can see, as my ESP32 board does not have the 5V input I added temporarily the two RED/BLACK cable for powering the board from the 220V.
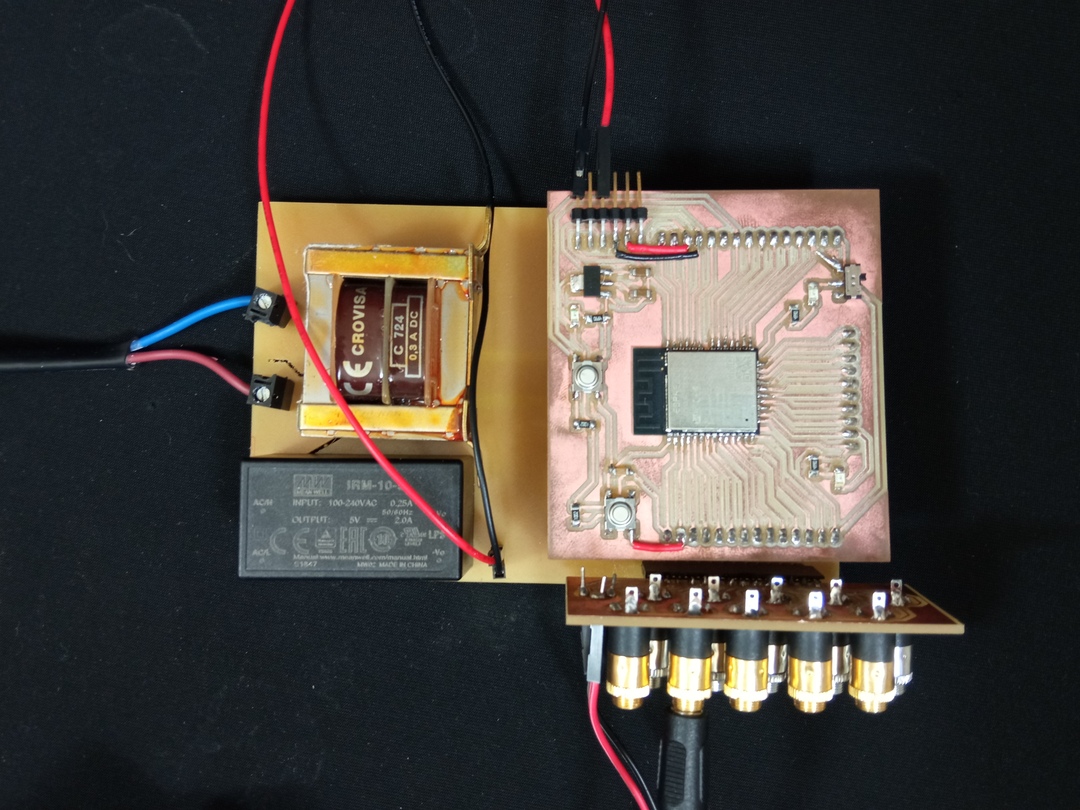
And it was to plan … I made some mistake in the design due to the fact that I do not send all the ESP32 pins on my shield and took the wrong reference to make my schematic. I learnt my lesson …
Measurement
The code I used to test my measurement is presented below. At the moment my main issue was how to transform the ADC value into human readable information.
I present the code in two parts, first the “active part” then for information the full code.
To get back the voltage and current value, I tried to do the backward computation but I did not work so good. I could see some 50Hz signal on the plot monitor of Arduino but the absolute value did not make sense to me. Also at that time for the current I had no way to use a calibrated current source (I worked with a 60Watt bulb which is not enough for testing purpose).
Then I started to look deeper in how the OpenEnergyMonitor project is doing the computation and it seems much more complicated with :
- digital filters
- phase shift analysis
- a lot of other things that I have to analyze
    //Pin definition
    #define I_1 34
    #define V_0 13
    //Resolution
    int res = 4095;
    float vcc = 3.3;

    //Current
    rI_1 = analogRead(I_1) * vcc / res;
    rI_1_conv = (rI_1 - (vcc/2))   * 2000 * ((100000+10000)/10000) * 30;
    //Voltage
    rV_0 = analogRead(V_0) * vcc / res;
    rV_0_conv = (rV_0 - (vcc/2))   * (220/8.1) * ((100000+10000)/10000);
    rPulse = analogRead(Pulse) * vcc / res*50;
Full code
//Pin definition
//Current
#define I_1 34
#define I_2 35
#define I_3 32
#define I_4 33
#define I_5 25
#define I_6 26
#define I_7 27
#define I_8 14
#define I_9 12
#define I_10 21

//Voltage
#define V_0 13

//Light pulse
#define Pulse 2

//Declaration of variables
float rI_1;
float rI_1_conv;
float rI_2;
float rI_3;
float rI_4;
float rI_5;
float rI_6;
float rI_7;
float rI_8;
float rI_9;
float rI_10;
float rV_0;
float rV_0_conv;
float rPulse;

//Resolution
int res = 4095;
float vcc = 3.3;

void setup() {
  // put your setup code here, to run once:

pinMode(I_1,INPUT);
pinMode(I_2,INPUT);
pinMode(I_3,INPUT);
pinMode(I_4,INPUT);
pinMode(I_5,INPUT);
pinMode(I_6,INPUT);
pinMode(I_7,INPUT);
pinMode(I_8,INPUT);
pinMode(I_9,INPUT);
pinMode(I_10,INPUT);
pinMode(V_0,INPUT);
pinMode(Pulse,INPUT);


  //Serial.begin(115200);
  //Serial.begin(9600);
  Serial.begin(250000);

}

void loop() {
  // put your main code here, to run repeatedly:
rI_1 = analogRead(I_1) * vcc / res;
rI_1_conv = (rI_1 - (vcc/2))   * 2000 * ((100000+10000)/10000) * 30;
//2000 = turns on secondary coil
//((100000+10000)/10000), voltage reduction bridge
//30 because the clamp is a 30A/1V
//Primary peak-current = RMS current × √2 = 100 A × 1.414 = 141.4A
//c) Divide the peak-current by the number of turns in the CT to give the peak-current in the secondary coil.
//The YHDC SCT-013-000 CT has 2000 turns, so the secondary peak current will be:
//Secondary peak-current = Primary peak-current / no. of turns = 141.4 A / 2000 = 0.0707A
//d) To maximise measurement resolution, the voltage across the burden resistor at peak-current should be equal to one-half of the Arduino analog reference voltage. (AREF / 2)
//If you're using an Arduino running at 5V: AREF / 2 will be 2.5 Volts. So the ideal burden resistance will be:
//Ideal burden resistance = (AREF/2) / Secondary peak-current = 2.5 V / 0.0707 A = 35.4 Ω

//Primary current = 2000 * secondary current = 2000 * AREF/2 / Burden resistance

//float rI_2 = analogRead(I_2) * vcc / res;
//float rI_3 = analogRead(I_3) * vcc / res;
//float rI_4 = analogRead(I_4) * vcc / res;
//float rI_5 = analogRead(I_5) * vcc / res;
//float rI_6 = analogRead(I_6) * vcc / res;
//float rI_7 = analogRead(I_7) * vcc / res;
//float rI_8 = analogRead(I_8) * vcc / res;
//float rI_9 = analogRead(I_9) * vcc / res;
//rI_10 = analogRead(I_10) * vcc / res;
rV_0 = analogRead(V_0) * vcc / res;
rV_0_conv = (rV_0 - (vcc/2))   * (220/8.1) * ((100000+10000)/10000);
rPulse = analogRead(Pulse) * vcc / res*50;
//Serial.print(rI_1);
//Serial.print(" ");
//Serial.print(rI_2);
//Serial.print(" ");
//Serial.print(rI_3);
//Serial.print(" ");
//Serial.print(rI_4);
//Serial.print(" ");
//Serial.print(rI_5);
//Serial.print(" ");
//Serial.print(rI_6);
//Serial.print(" ");
//Serial.print(rI_7);
//Serial.print(" ");
//Serial.print(rI_8);
//Serial.print(" ");
//Serial.print(rI_9);
//Serial.print(" ");
//Serial.print(rI_10);
//Serial.print(" ");
//Serial.print("V_BeforeConv:");
//Serial.print(rV_0);
//Serial.print(", ");
//Serial.print("V_afterConv:");
//Serial.print(rV_0_conv);
//Serial.print(", ");
Serial.print("I_BeforeConv:");
Serial.println(rI_1);
//Serial.print(", ");
//Serial.print("I_afterConv:");
//Serial.println(rI_1_conv);
//Serial.print(" ");
//Serial.println(rPulse);
//delay(1); //Wait 1ms -> 20points per cycle (50Hz)

}
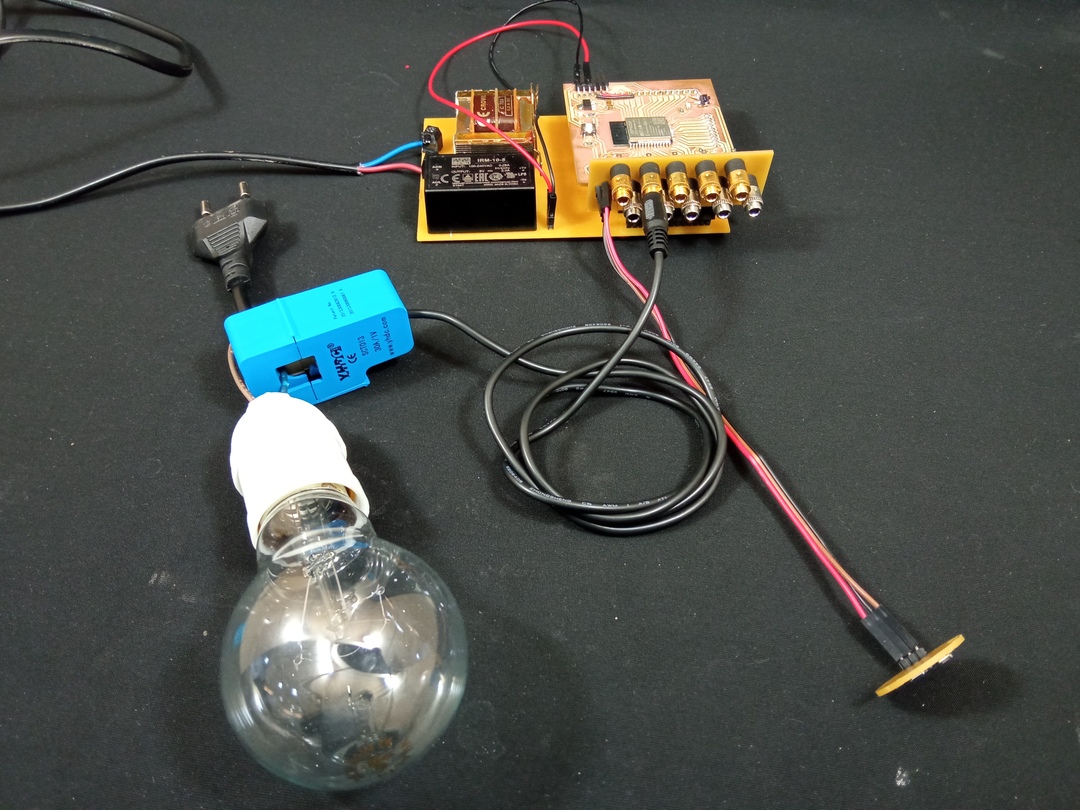
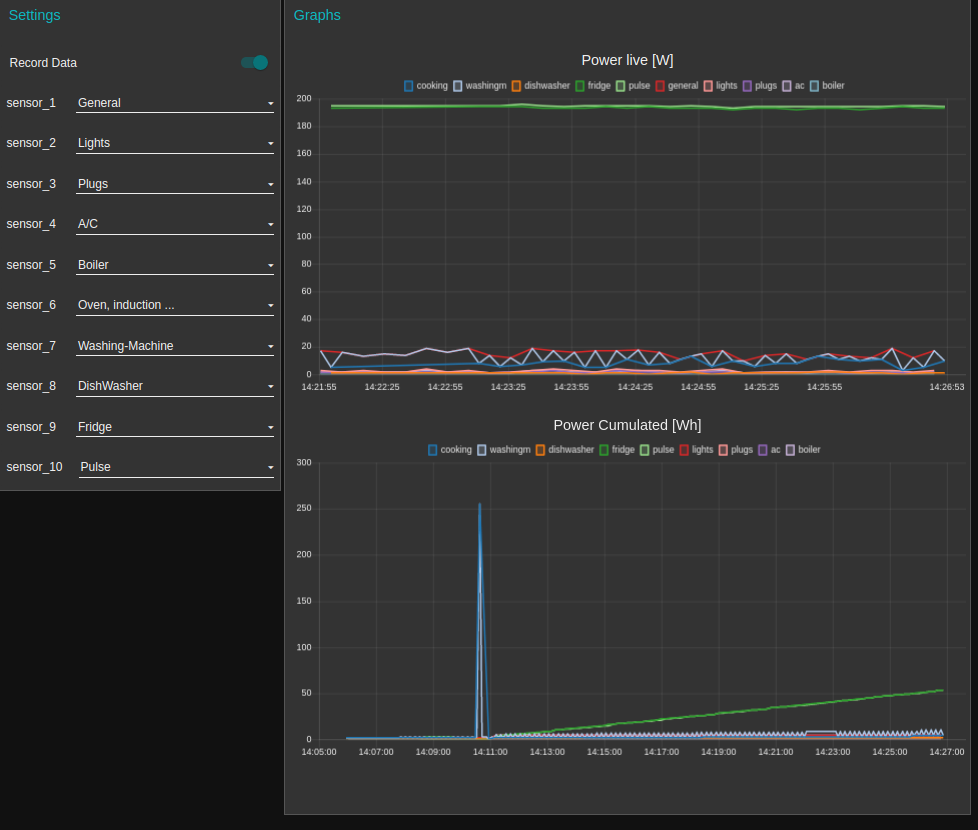
After doing my final project I come back to this section to show that the plans I prepared during this input week allowed me to measure current consumption thanks to all the work done this week as it was the base for my final project. Here is an overview of the data I got through the interface.
I have connected a 60W bulb to 2 current sensors and we can see that the system needs to be calibrated a little bit because it sees 190W… Still I am really happy because it means the system is almost operational. Concerning the cumulated power I had some trouble with the MQTT connection which sent wrong values.
Conclusion
This week was really a deep step into the final project for me and helped me to draw several conclusion for the rest of the project :
- I will use EmonLib_CM library for my project
- I have the design of the electronic
- I should not use the ESP32 ADC
Files
-
To reproduce the Electronic
- LuzMon “Main Board”
- LuzMon JackBoard “Current sensors”
- LuzMon “Light Sensor”
- 3D parts for Kicad
- If you work with a Roland milling machine all the files for direct production are in the exports subfolder. Otherwise everything is available from Schematic, PCB files, SVG, PNG and RML files.
-
For the software
-
Light sensor