Probe an input device's analog levels and digital signals
Individual assignment:
Measure something: add a sensor to a microcontroller board that you have designed and read it
Research_How Input Devices Works with Microcontroller
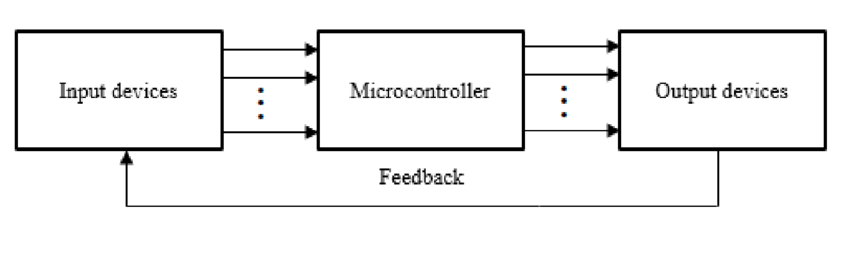
Input devices play a crucial role in interacting with microcontrollers. These devices convert physical actions or environmental conditions into electrical signals that the microcontroller can understand and process.For example, a push button acts as a simple input device. When pressed, it closes a circuit, generating a logic high or low signal that the microcontroller's input pin detects. Sensors like temperature sensors, light sensors, or accelerometers measure specific parameters and send corresponding analog or digital values to the microcontroller.The microcontroller continuously monitors its input pins for changes in voltage or digital states. It uses programmed instructions to interpret these signals and take appropriate actions based on the received input.In some cases, input devices may use communication protocols such as I2C or SPI to send data to the microcontroller. The microcontroller then follows the protocol's rules to receive and decode the information.Overall, the seamless integration of input devices with a microcontroller enables the creation of systems that respond intelligently to the surrounding environment or user interactions.
List of Ports:
Digital Ports:
These are individual pins that can be set as input or output and can handle binary (0 or 1) values.
Analog Ports:
Some microcontrollers have pins that can directly receive analog voltage levels.
Comparator:
Compares two input voltages and provides a digital output indicating which input is higher or if they are equal.
A/D (Analog-to-Digital Converter):
Converts analog input voltages into digital values that the microcontroller can process. This is essential for interfacing with sensors that output analog signals.
I2C Method:
I2C (Inter-Integrated Circuit) is a serial communication protocol that allows multiple devices to be connected to the microcontroller using only two wires (SDA for data and SCL for clock).Input devices such as sensors or peripheral ICs that support I2C can send data to the microcontroller by following the I2C communication protocol. The microcontroller needs to be programmed to handle the I2C communication and extract the relevant input data from the connected devices.
List of Input Sensors and Details
Temperature Sensor
Measures the ambient temperature.Commonly used in climate control systems, industrial processes, and electronic devices to monitor and control temperature.Outputs a voltage or digital signal proportional to the temperature.
Light Sensor
Detects the intensity of light.Applied in automatic lighting systems, cameras for adjusting exposure, and solar-powered devices.Can provide values in lux or as a percentage of maximum light intensity.
Pressure Sensor
Measures the pressure exerted on it.Found in automotive systems (e.g., tire pressure monitoring), industrial pressure control, and medical devices.Outputs data in units such as pascals or psi.
Accelerometer
Measures acceleration along one or multiple axes.Used in mobile devices for orientation detection, gaming, and vehicle safety systems.Provides values in units of g (gravitational acceleration).
Gyroscope
Measures rotational velocity or angular rate.Utilized in navigation systems, drones, and virtual reality devices for orientation tracking.Outputs data in degrees per second or radians per second.
Proximity Sensor
Detects the presence or proximity of an object.Commonly found in smartphones for screen lock/unlock and automatic call muting.Outputs a binary signal indicating proximity.
Humidity Sensor
Measures the relative humidity of the environment.Important in weather stations, agricultural applications, and indoor climate control.Outputs humidity values as a percentage.
Magnetometer
Measures the strength and direction of the magnetic field.Used in compasses, navigation systems, and some industrial applications.Provides data in terms of magnetic field strength and direction.
Group Assignment My Part
Part1. Learn about the Oscilloscope
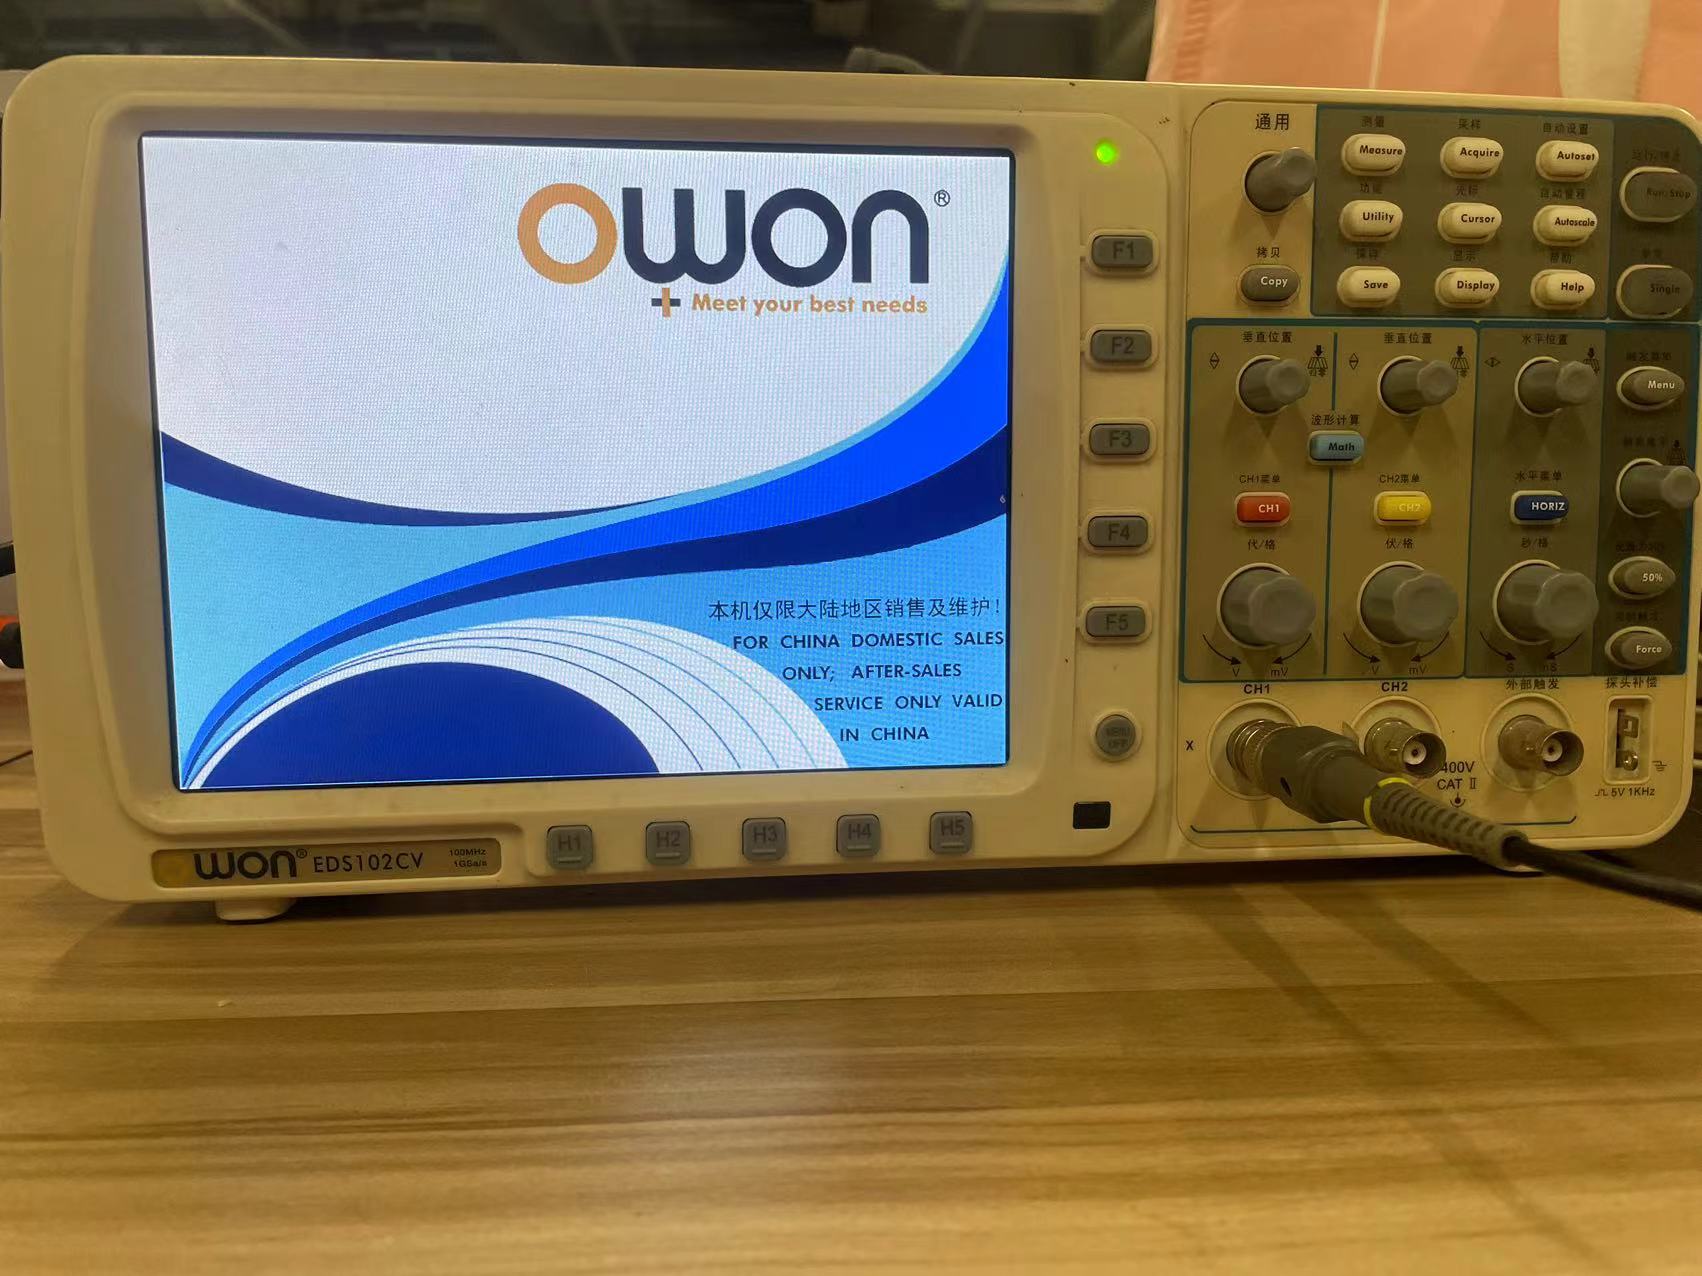
1. The oscilloscope we use is OWON EDS102CV
2. I read the instruction manual of this OWON EDS102CV
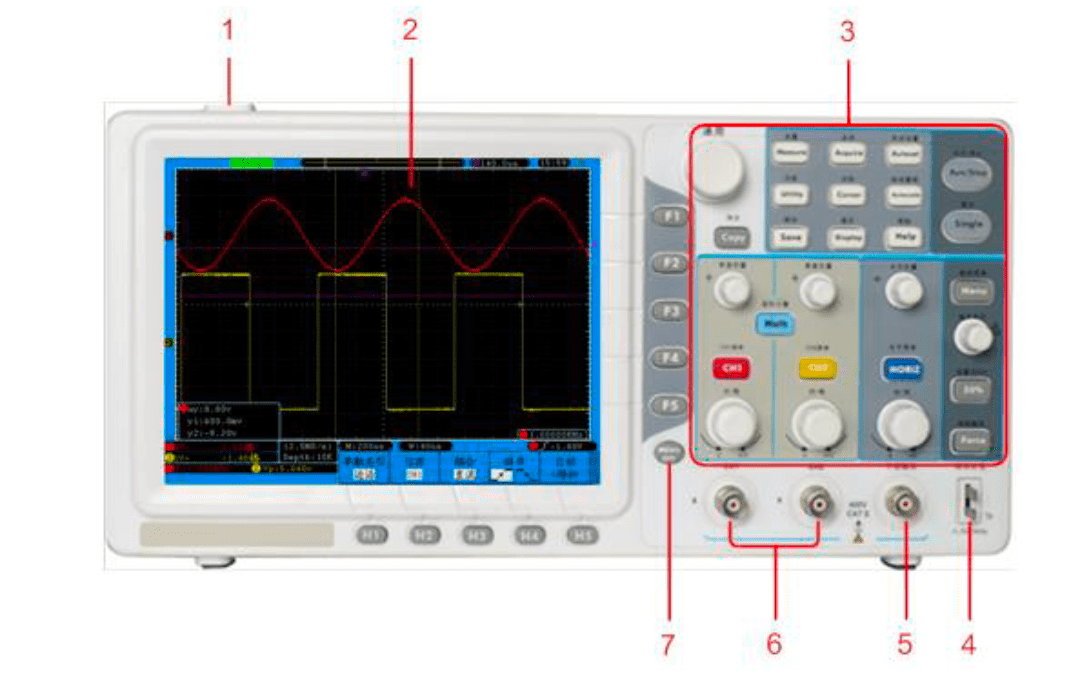
2.1 Font Panel is as below:
1. Oscilloscope switch2. Display area3. Keys and knob control area4. Probe compensation: 5V/1KHz signal output5. External trigger input6. Signal input port7. Menu close key
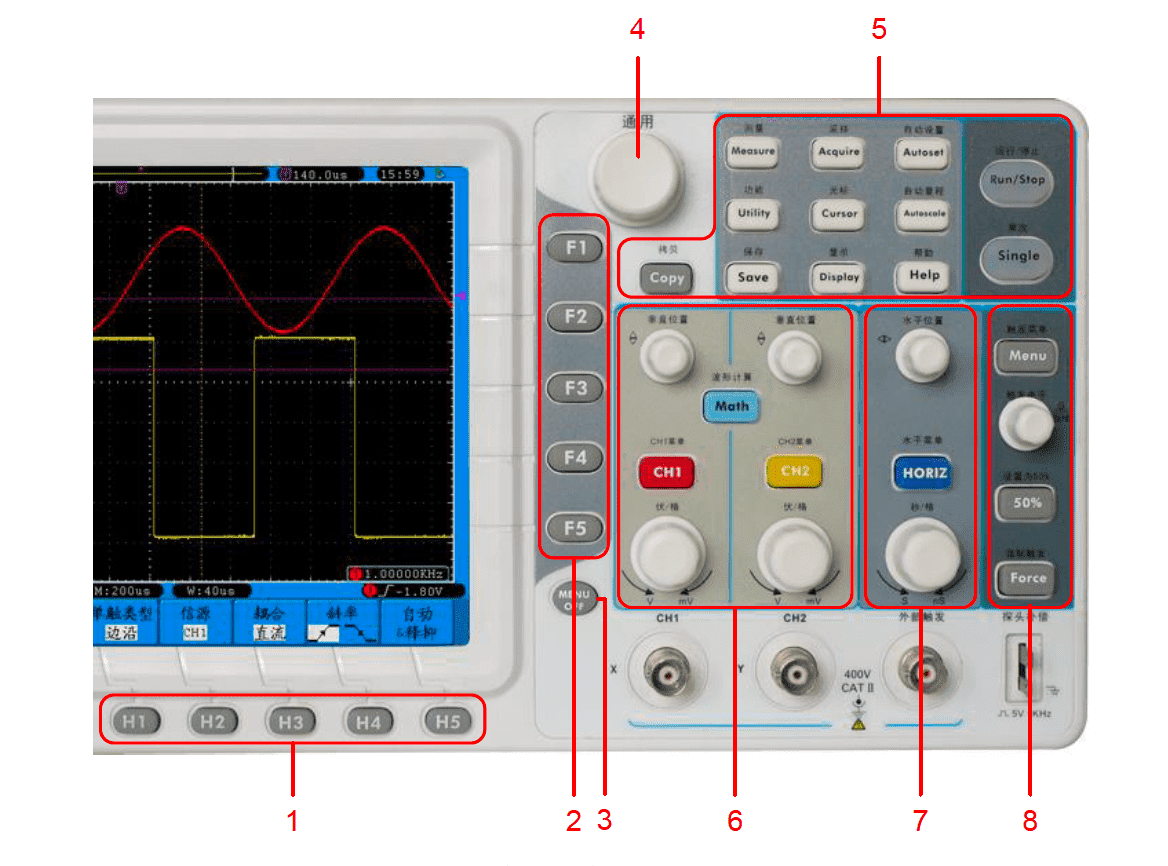
2.2 Key Control Area:
1. Horizontal menu option setting area, including 5 keys: H1 - H52. Vertical menu option setting area, including 5 keys: F1 - F53. Menu close key: Close the menu displayed on the current screen4. Universal knob: When the ○M mark appears in the on-screen menu, it indicates that the universal knob can be rotated to select the current menu or set the value; Pressing the knob can close the menu on the left side of the screen.5. Function key area: A total of 12 keys.6. Vertical control area: Includes three keys and four knobs. In the oscilloscope state, the "CH1 Menu" and "CH2 Menu" keys correspond to the setting menus of Channel 1 and Channel 2 respectively. The "Waveform Calculation" key corresponds to the waveform calculation menu. The operation menu includes operations such as addition, subtraction, multiplication, division, and FFT. The two "Vertical Position" knobs control the vertical displacement of Channel 1 and Channel 2 respectively. The two "Volts/Div" knobs control the voltage range of Channel 1 and Channel 2 respectively.7. Horizontal control area: Includes one key and two knobs. In the oscilloscope state, the "Horizontal Menu" key corresponds to the horizontal system setting menu. The "Horizontal Position" knob controls the horizontal position of the trigger, and the "Seconds/Div" knob controls the time base range.
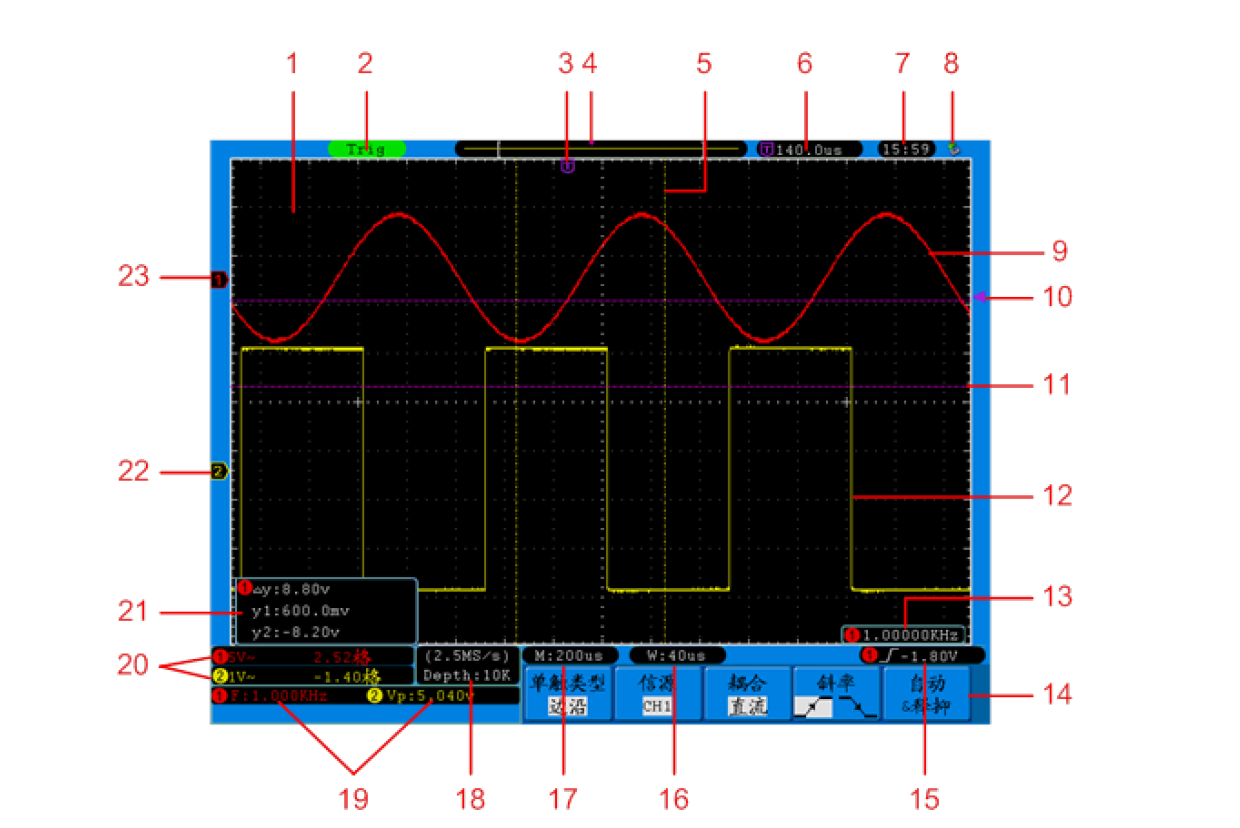
2.3 Preliminary understanding of the oscilloscope user interface
1. Waveform display area.2. Trigger status indication, with the following information types: Auto: The oscilloscope is in automatic mode and is collecting waveforms in the non-triggered state. Trig: The oscilloscope has detected a trigger and is collecting post-trigger information. Ready: All pre-trigger data has been acquired and the oscilloscope is ready to accept triggers. Scan: The oscilloscope continuously collects and displays waveform data in scan mode. Stop: The oscilloscope has stopped collecting waveform data.3. The purple pointer indicates the trigger level position, and the horizontal position control knob can adjust its position. 4. The pointer indicates the trigger position in the memory.5. Two yellow dotted lines indicate the size of the window expansion window.6. Indicates the value of the current trigger level position. Displays the position of the current waveform window in the memory. 7. Displays the time set by the system (please refer to Configuration on P 59).8. Indicates that a USB drive is currently inserted into the oscilloscope.9. Waveform of Channel 1.10. The purple pointer indicates the trigger level position of Channel 1.11. Two purple dotted lines indicate the position of cursor measurement.12. Waveform of Channel 2.13. Trigger frequency shows the frequency of the Channel 1 signal.14. Indicates the operation options of the current function menu. Different function menus have different displays.15. ① The icon indicates the trigger type selected for the corresponding channel:. Rising edge trigger. Falling edge trigger. Video line sync trigger. pVideo field sync trigger.② The reading indicates the value of the trigger level of the corresponding channel16. The reading indicates the set value of the time base for window expansion when the window is set.17. The reading indicates the set value of the main time base.18. Current sampling rate and memory depth.19. Displays the measurement items and measurement values of the corresponding channels. Among them, F indicates frequency, T indicates period, V indicates average value, Vp indicates peak-to-peak value, Vk indicates root mean square value, Ma indicates maximum value, Mi indicates minimum value, Vt indicates top value, Vb indicates bottom value, Va indicates amplitude, Os indicates overshoot, Ps indicates undershoot, RT indicates rise time, FT indicates fall time, PW indicates positive pulse width, NW indicates negative pulse width, +D indicates positive duty cycle, -D indicates negative duty cycle, PD indicates delay A->B, ND indicates delay A->B, TR indicates period root mean square, CR indicates cursor root mean square, WP indicates working cycle, RP indicates phase.20. ① The readings respectively indicate the voltage range and zero point position of the corresponding channel..② The icon indicates the coupling mode of the channel:."--" indicates DC coupling."~" indicates AC coupling."" indicates ground coupling. The reading indicates21. Cursor measurement window, showing the absolute values of the two cursors and the readings of the two cursors.22. The yellow pointer indicates the ground reference point (zero point position) of the waveform displayed by the CH2 channel. If there is no pointer indicating the channel, it means that the channel is not turned on.23. The red pointer indicates the ground reference point (zero point position) of the waveform displayed by the CH1 channel. If there is no pointer indicating the channel, it means that the channel is not turned on.
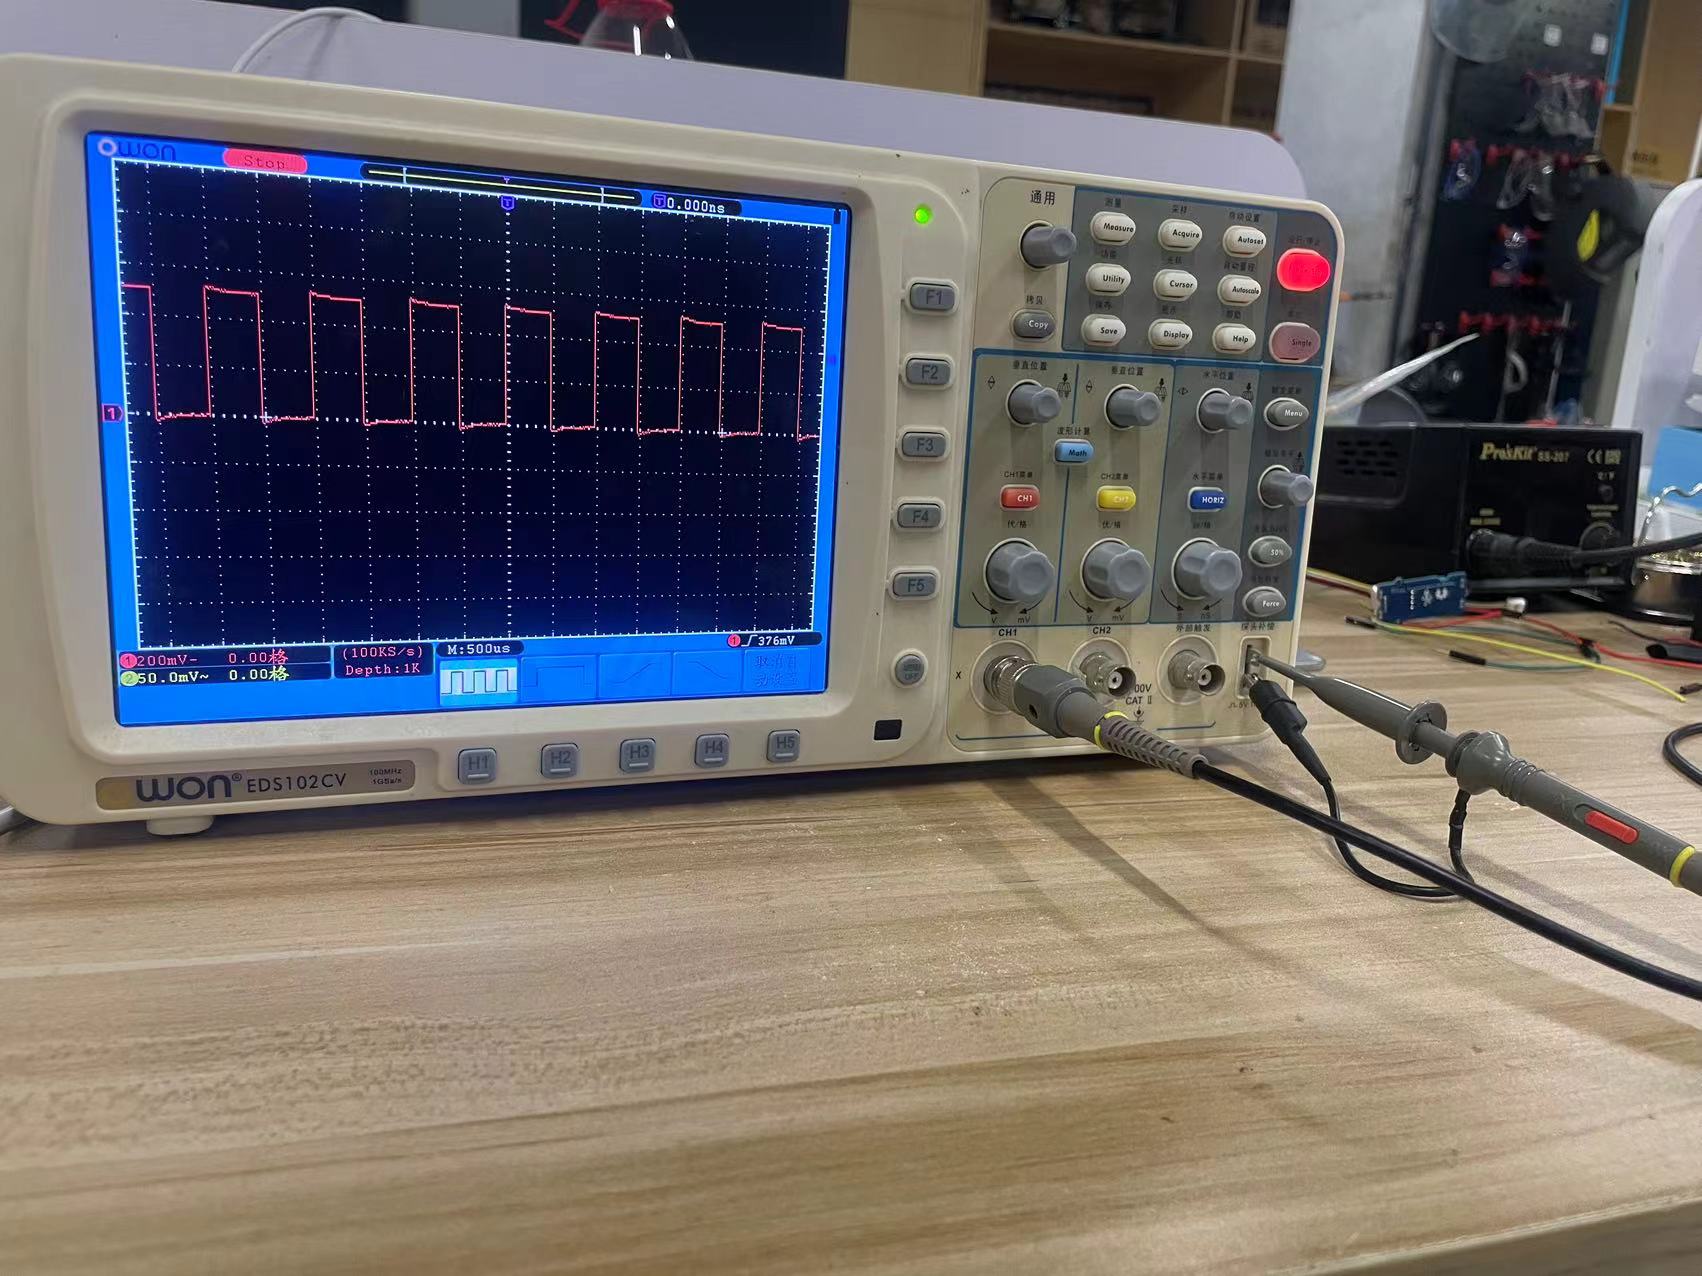
3. Conduct a functional check
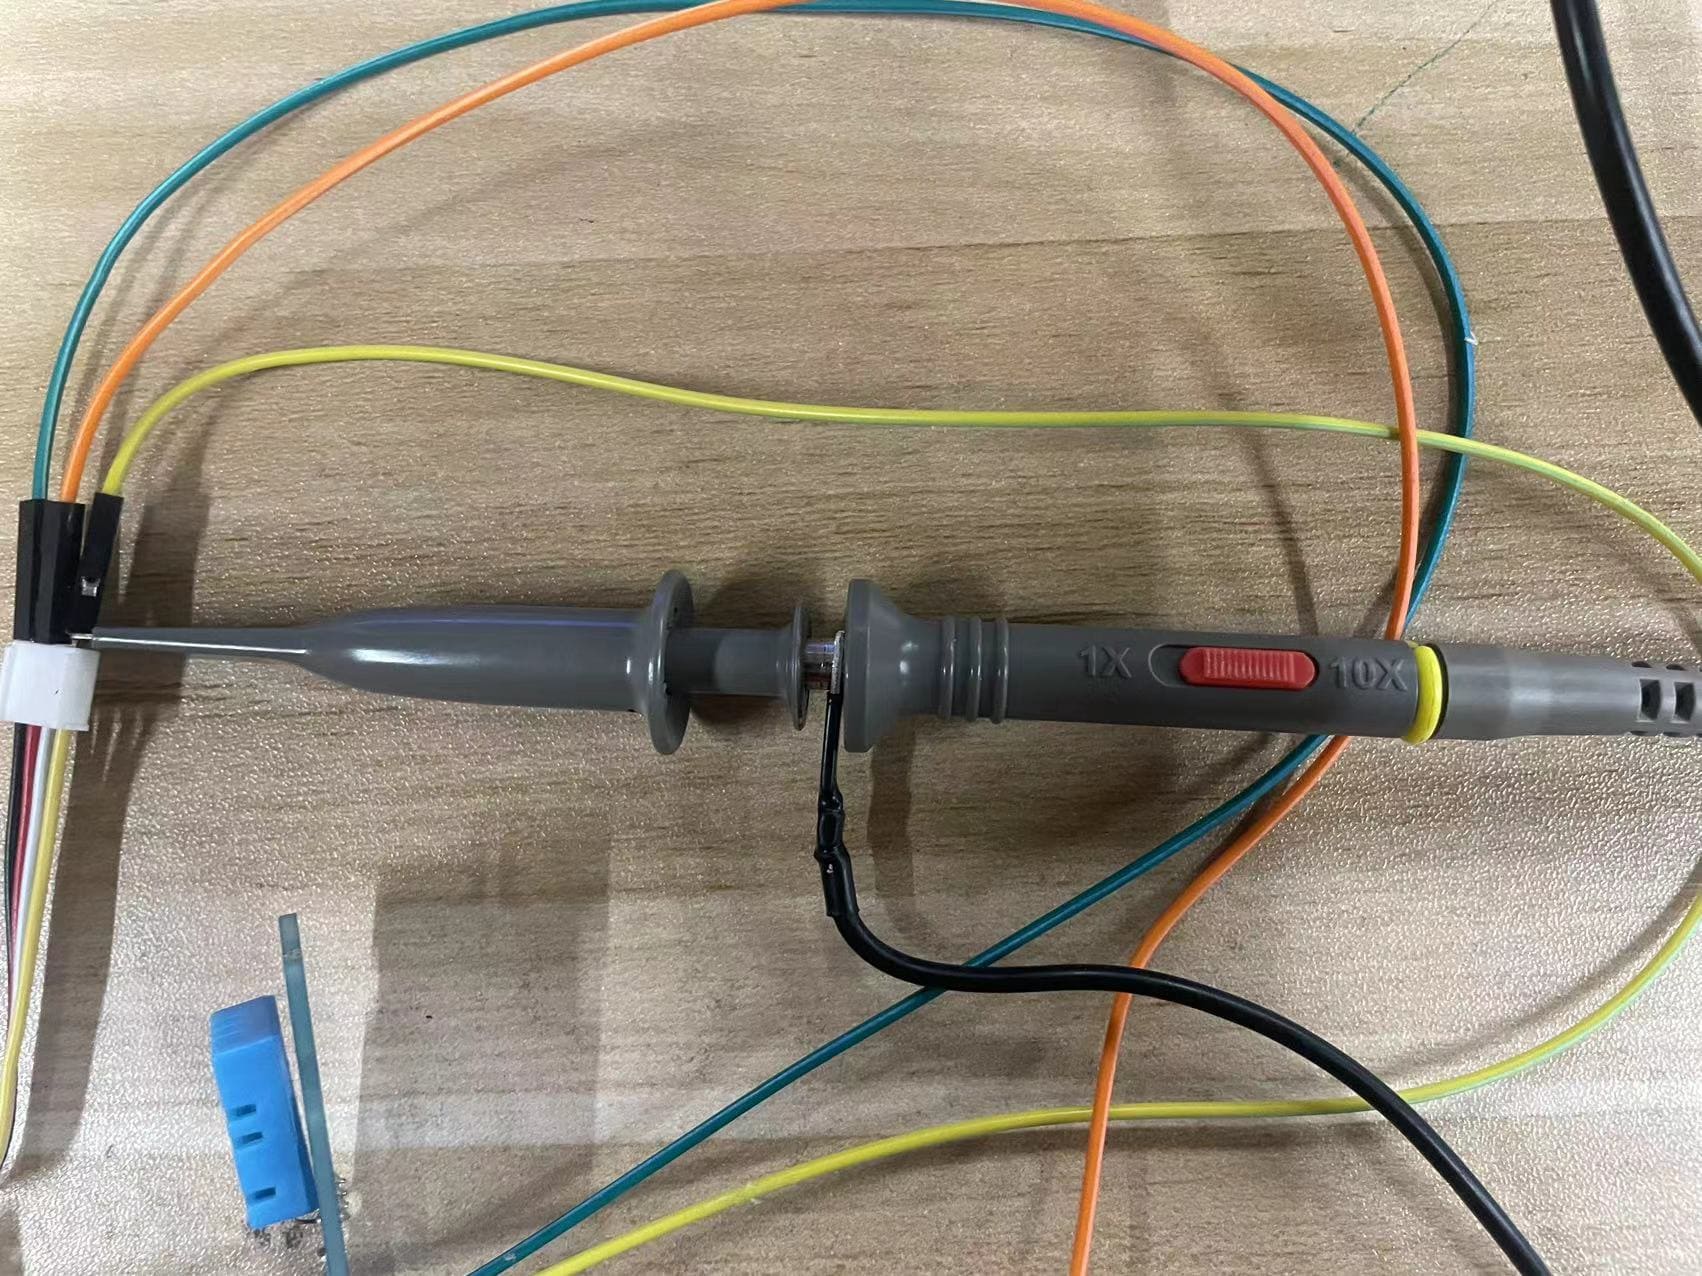
1. Switch on the power of the instrument and press the oscilloscope power key on the top of the main unit. A slight clicking sound will be heard from the relay inside. The instrument performs all self-check items and the startup screen appears. Press the Utility (function key), then press the H1 menu selection key to display the function menu. Rotate the universal knob to select "Calibration" and press the H3 key to select the manufacturer settings. The default attenuation coefficient setting value of the probe menu is 10X. 2. Set the switch on the oscilloscope probe to 10X and connect the oscilloscope probe to the CH1 channel. Align the slot on the probe with the plug on the coaxial cable connector (BNC) of the CH1 connector and insert it. Then rotate it to the right and tighten the probe. Connect the end of the probe and the grounding clip to the connector of the probe compensator. 3. Press the "Auto Setup" key. Within a few seconds, a square wave display (1KHz frequency, 5V) can be seen.It seems to be overcompensated, but we haven't found the small pin for adjusting the compensation.
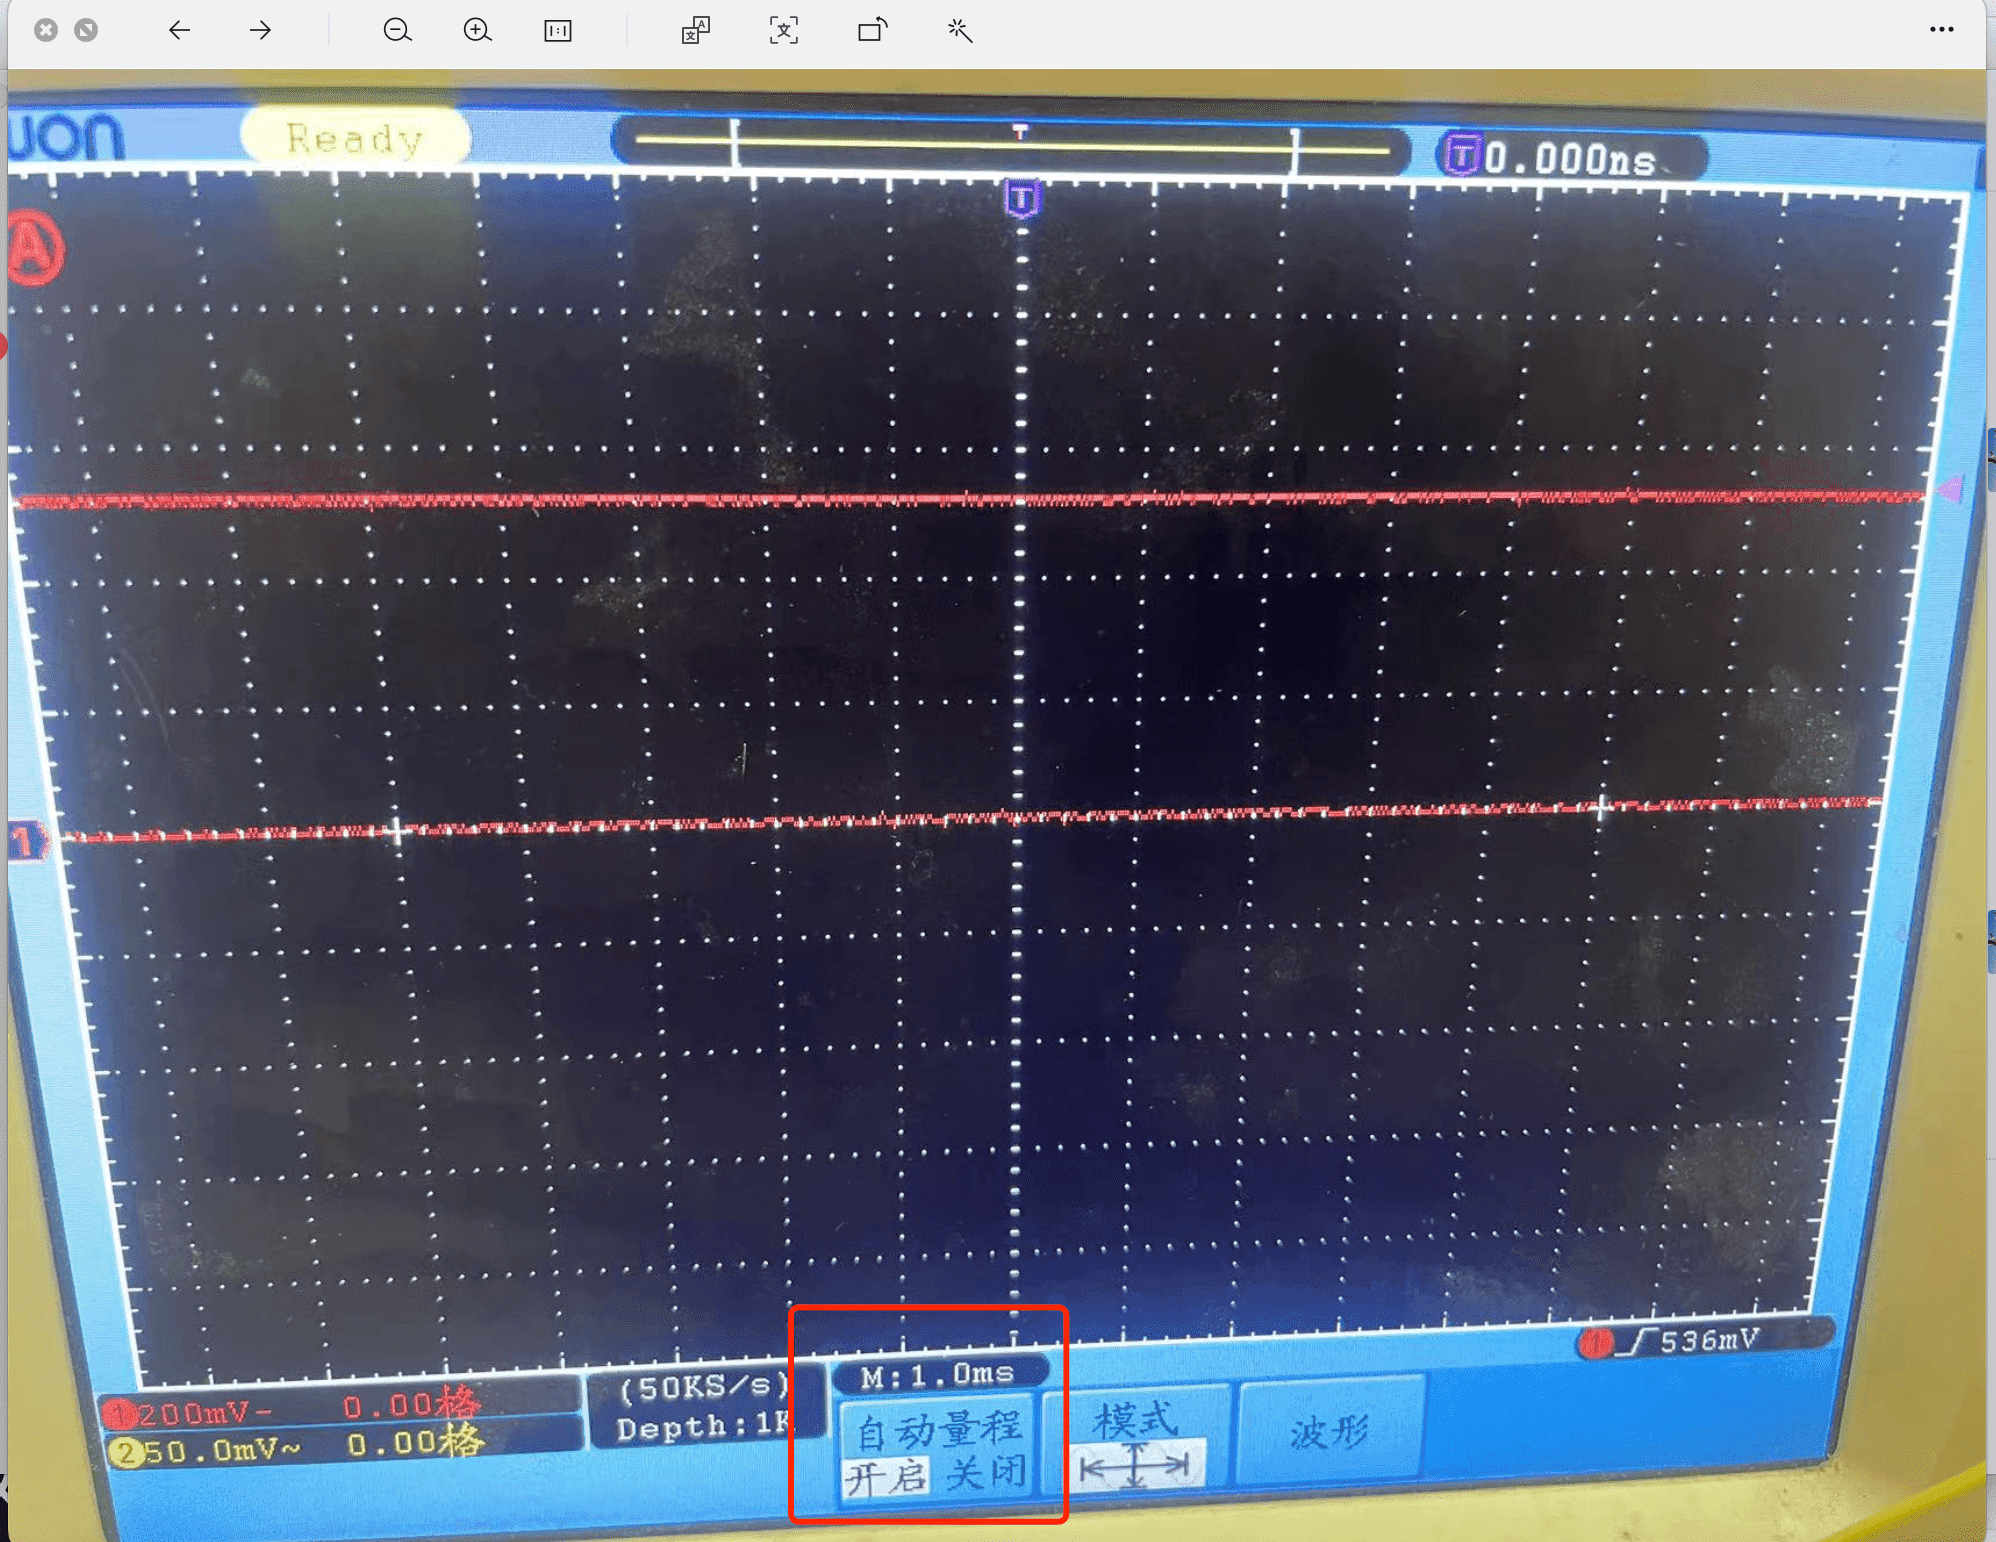
Part2. Probe the DHT11's Digital Signal
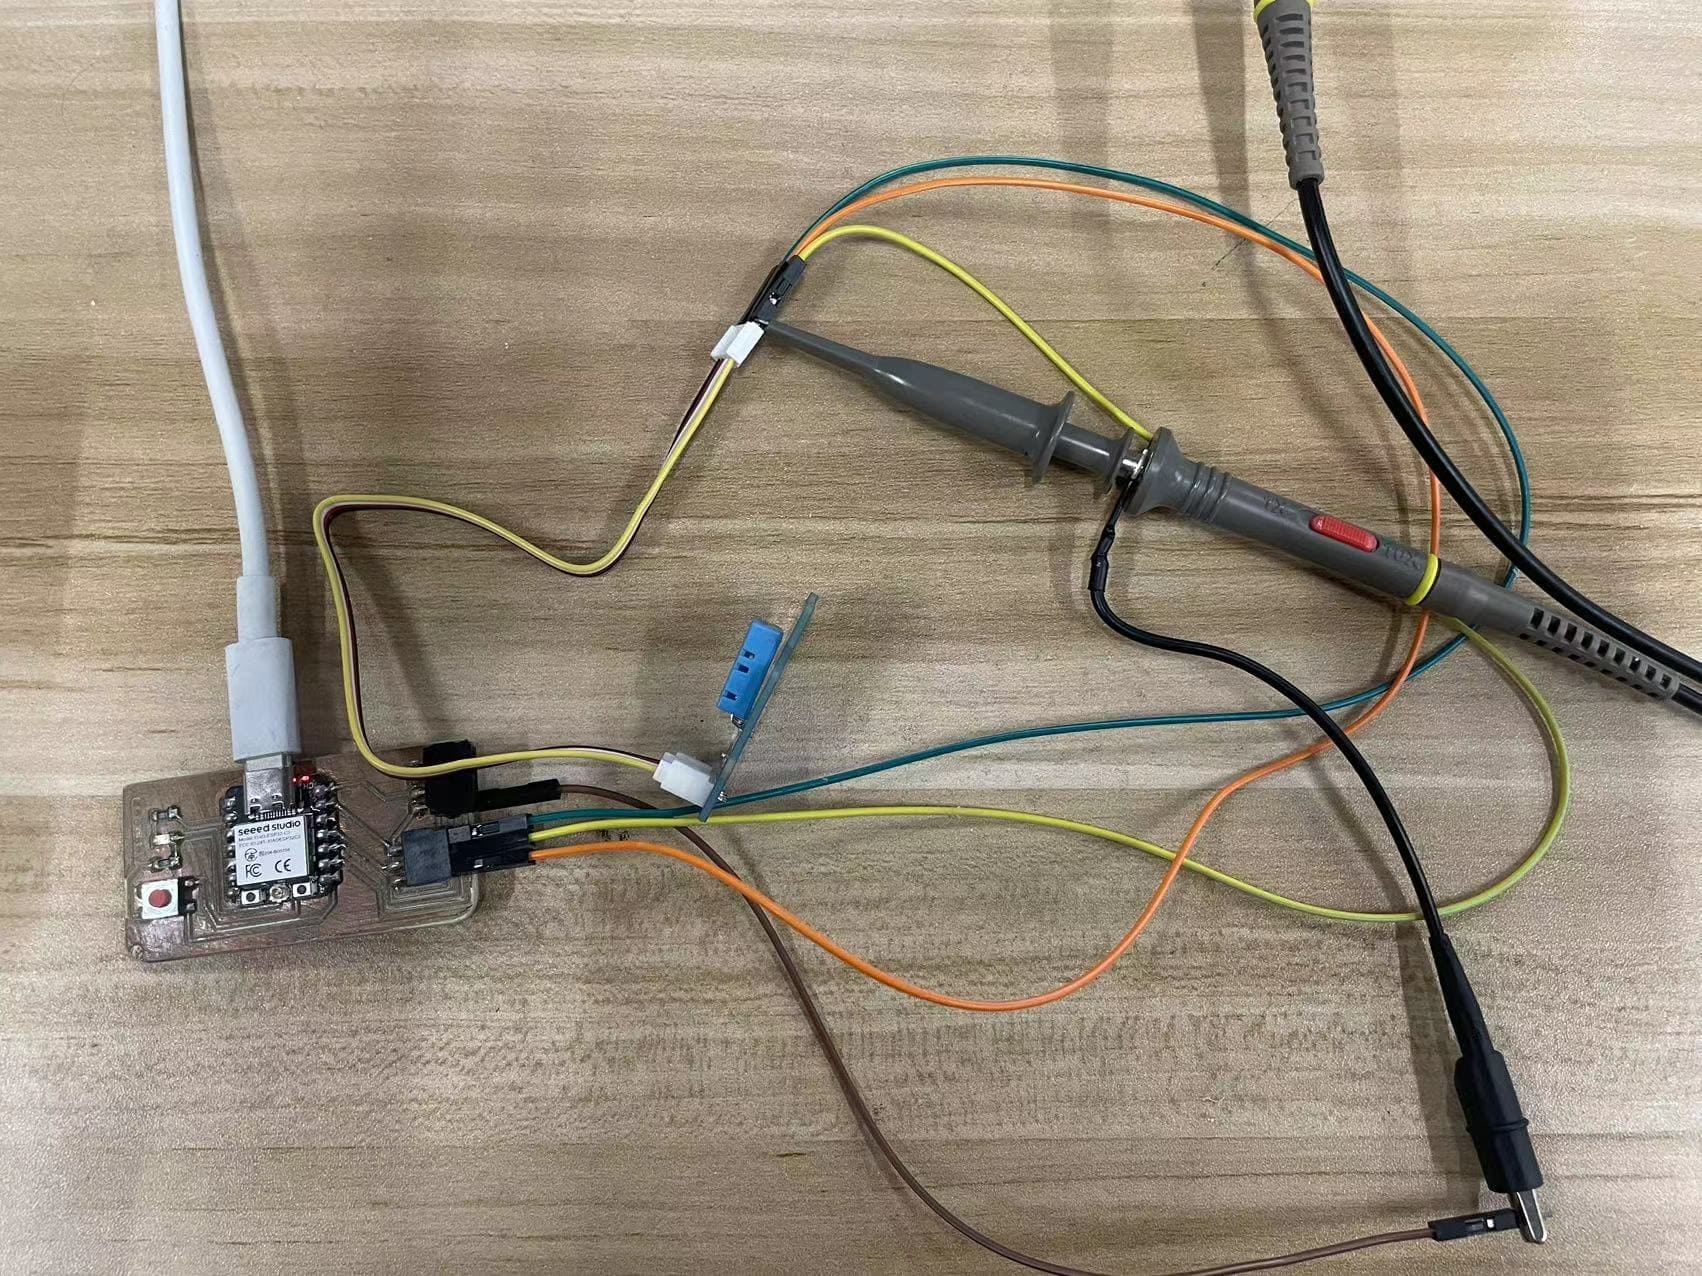
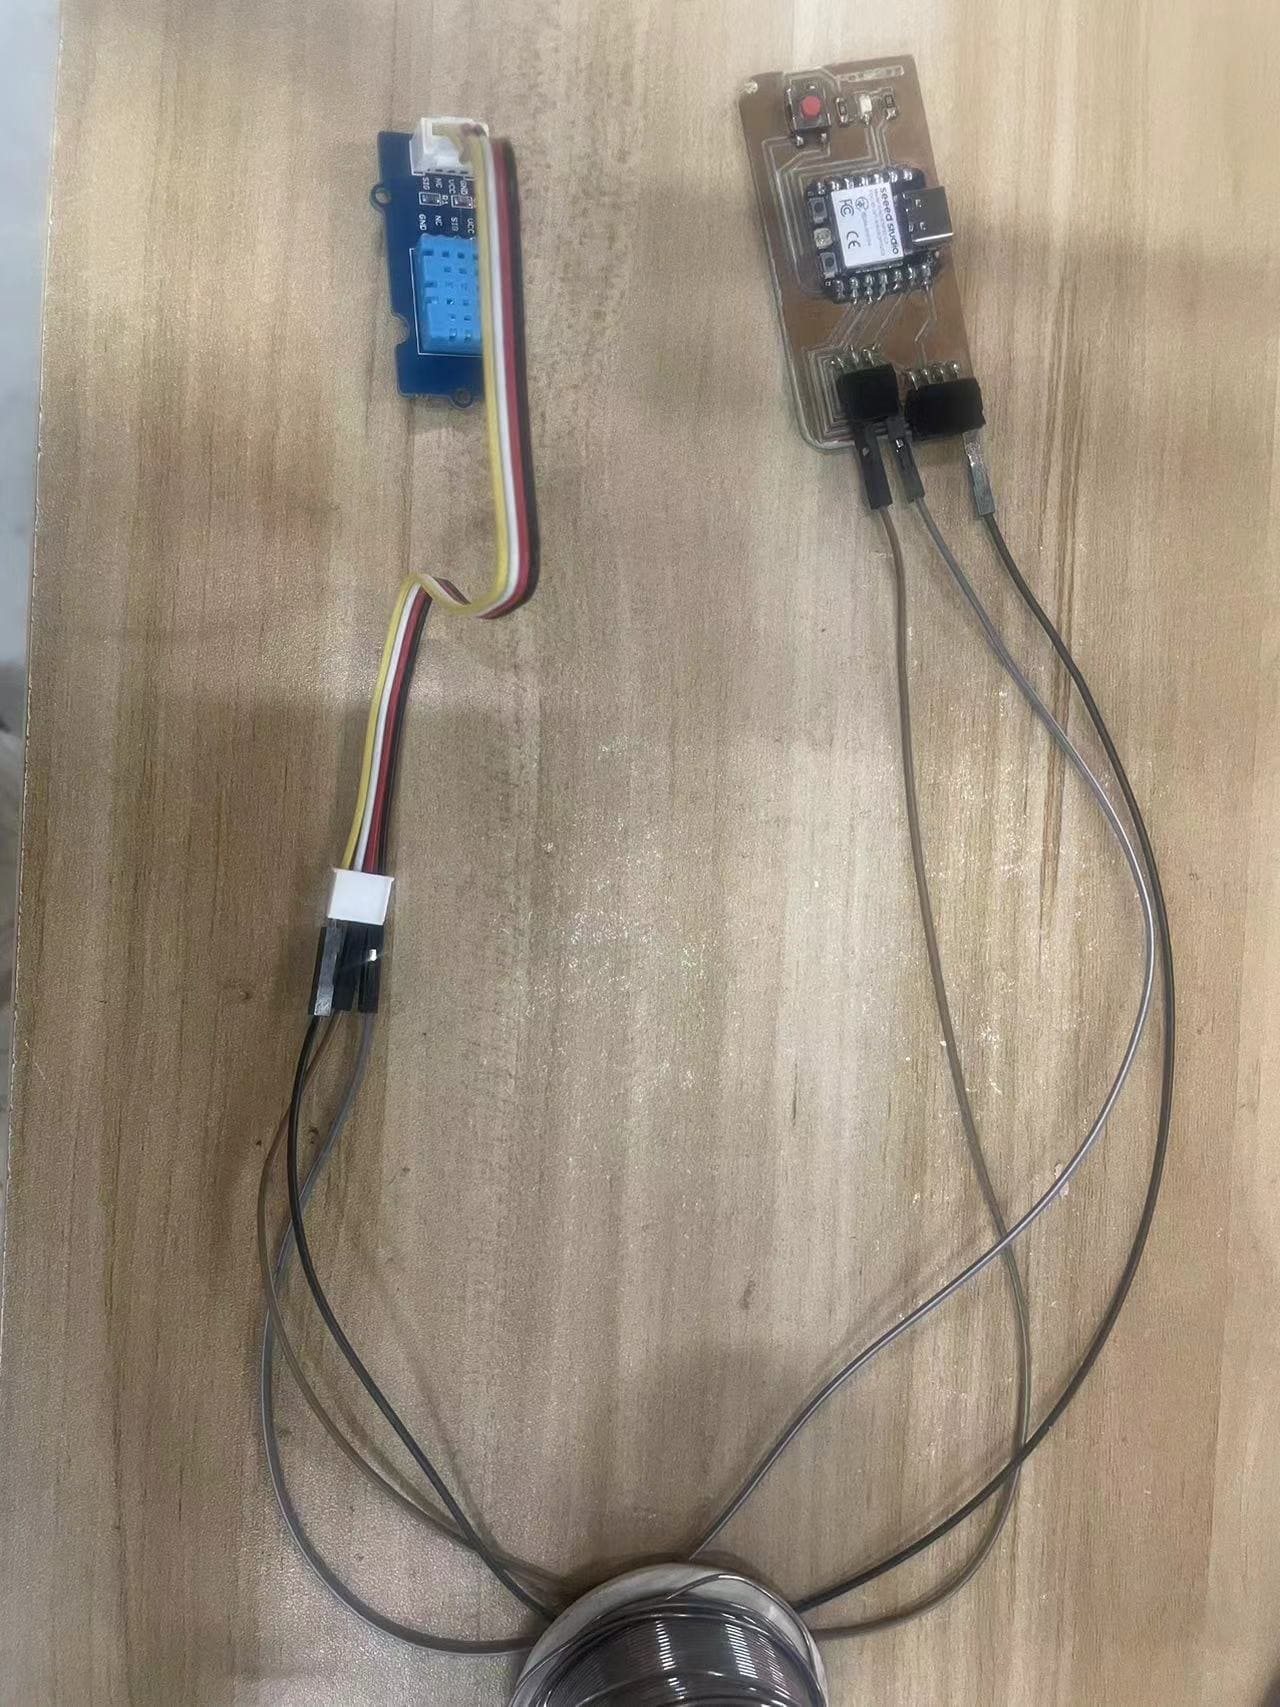
Step1. Connect the probe to the CH1 channel, and clamp the ground wire to the ground terminal interface of the board. Hook the signal wire to the data port of the DHT11.
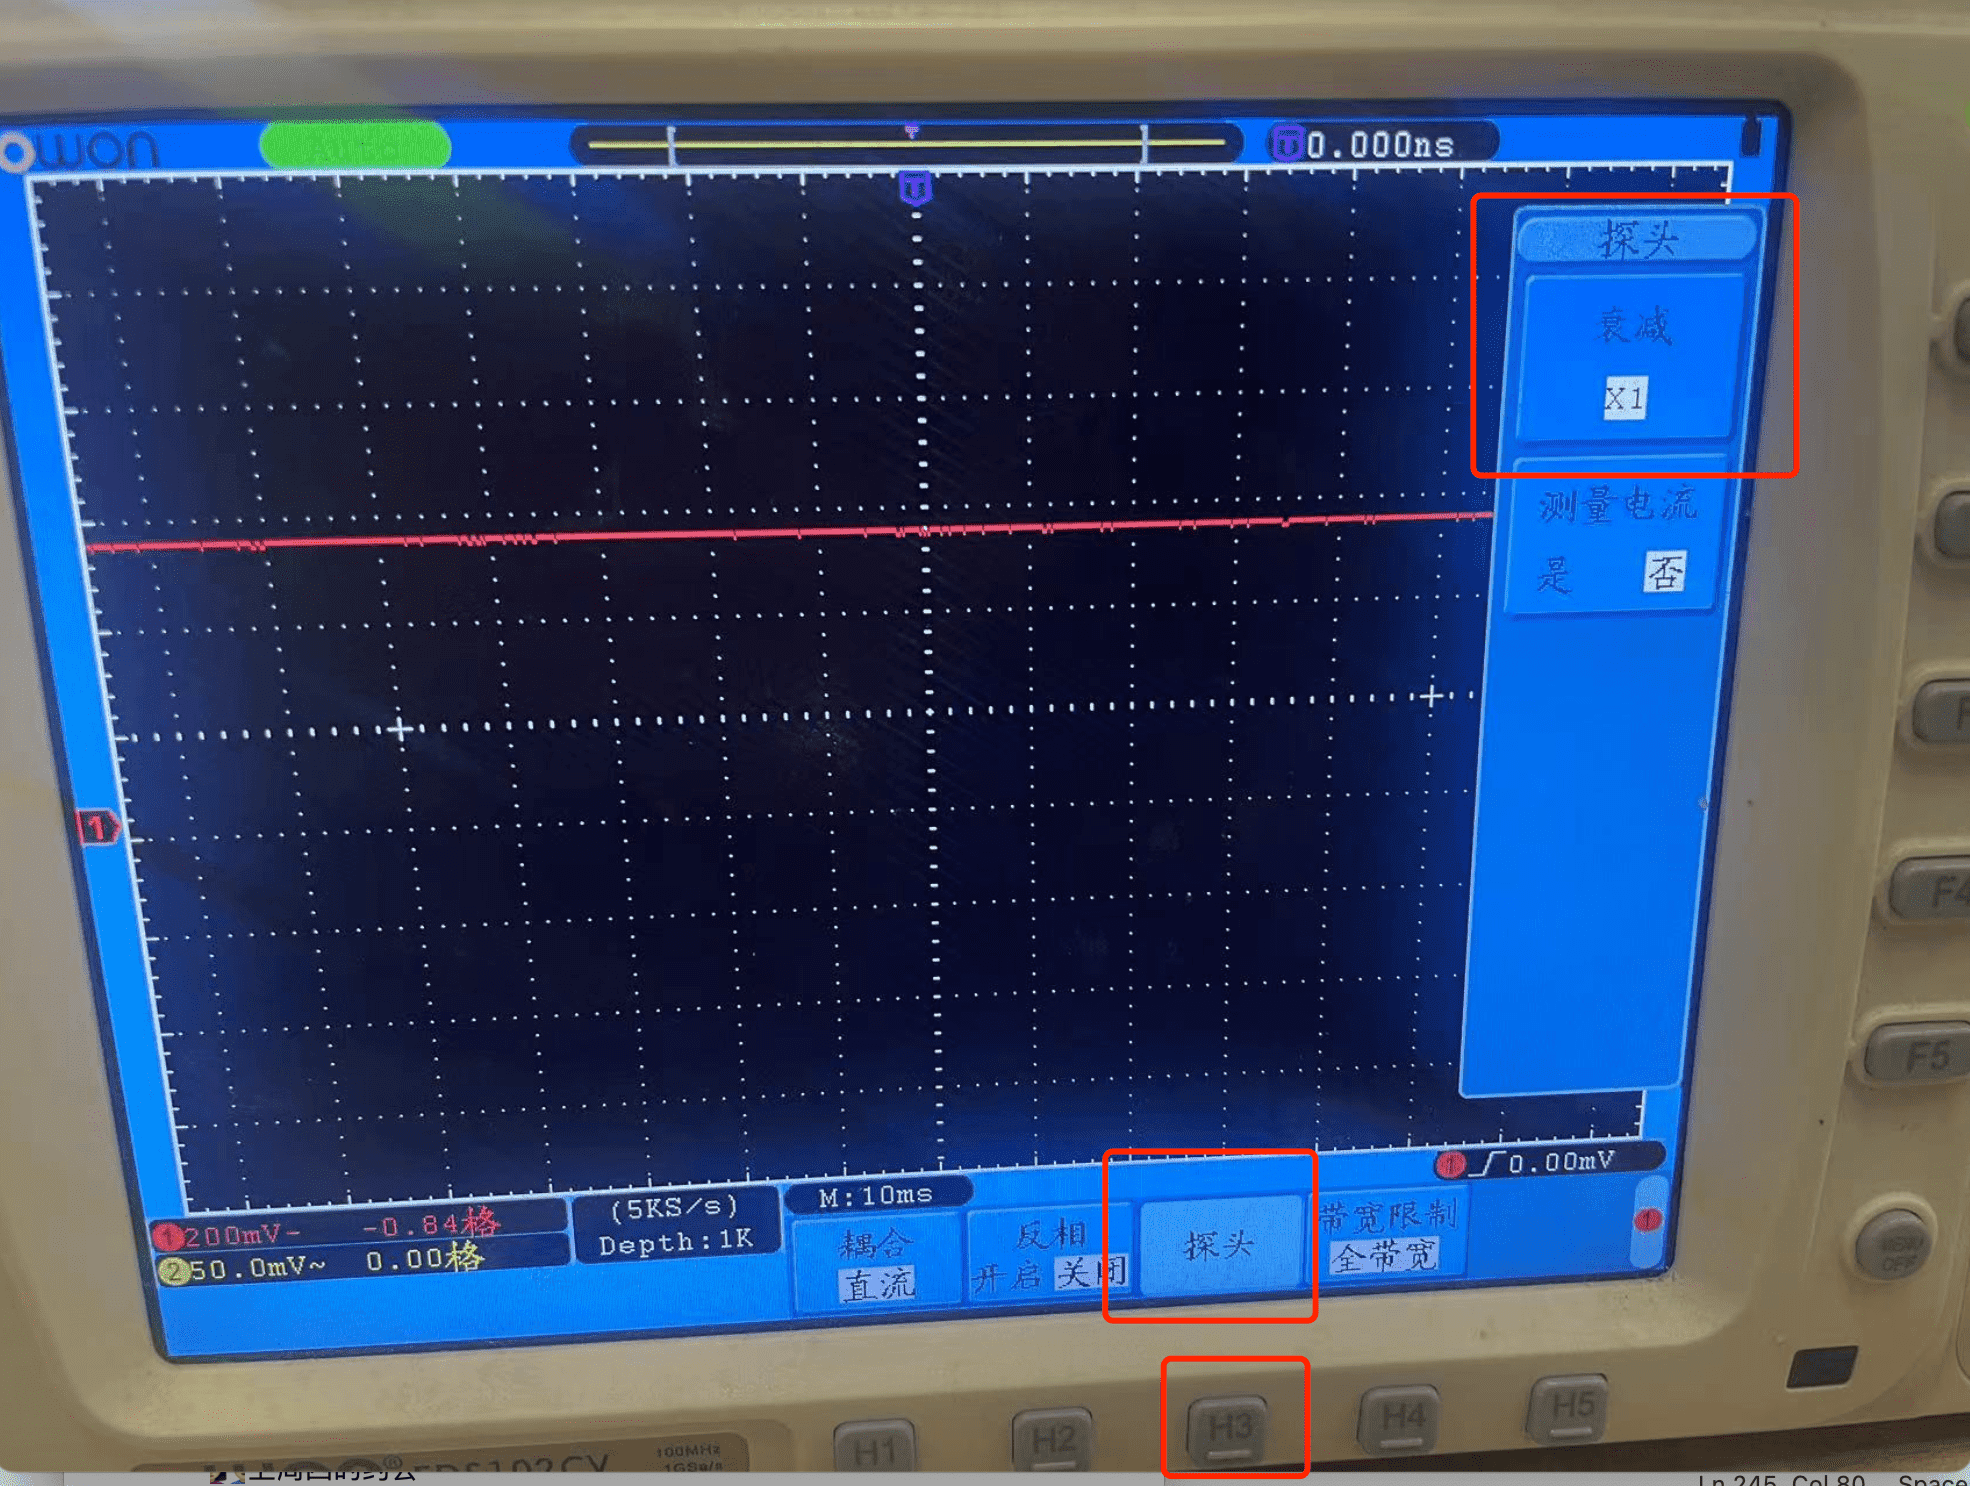
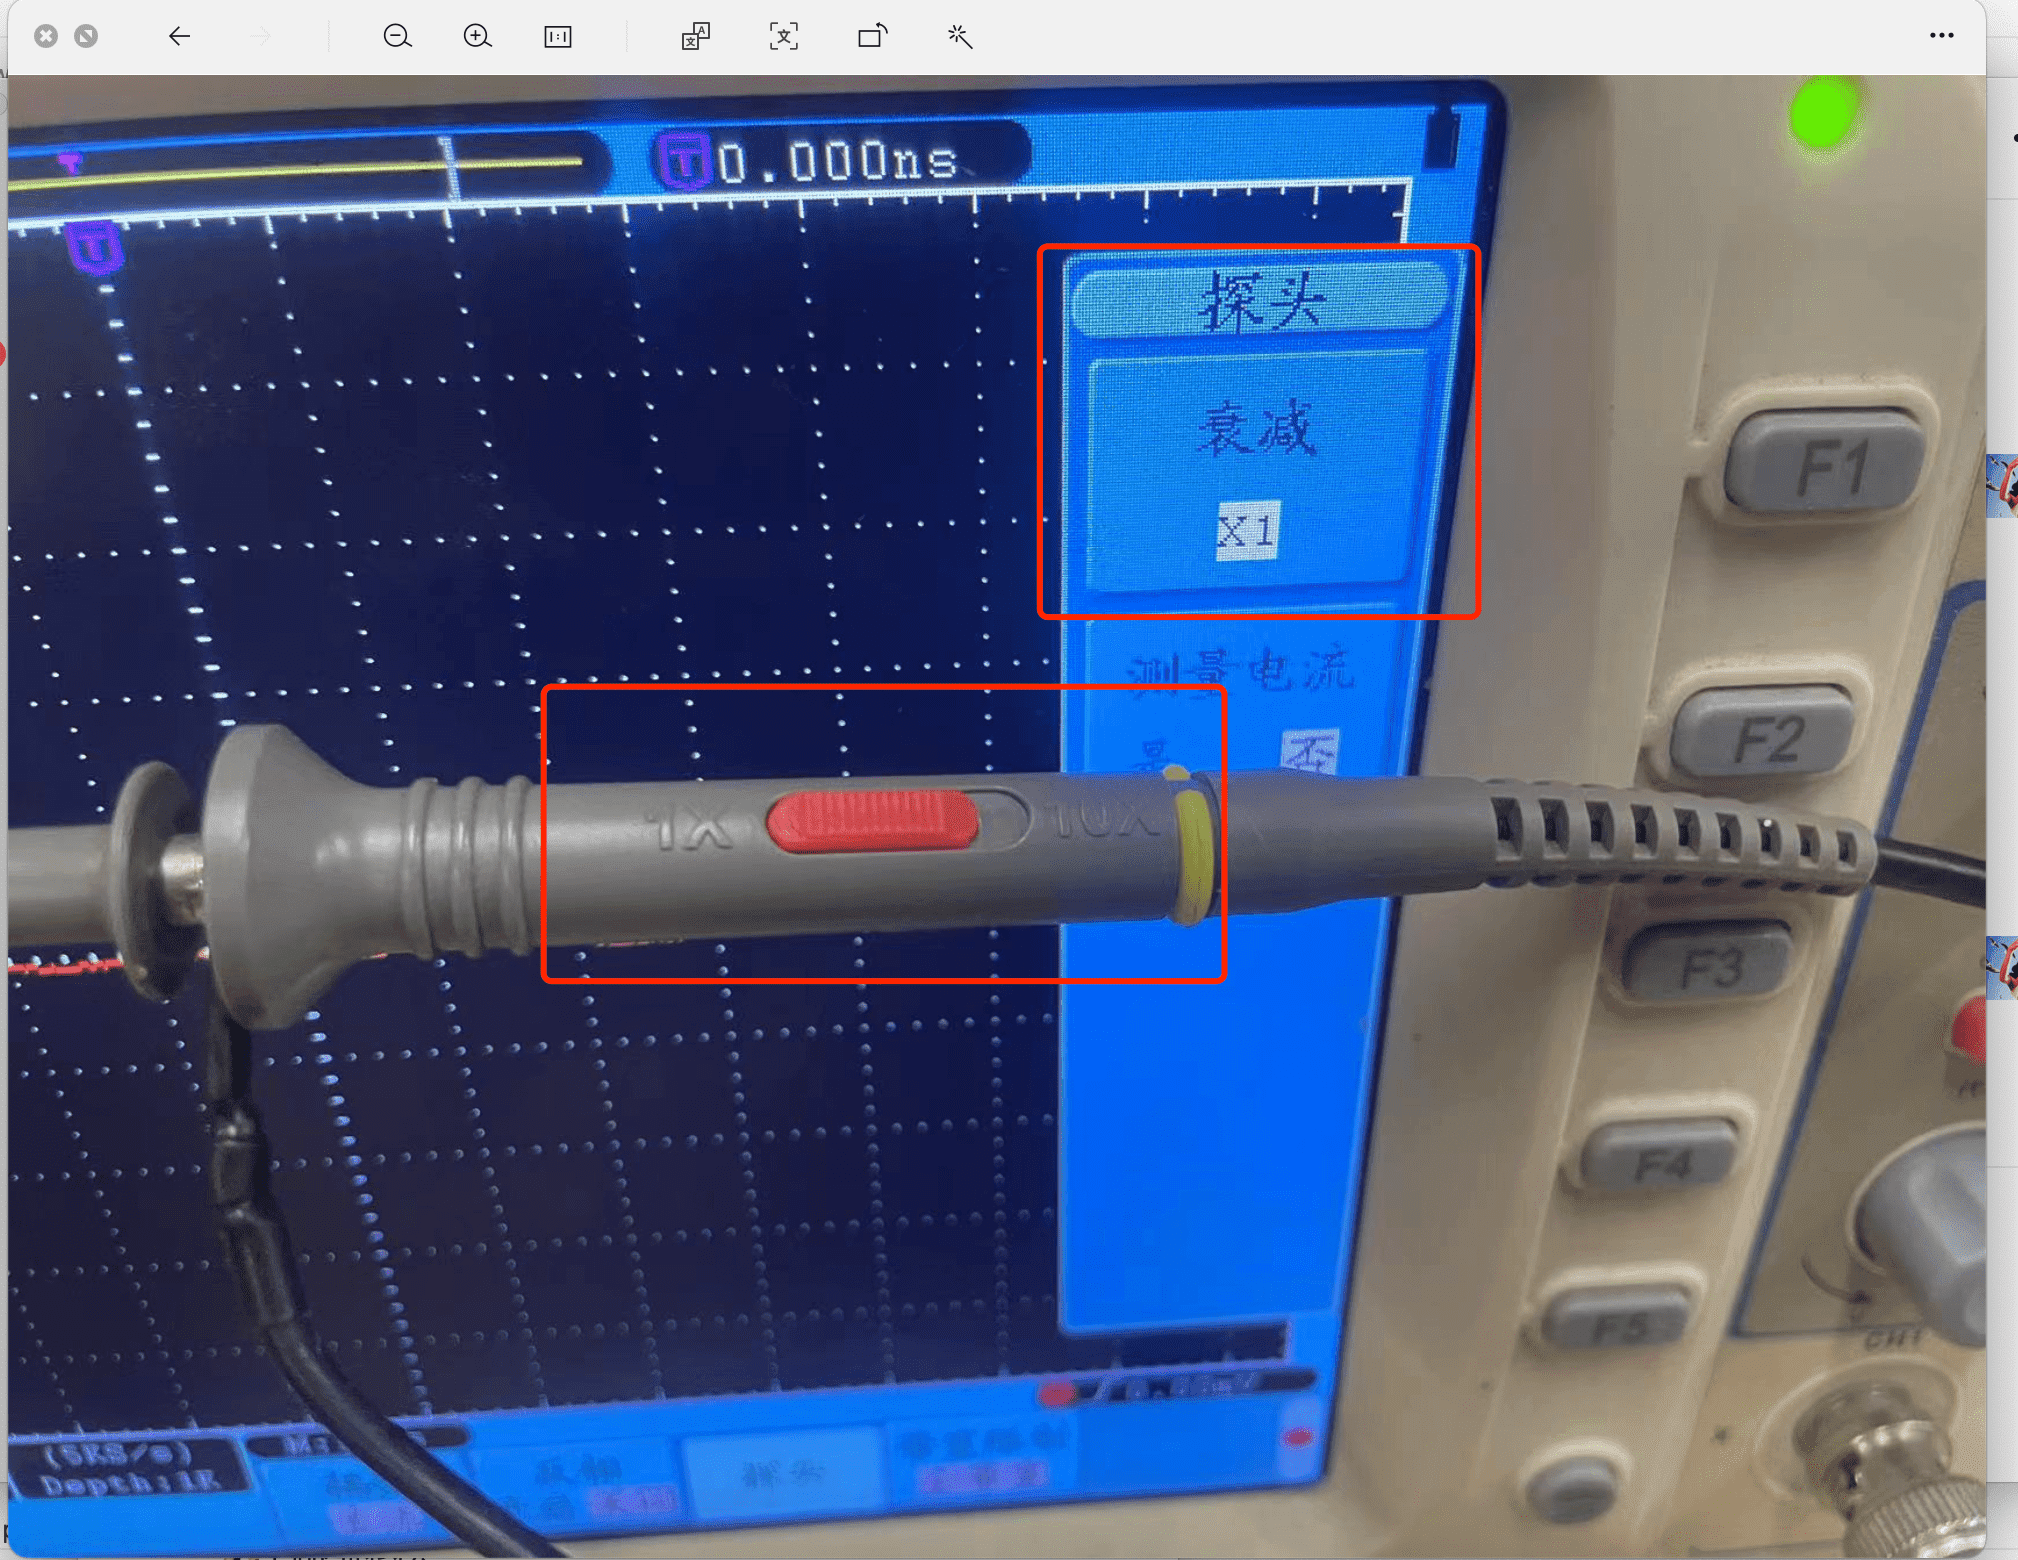
Step2. Set the attenuation coefficient of the probe menu to 10X
Step3. Press the autoSet on the panel to check settings of the wave
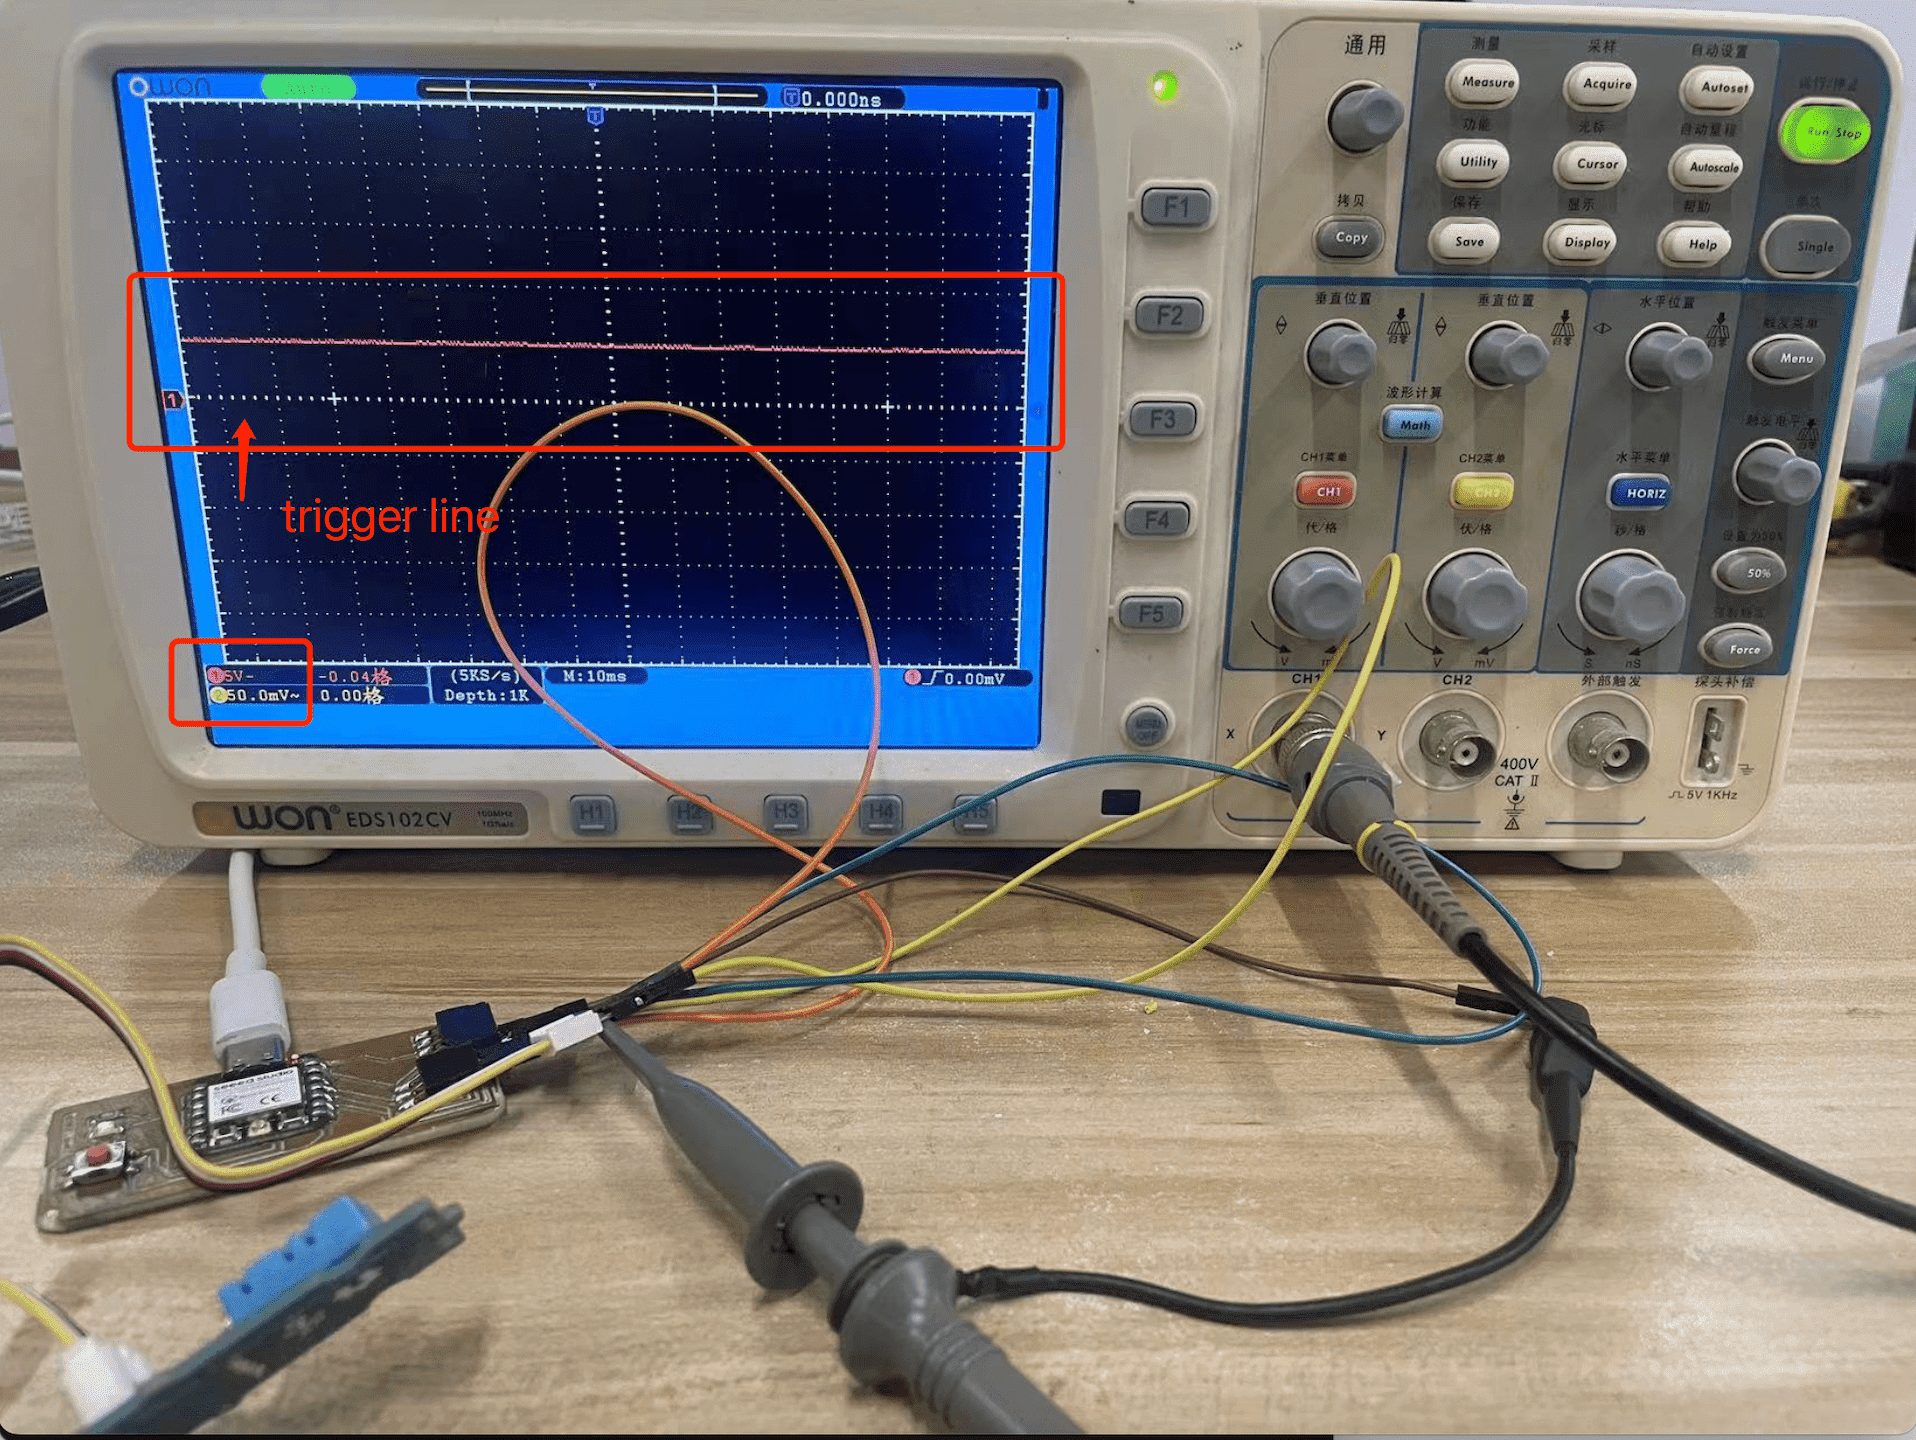
Step4. Get the Wave
So we are getting signles at around 0.5V every 2 seconds!
Part3. Probe the DHT11's analog level
For the analog signal, I tested the input voltage of the DHT11 sensor
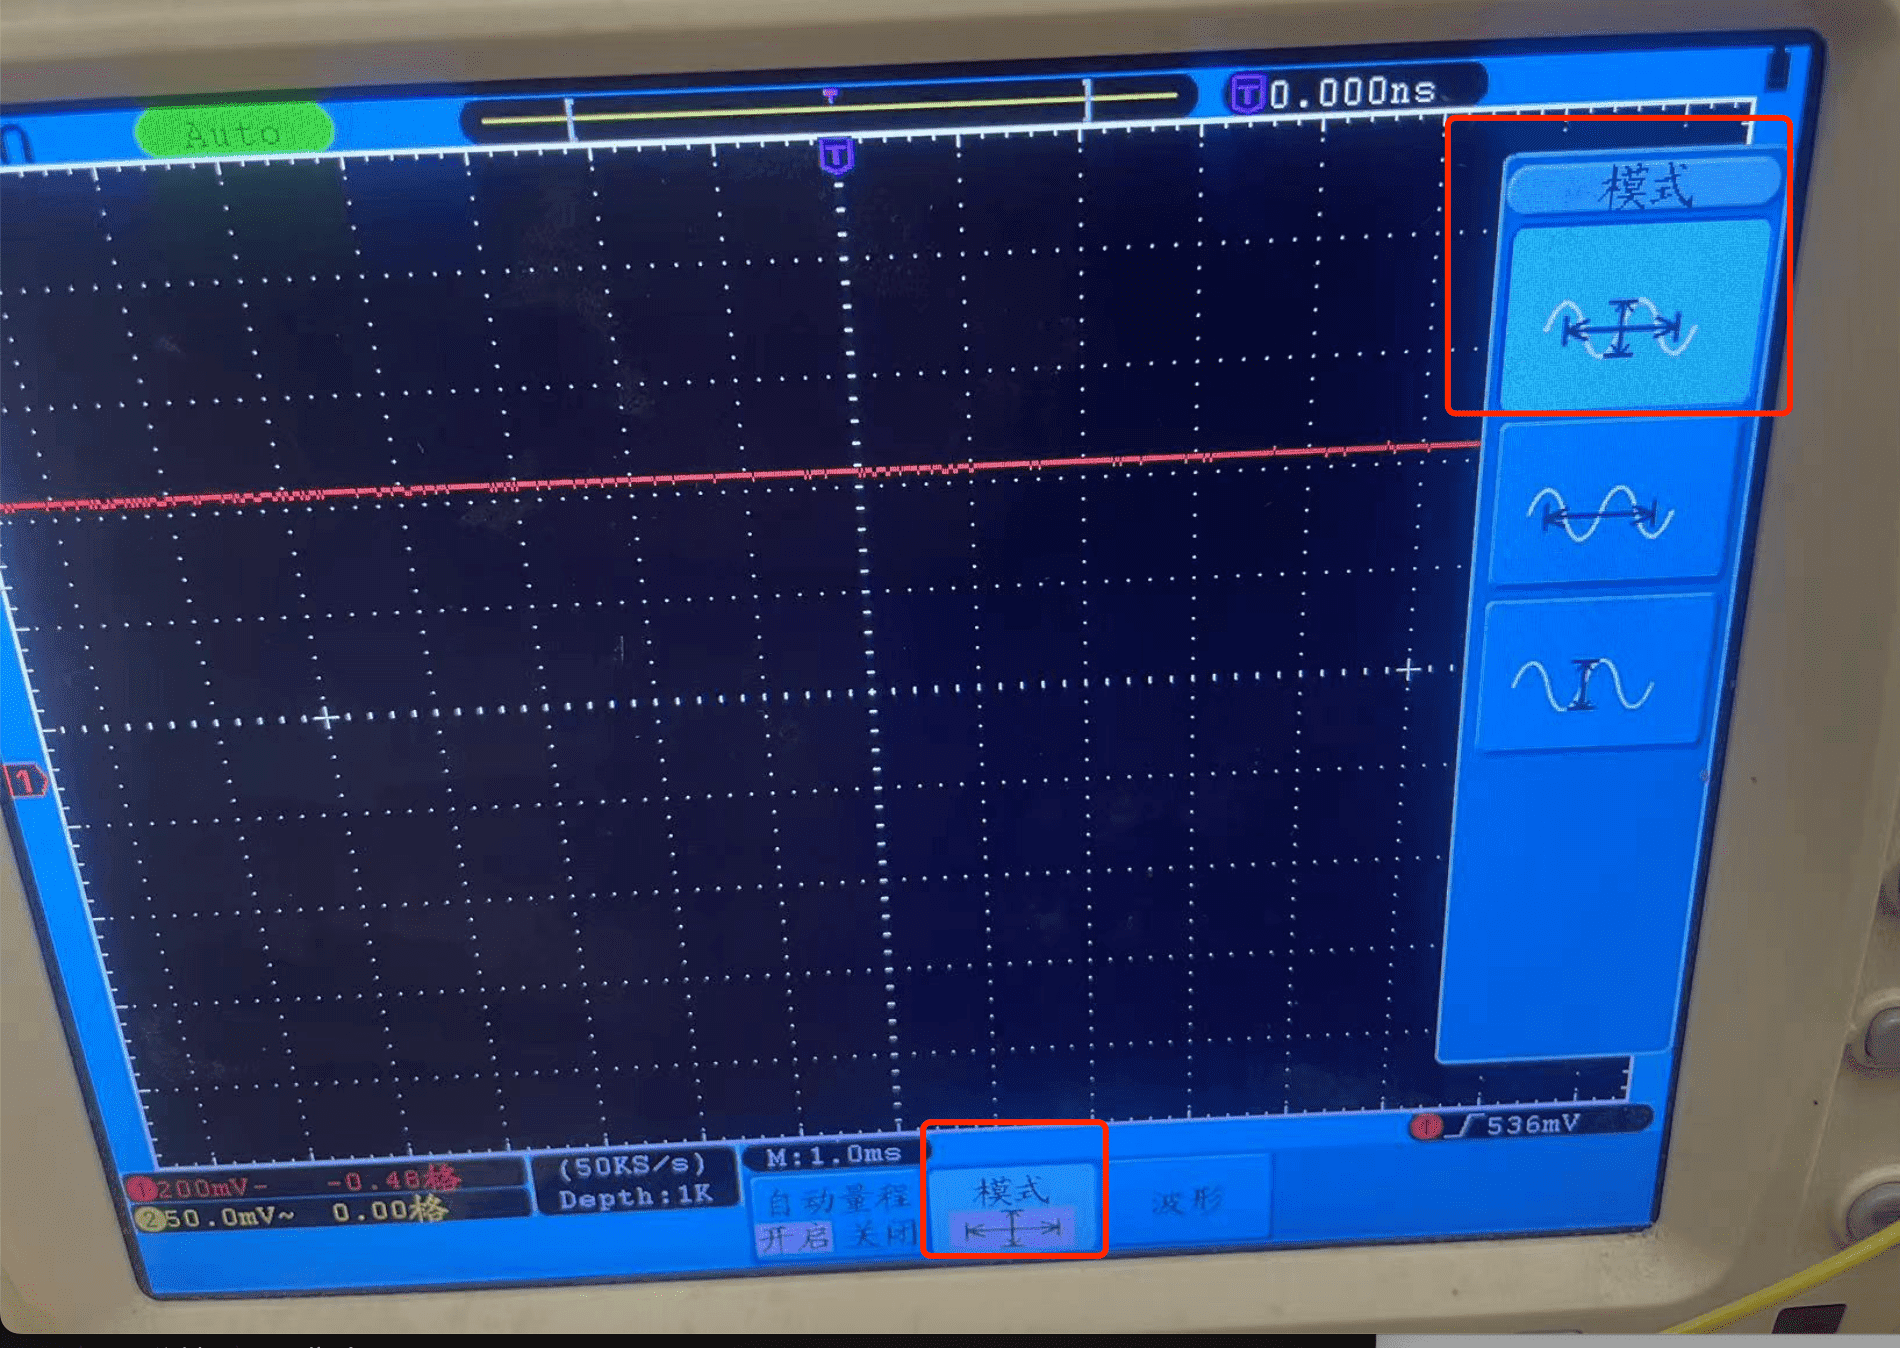
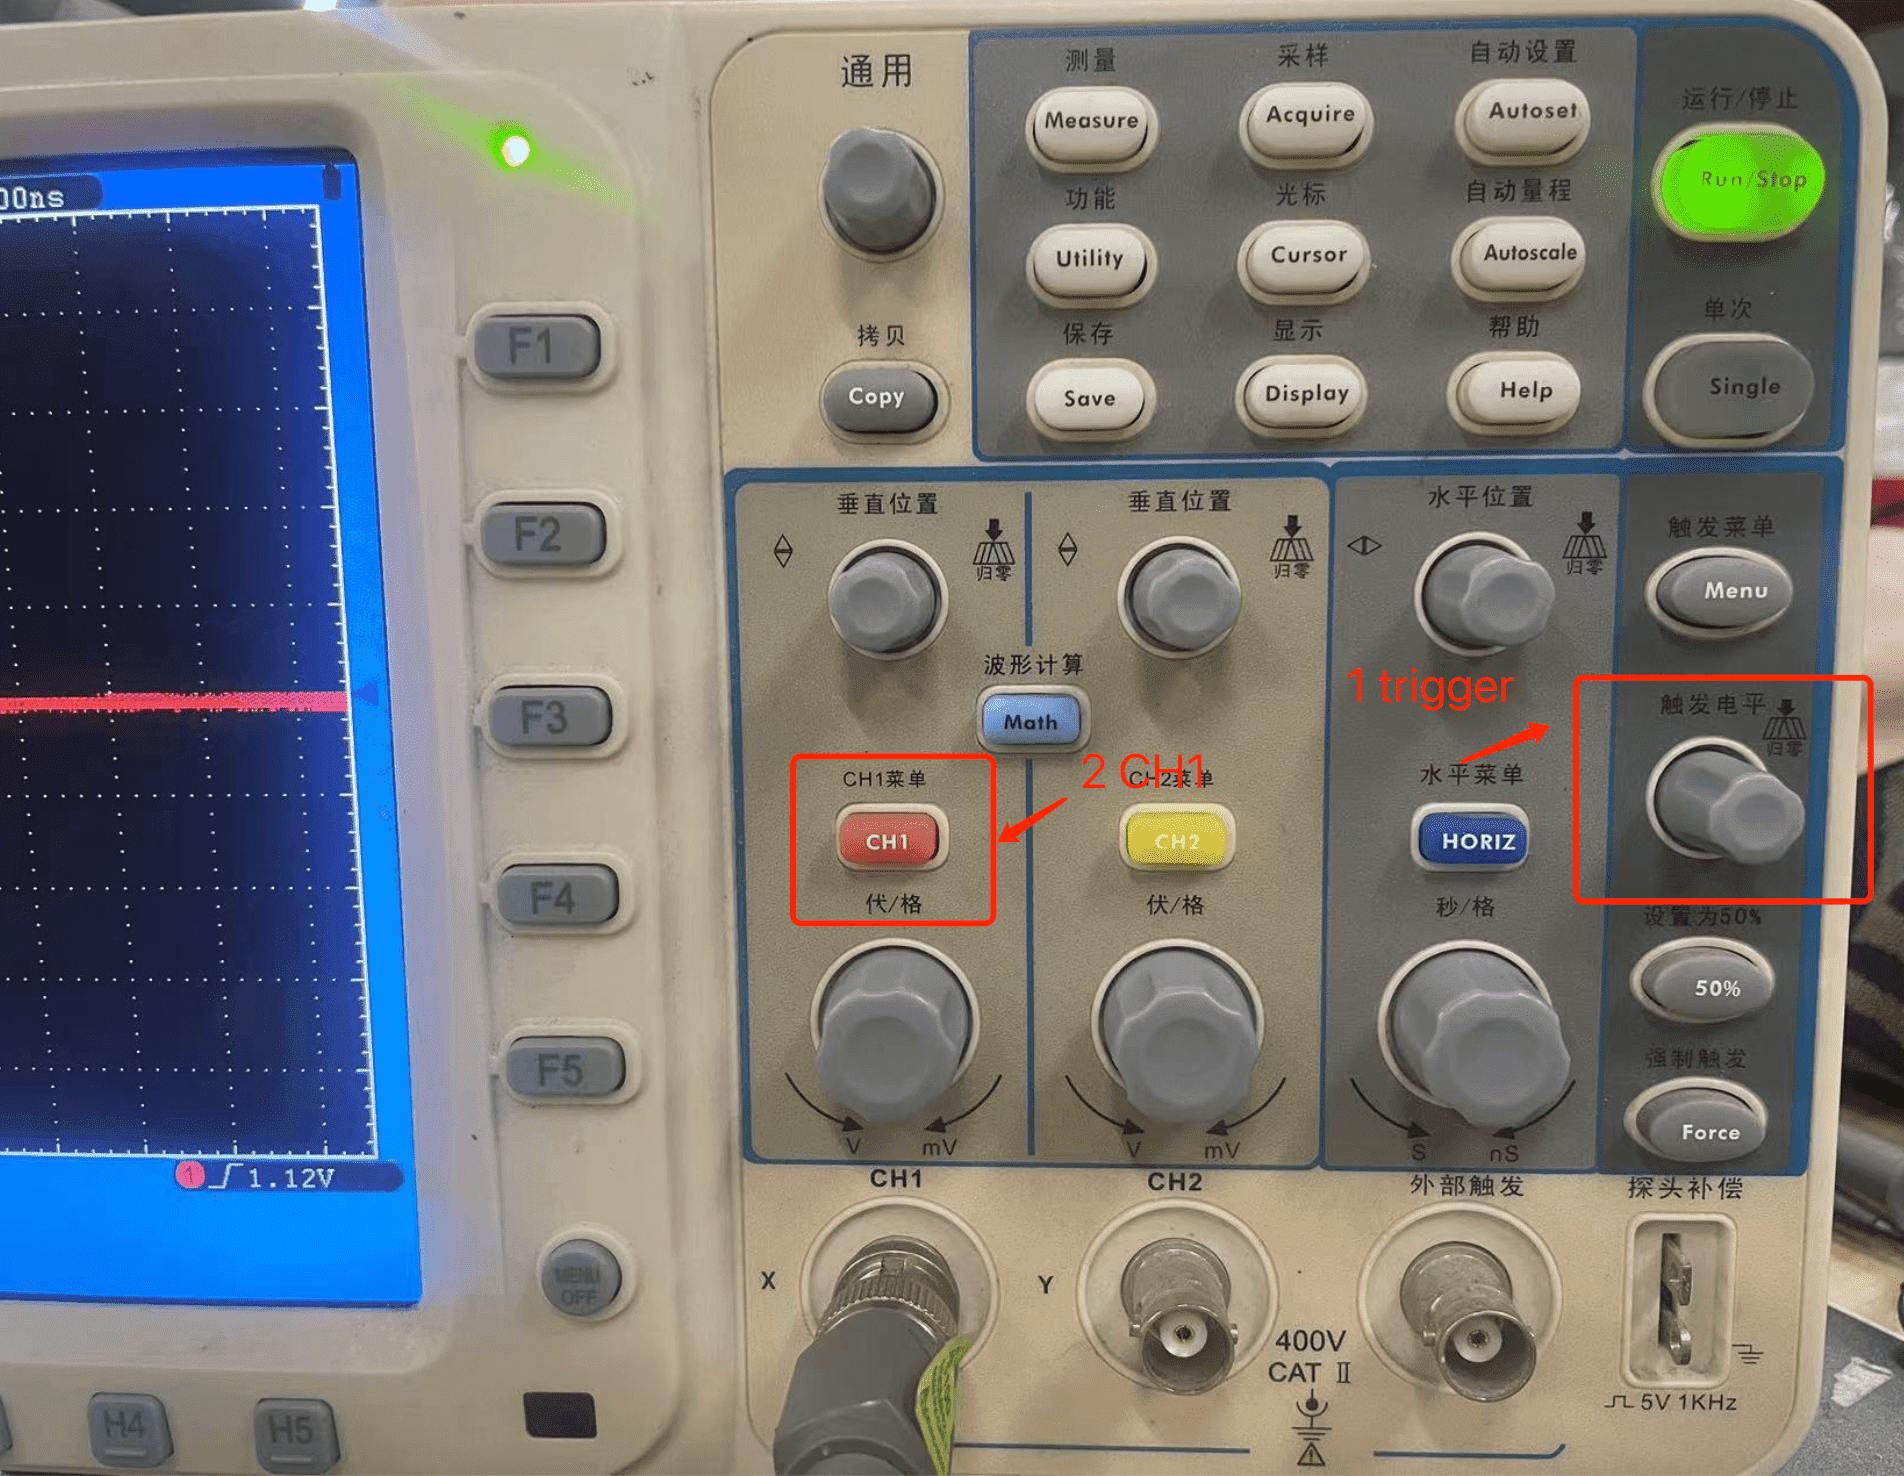
Step1. Press the trigger level button on the panel, and then press CH1 to adjust the trigger level.
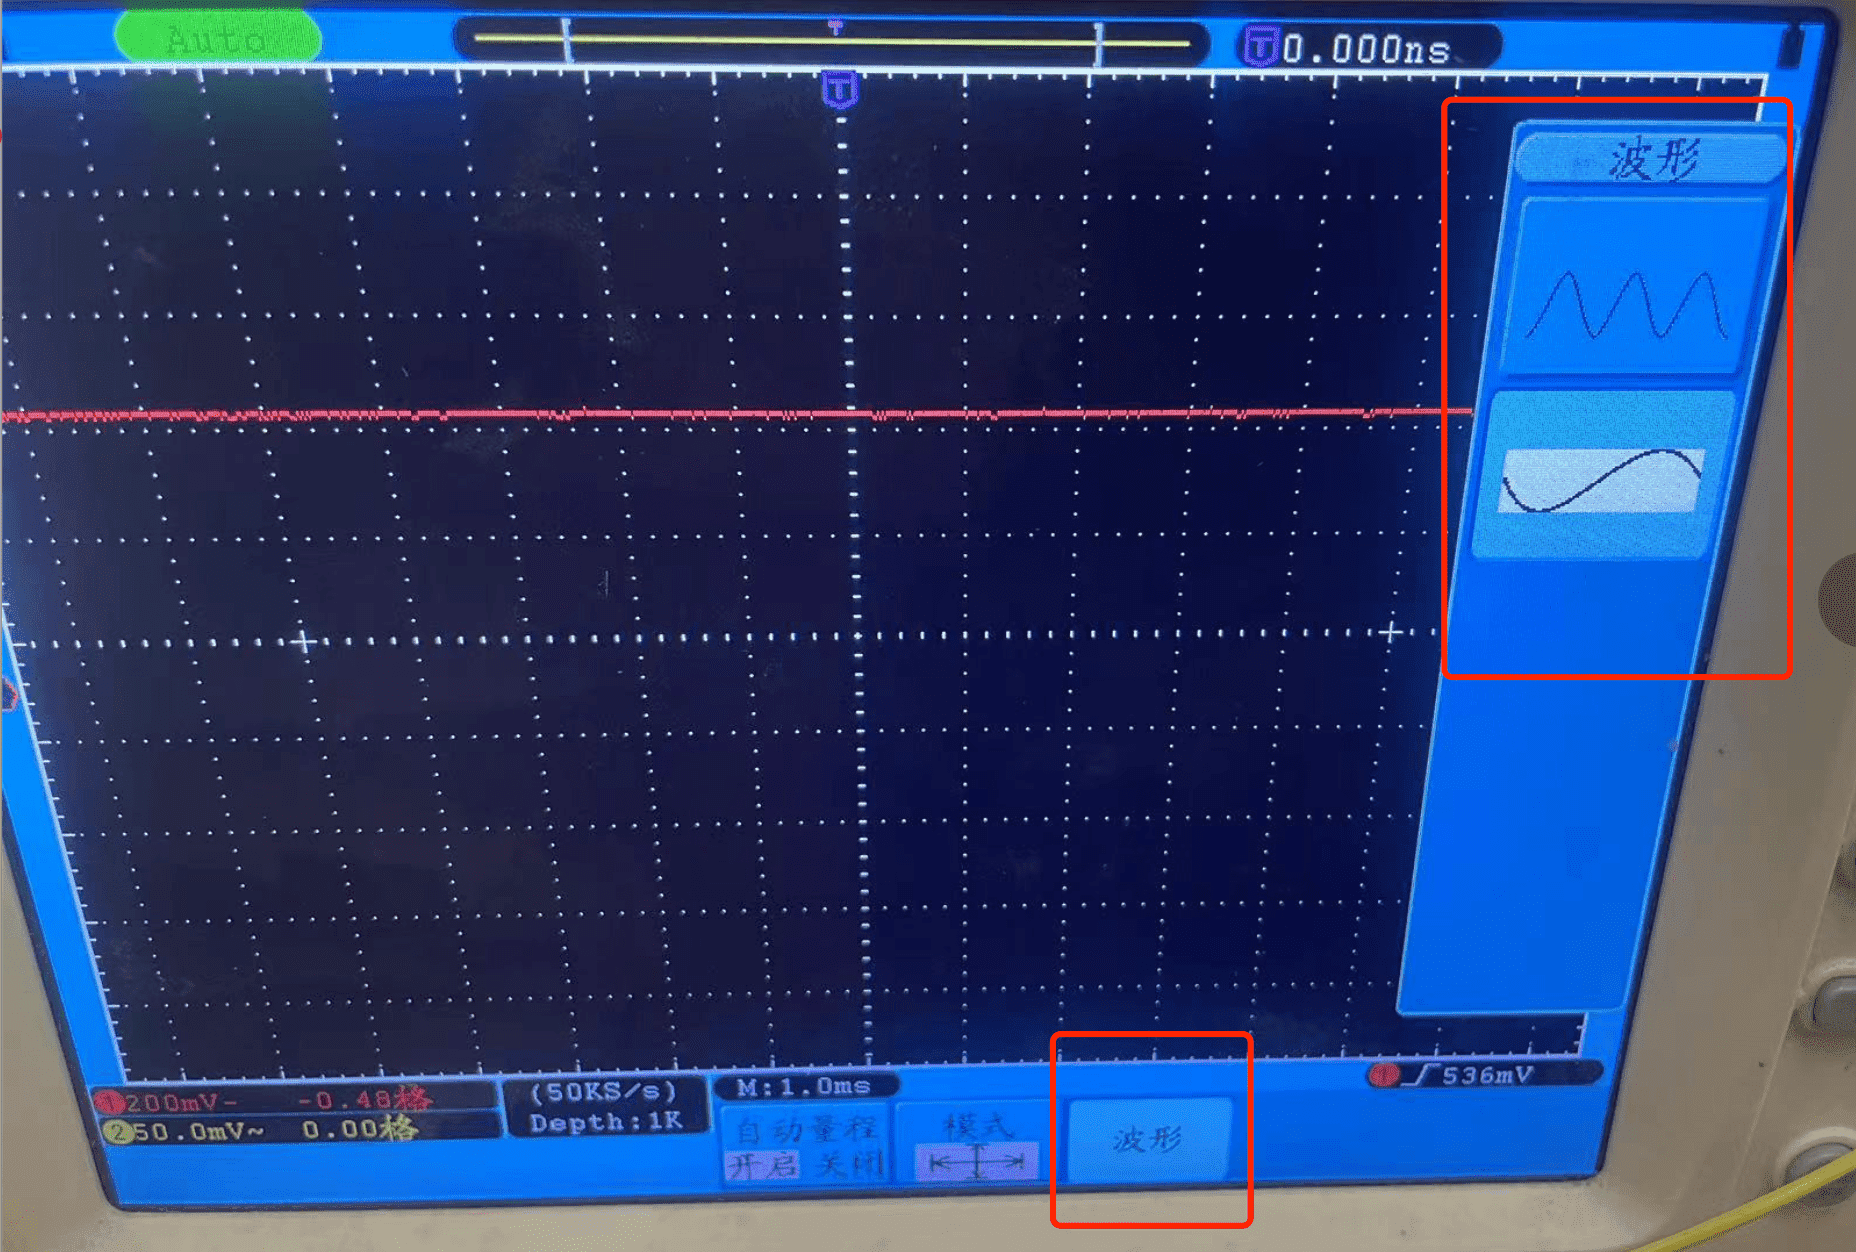
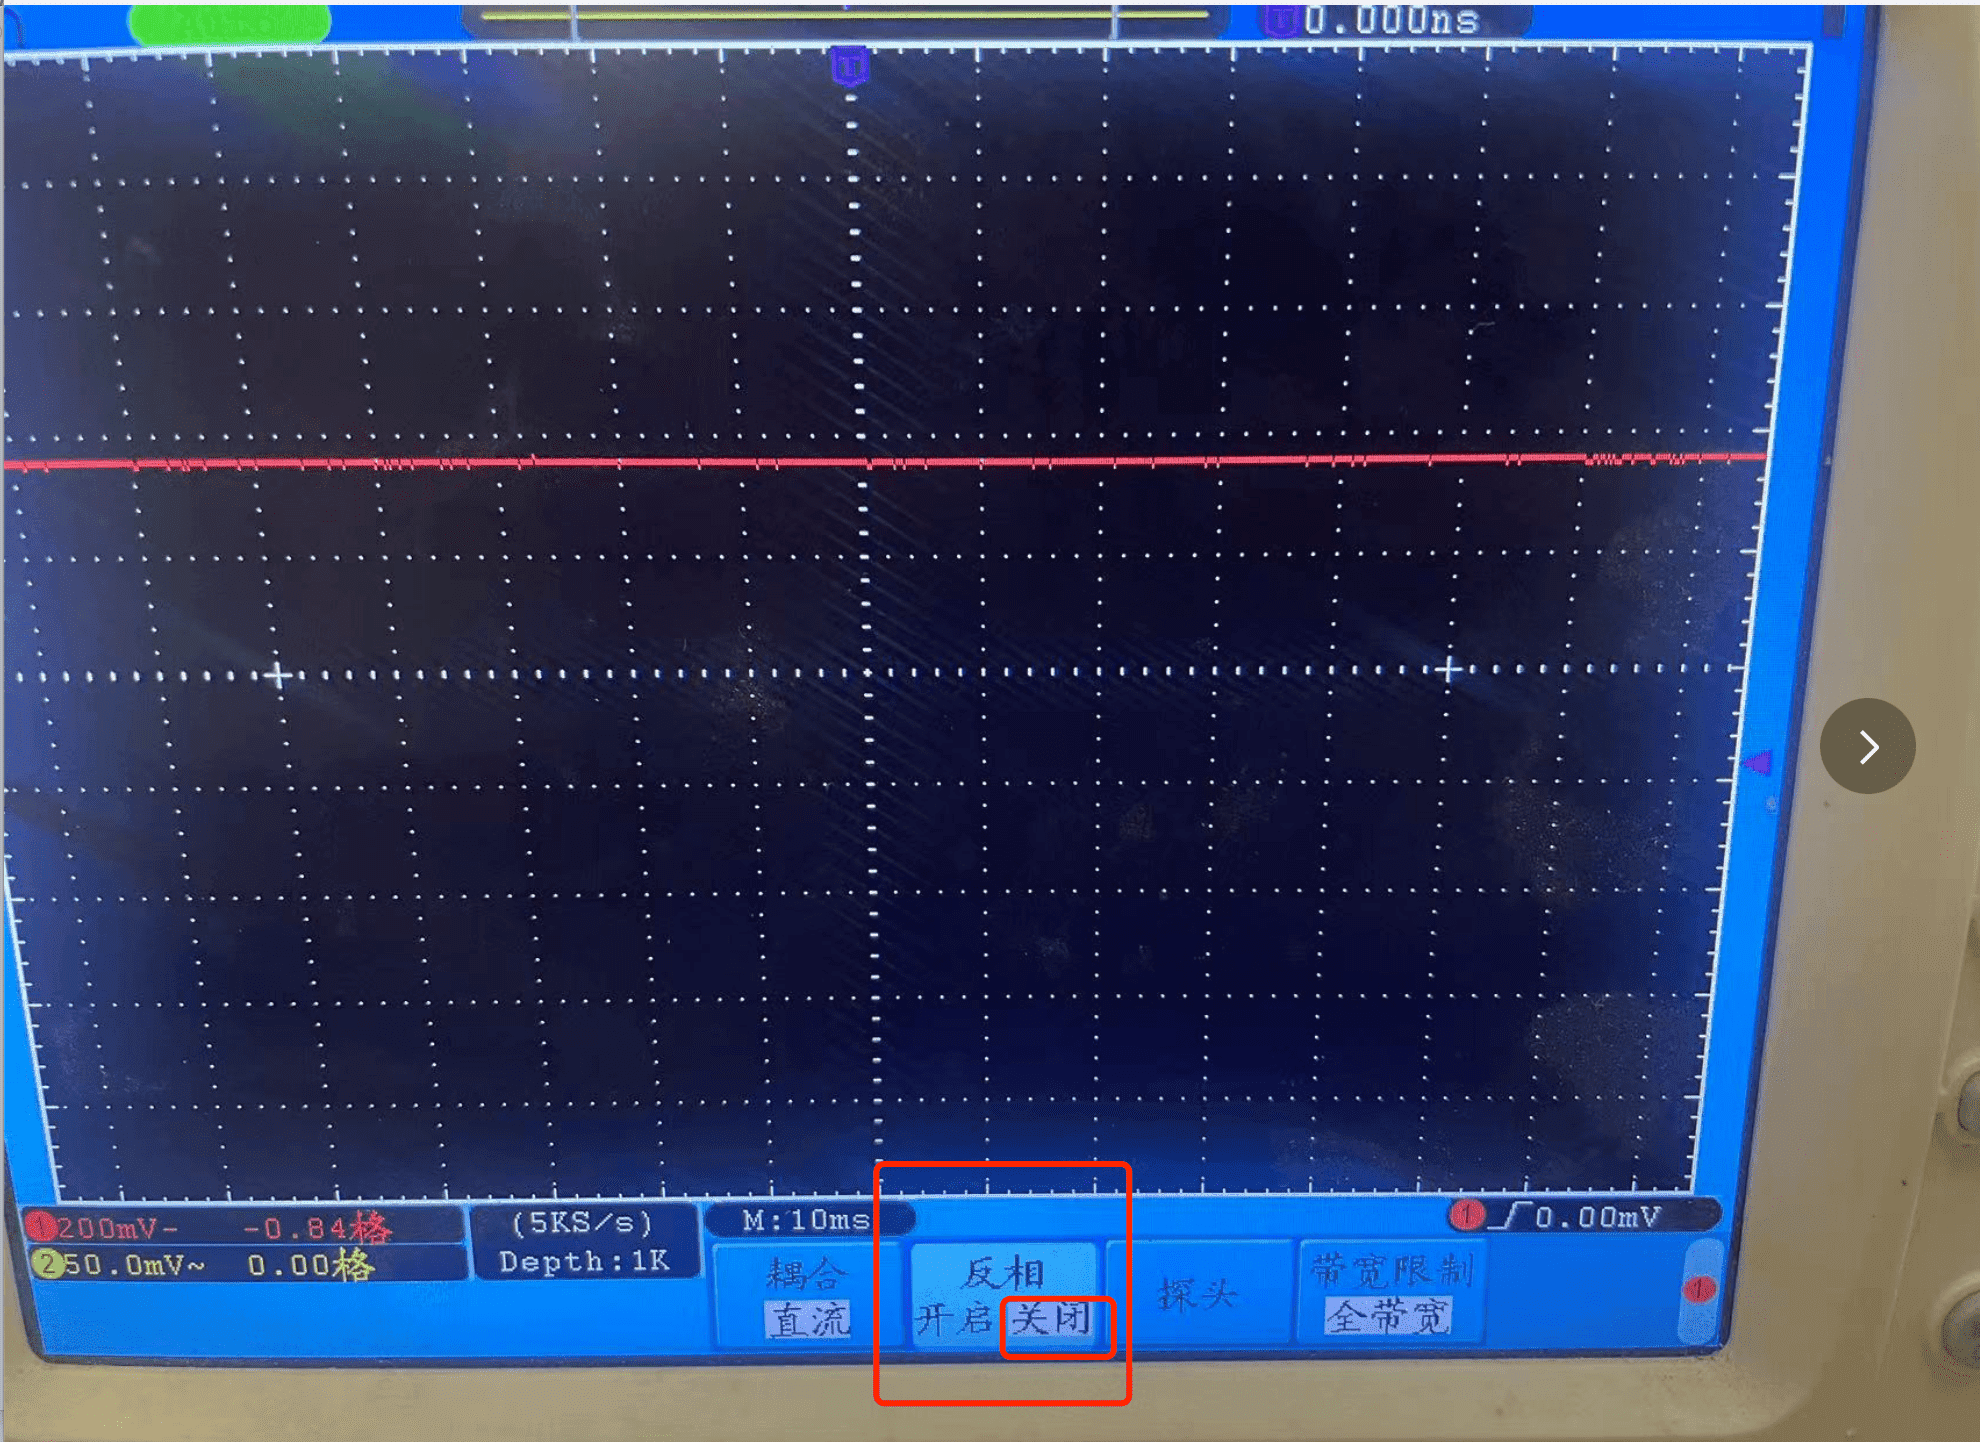
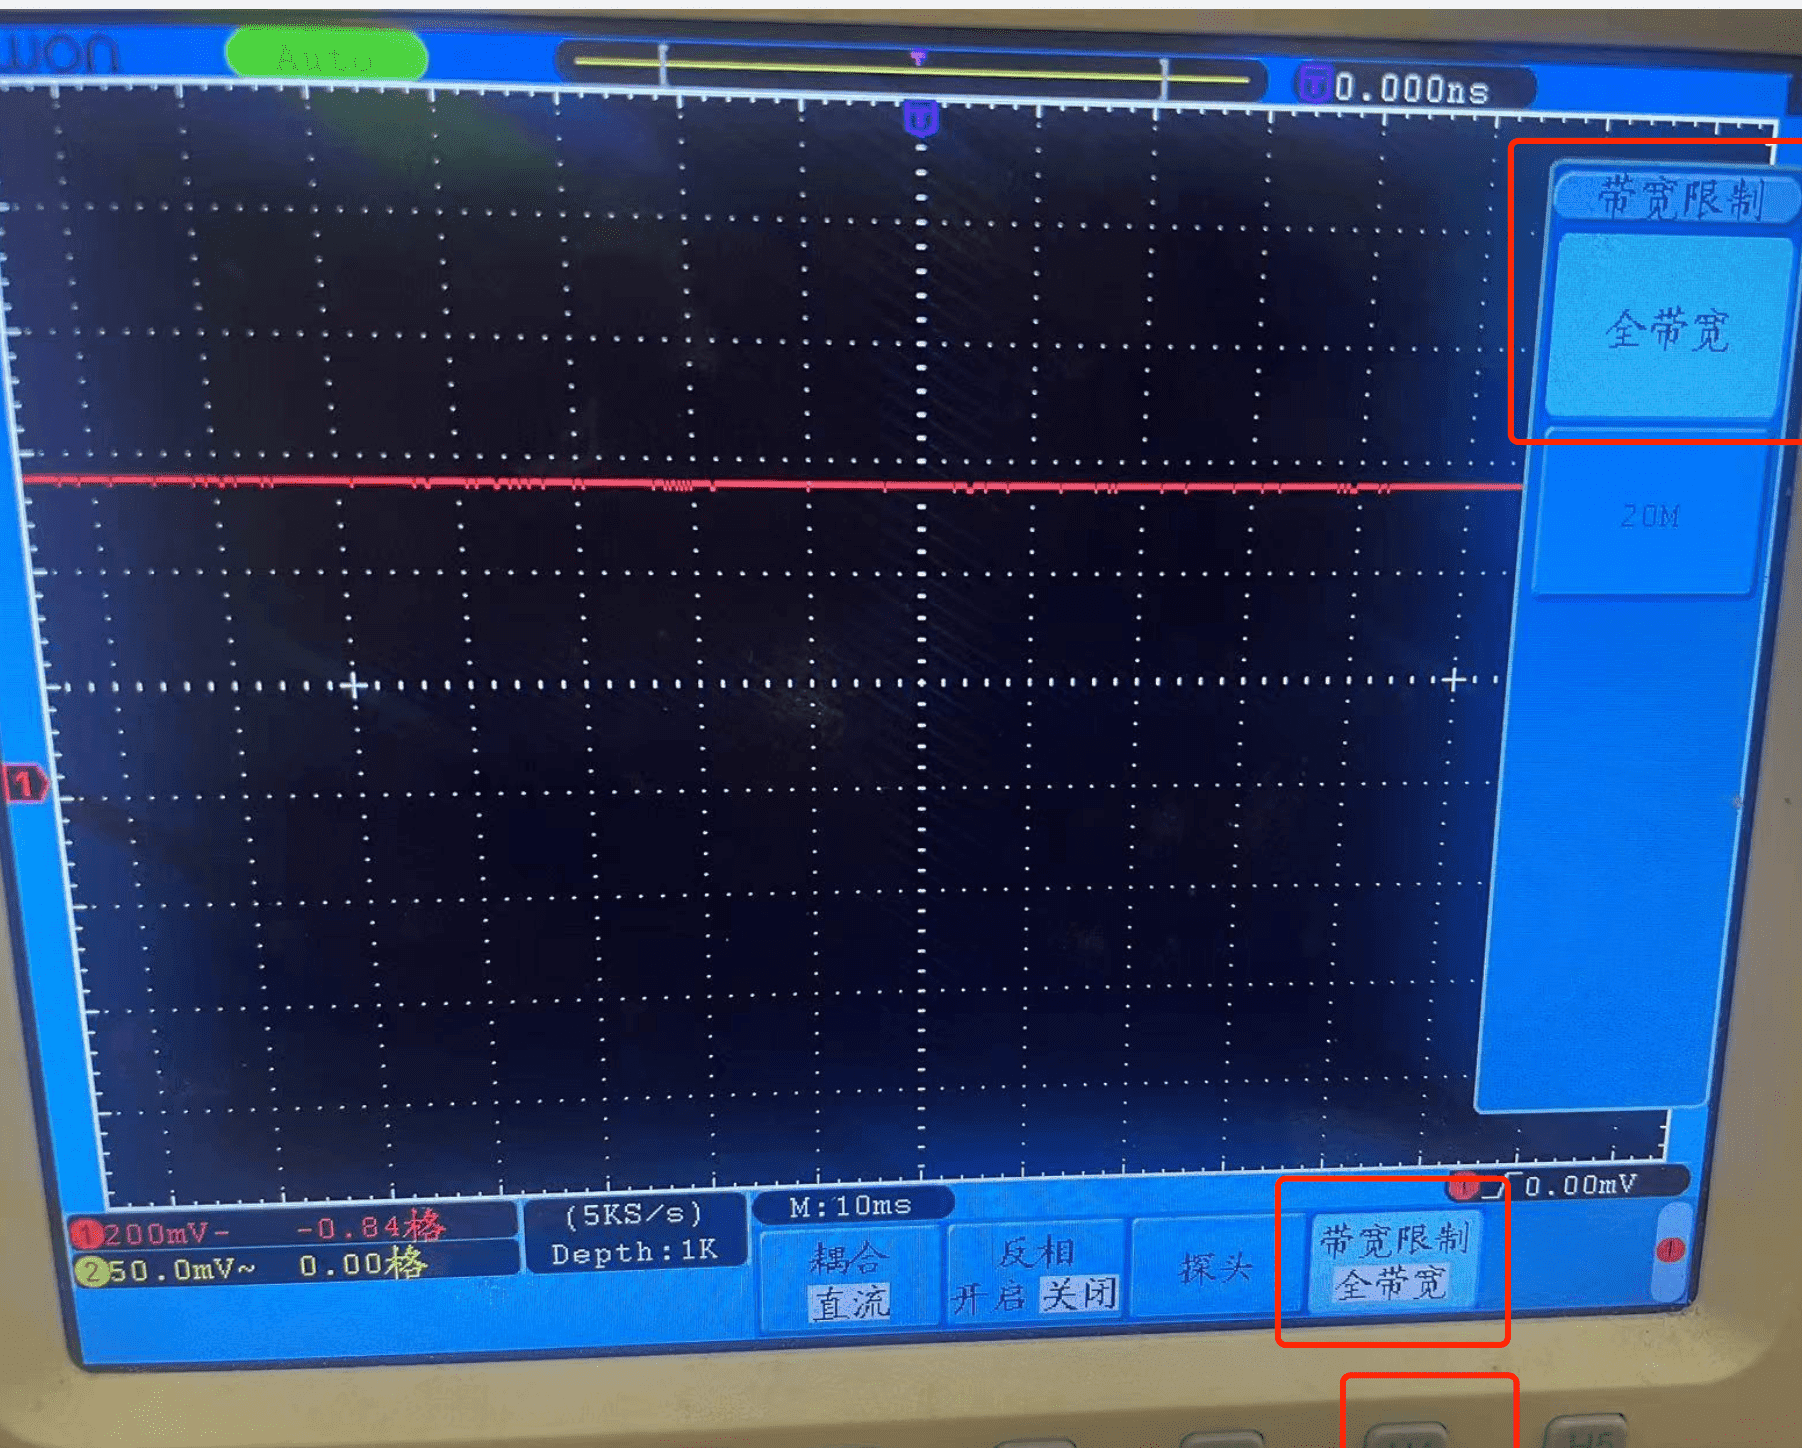
Step2. Adjust all the settings below:
- Adjust the coupling mode to direct current - Reverse the adjustment to off - Adjust the probe magnification to X1 - The bandwidth is set to the full bandwidth
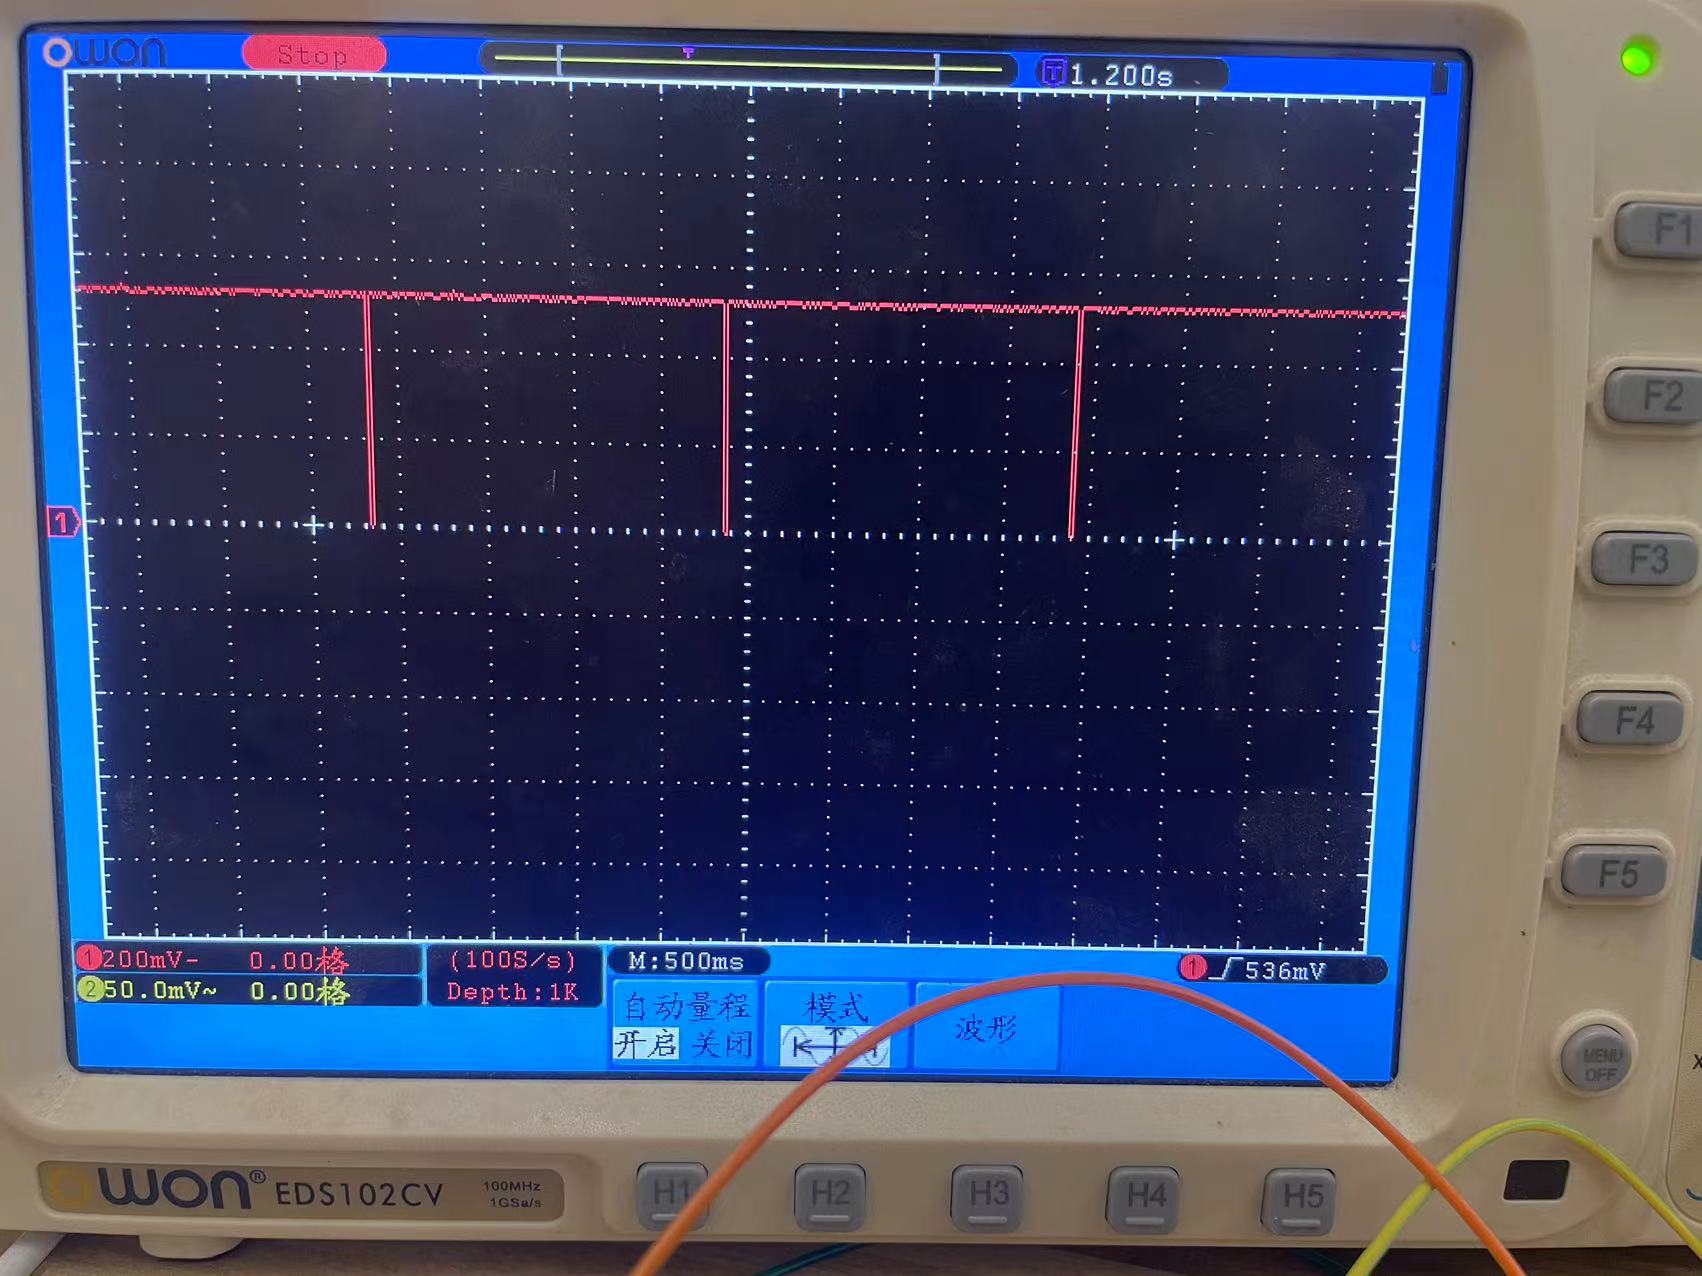
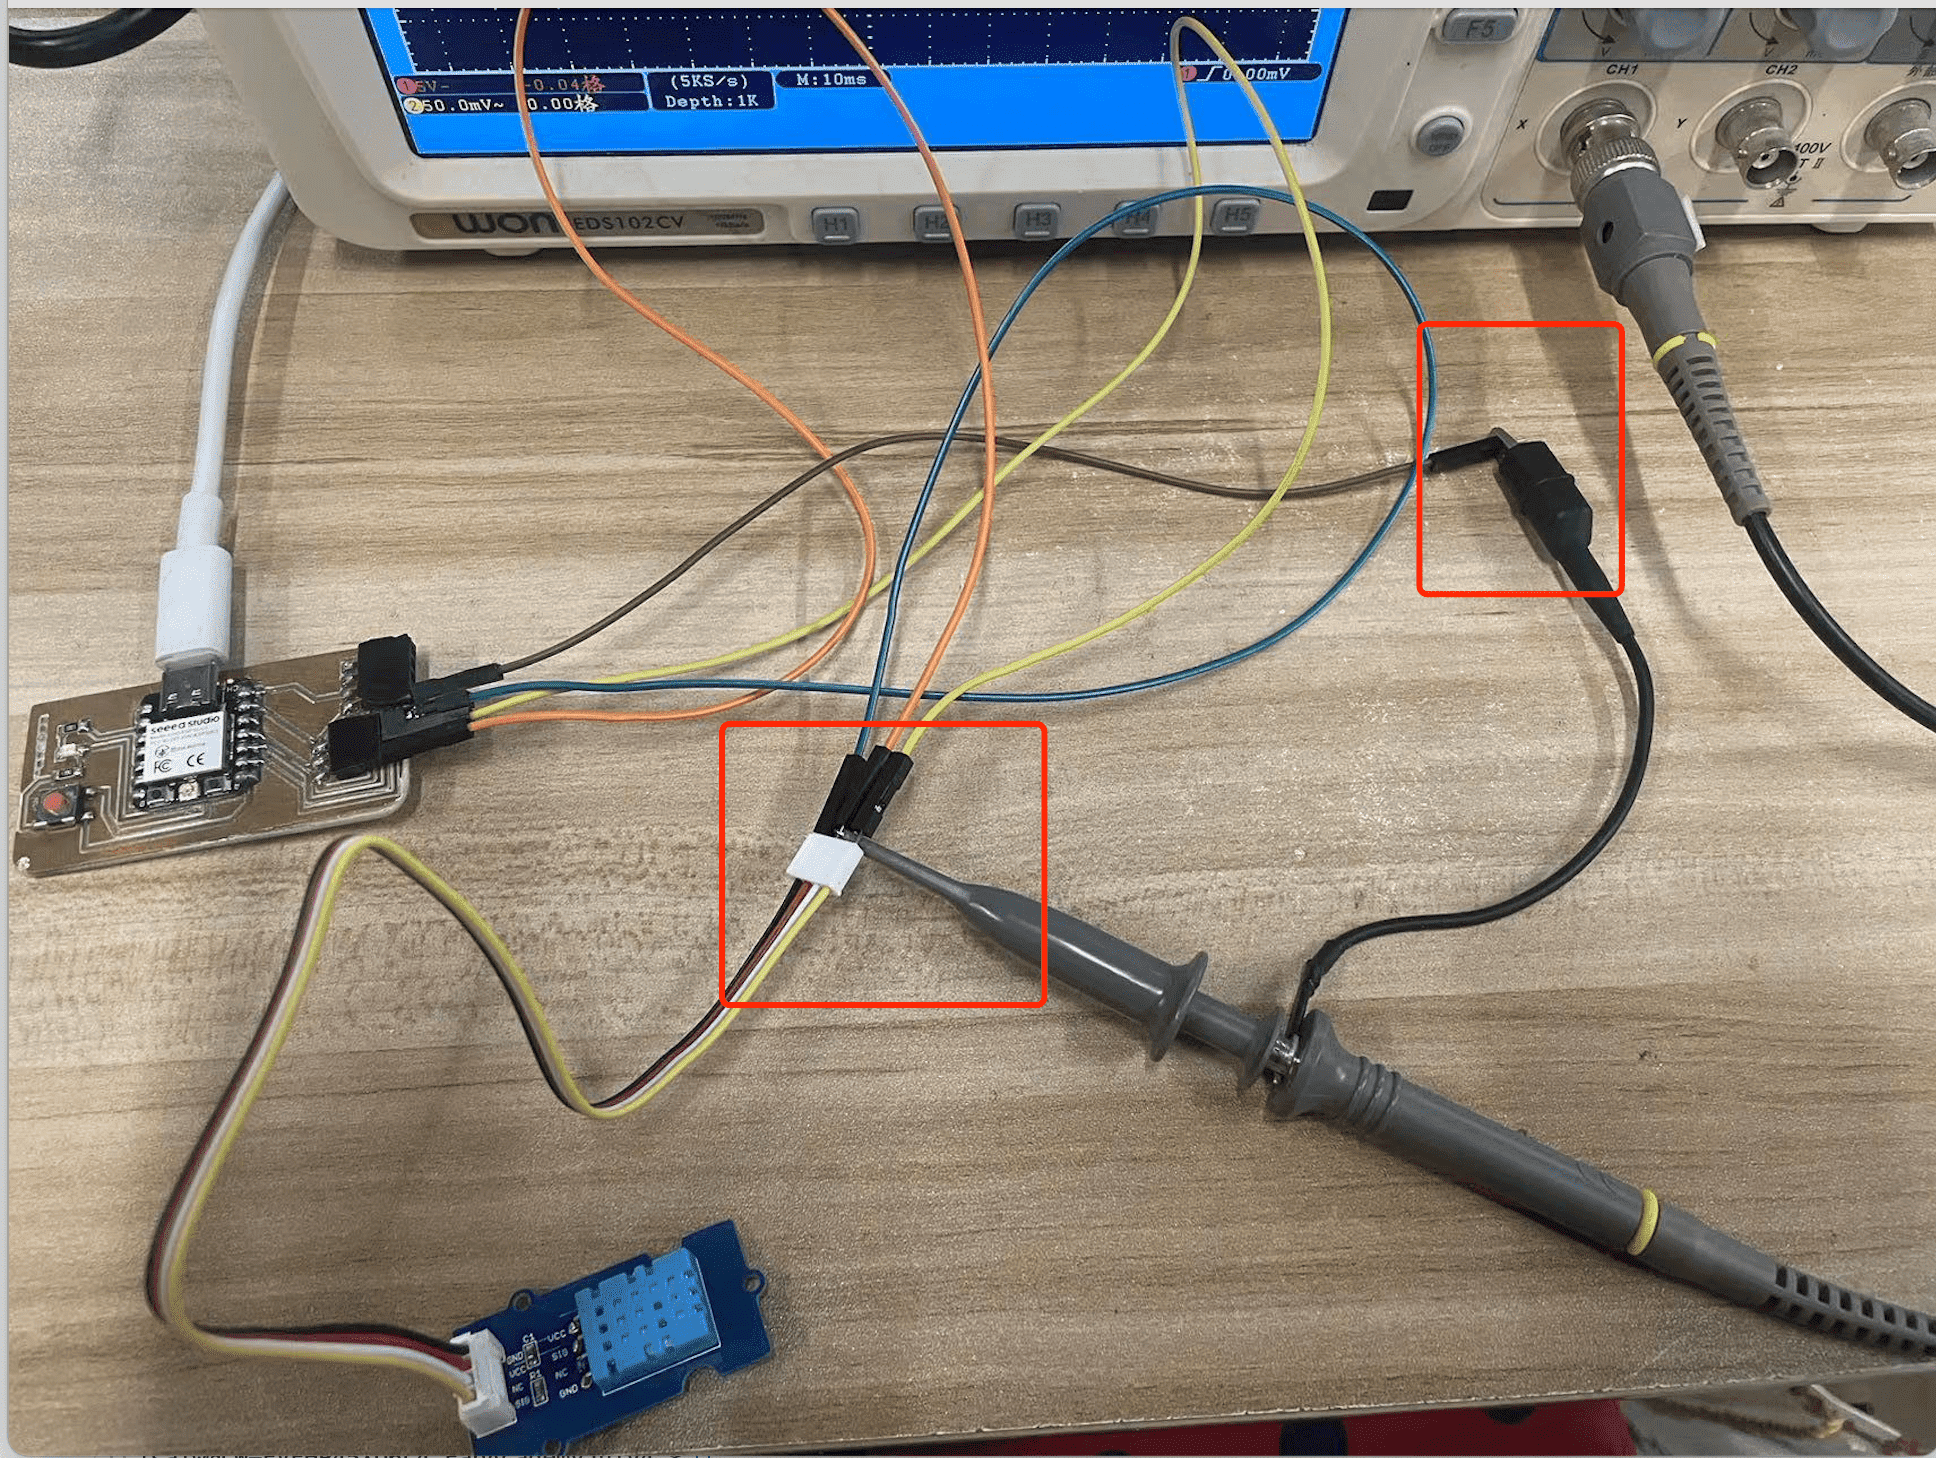
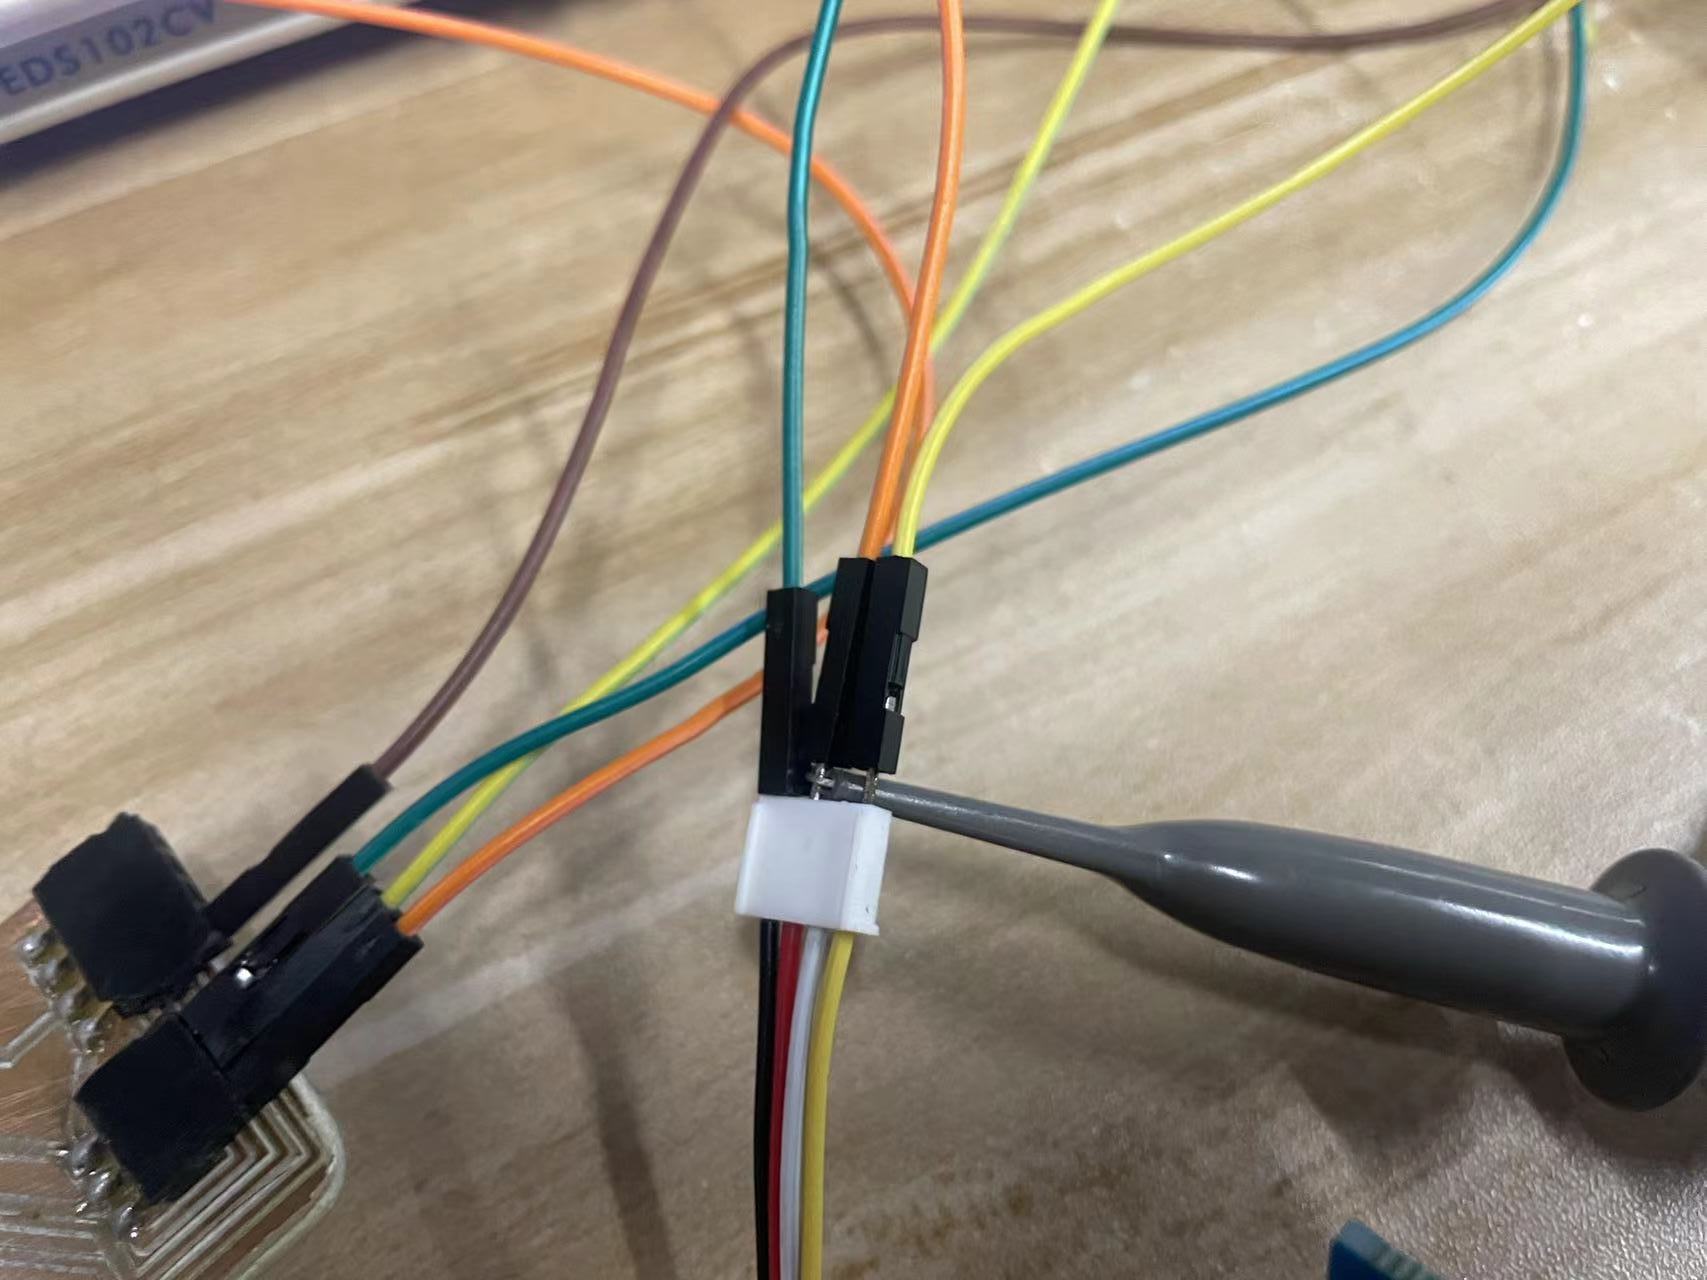
Step3. Clamp the ground wire to the ground wire of the ESP32C3. Hook the signal wire to the VCC wire of the DHT11.
Step4. The votage signal is okay!Because one grid is 5V and the voltage line is at one grid position above the level line, the voltage is a constant 5V.
Implementation of DHT11
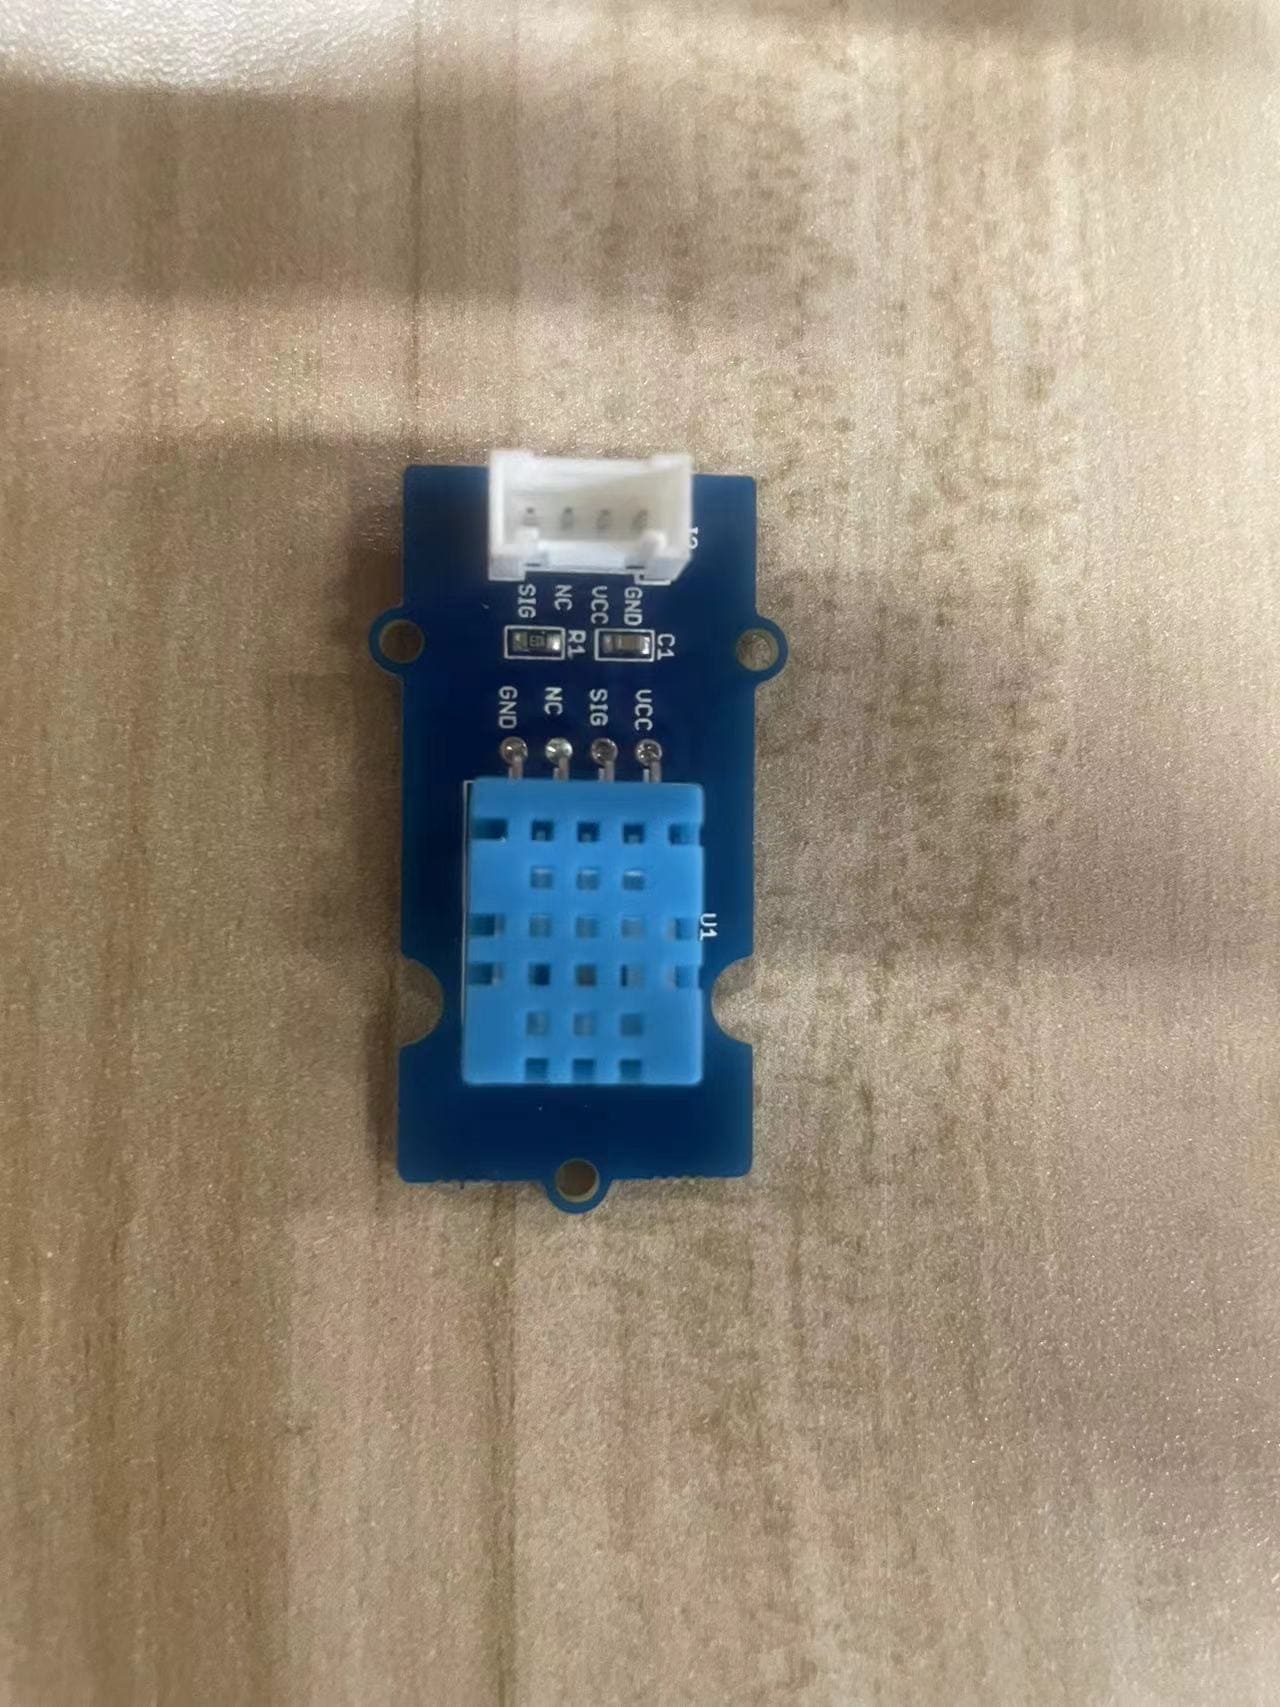
Part1. Get to know about DHT11
The DHT11 is a popular low-cost digital temperature and humidity sensor. It provides both temperature and relative humidity measurements in a single package.It communicates with microcontrollers or other devices using a simple single-wire communication protocol. The sensor is easy to interface and integrate into various projects and systems.The DHT11 offers relatively moderate accuracy, which is suitable for many general-purpose applications where precise measurements are not critical. It is commonly used in home automation, environmental monitoring, and simple weather stations.Overall, the DHT11 provides a convenient and accessible solution for obtaining basic temperature and humidity data.Data Sheet of DHT11
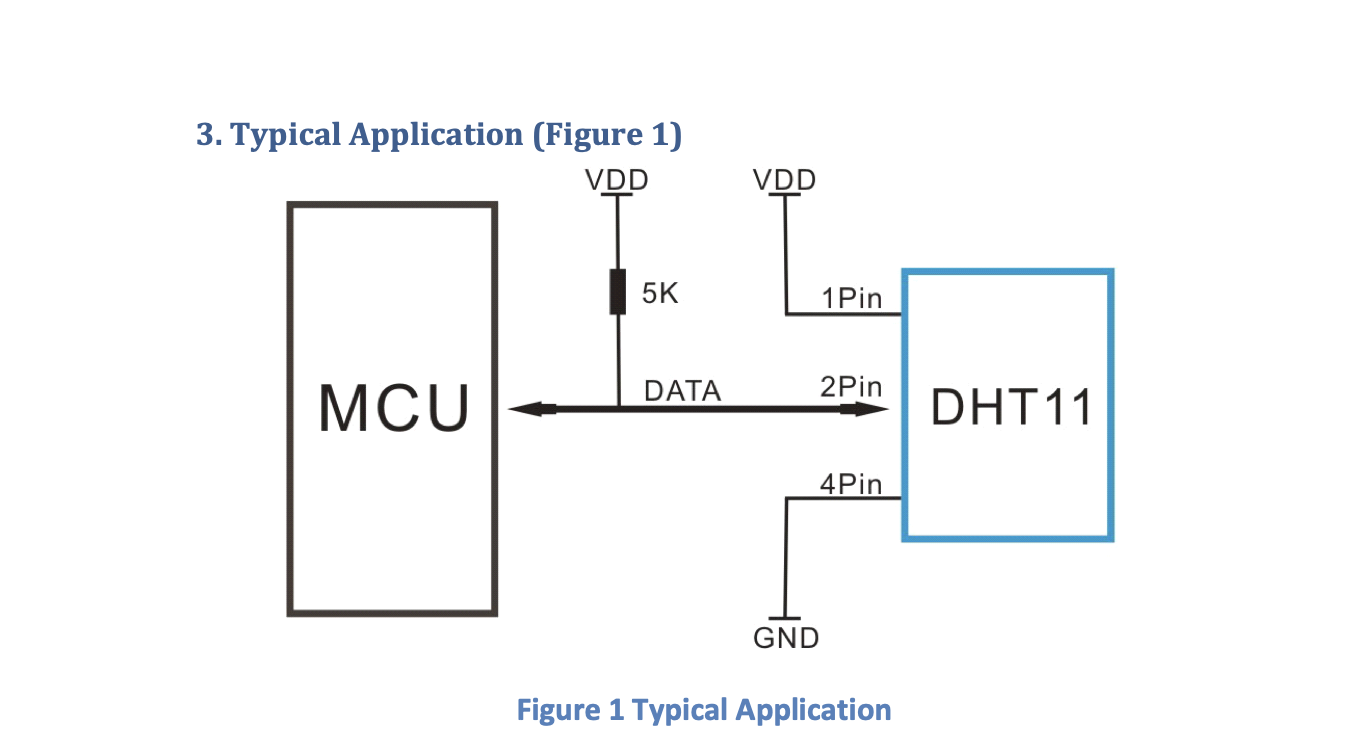
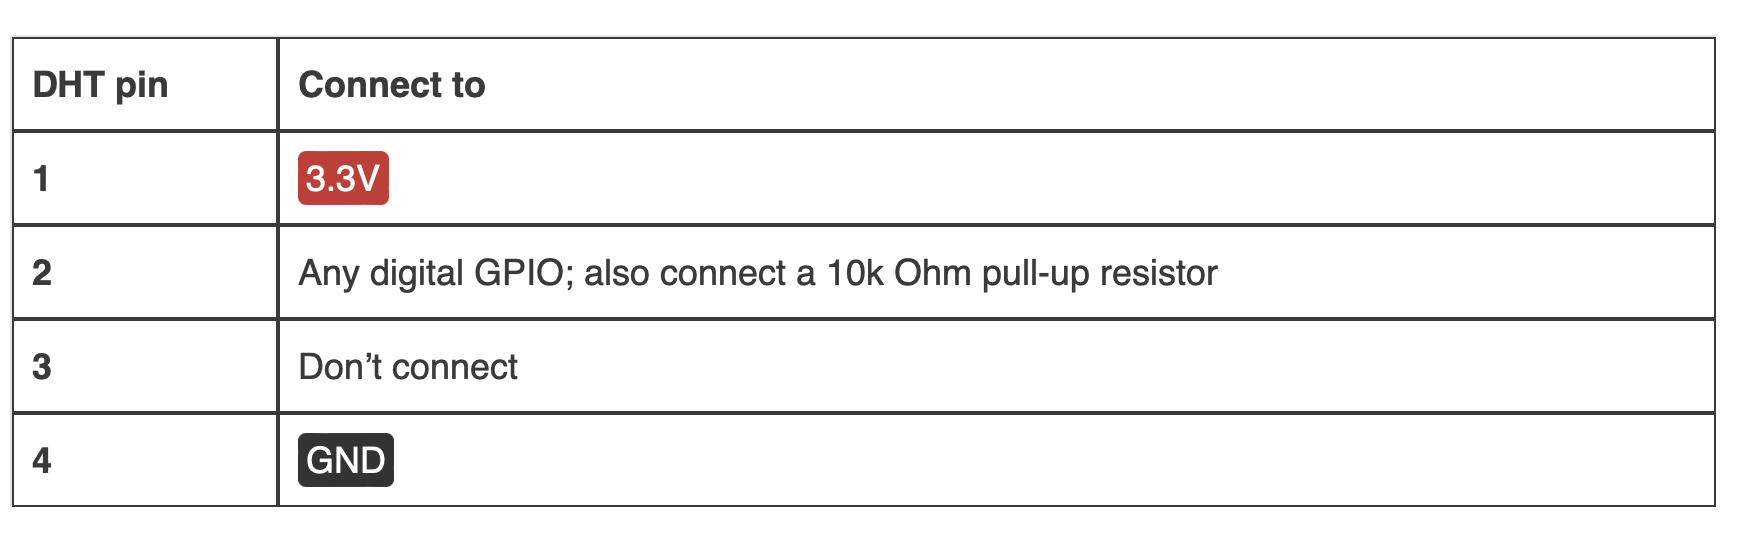
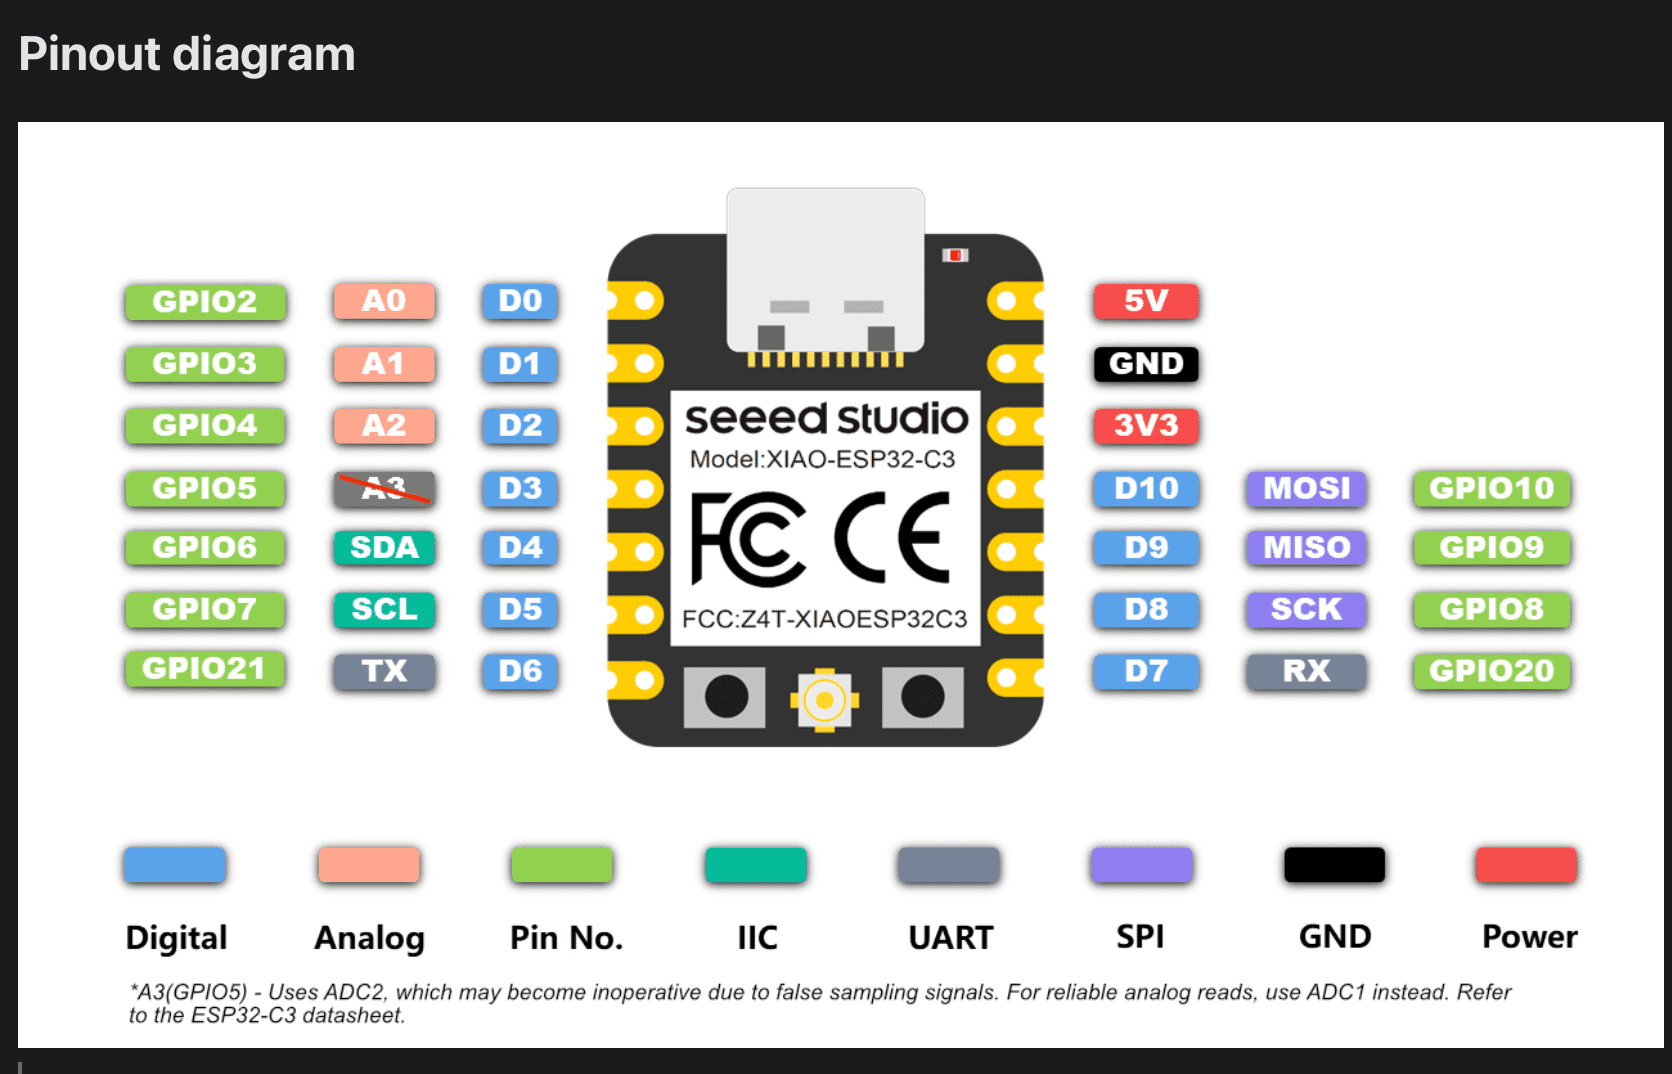
Based on this diagram in the DHT11 datasheet
- The NC port on the DHT11 should be left unconnected
- The data SIG port should be connected my ESP32C3 GPIO D8
- The VCC port should be connected my ESP32C3 VCC port
- The GND port should be connected my ESP32C3 GND port
Part3. Embeded Programming
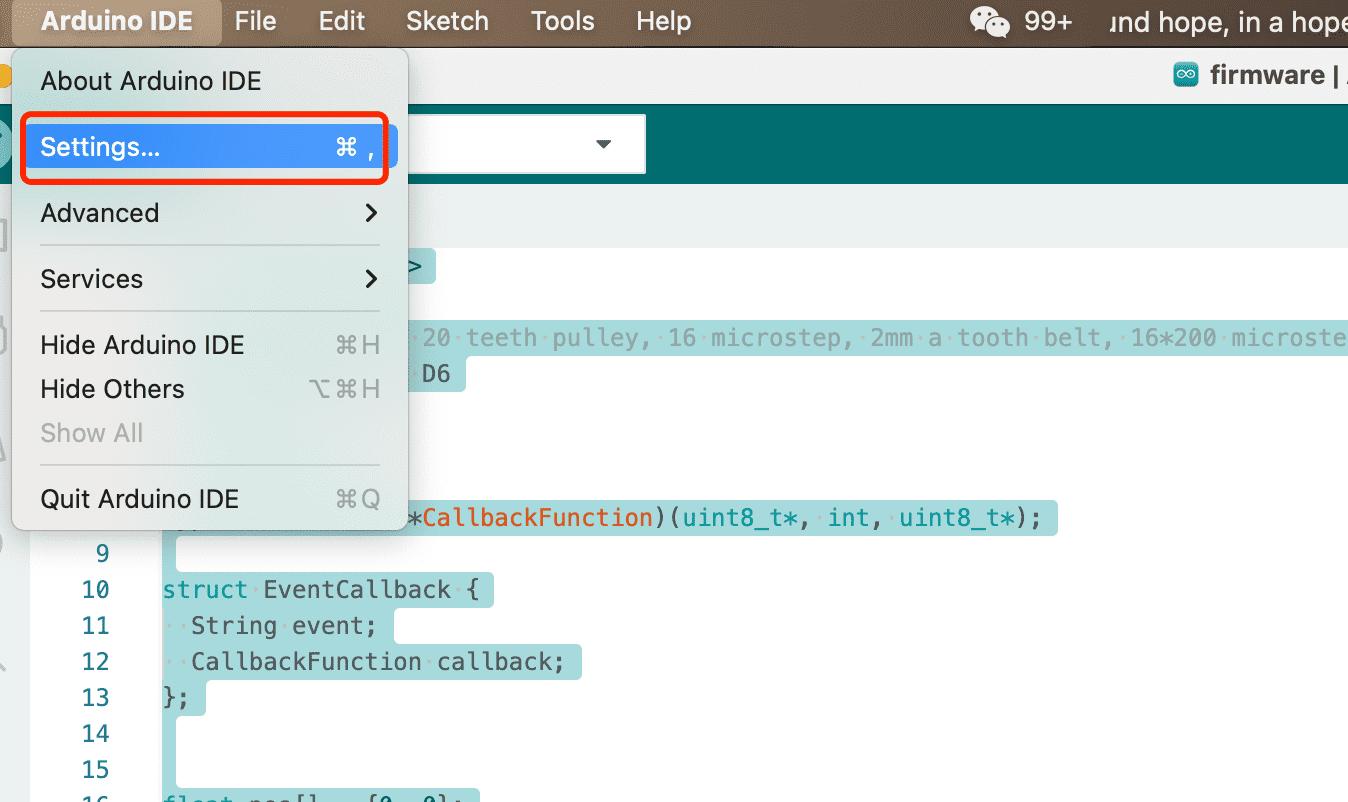
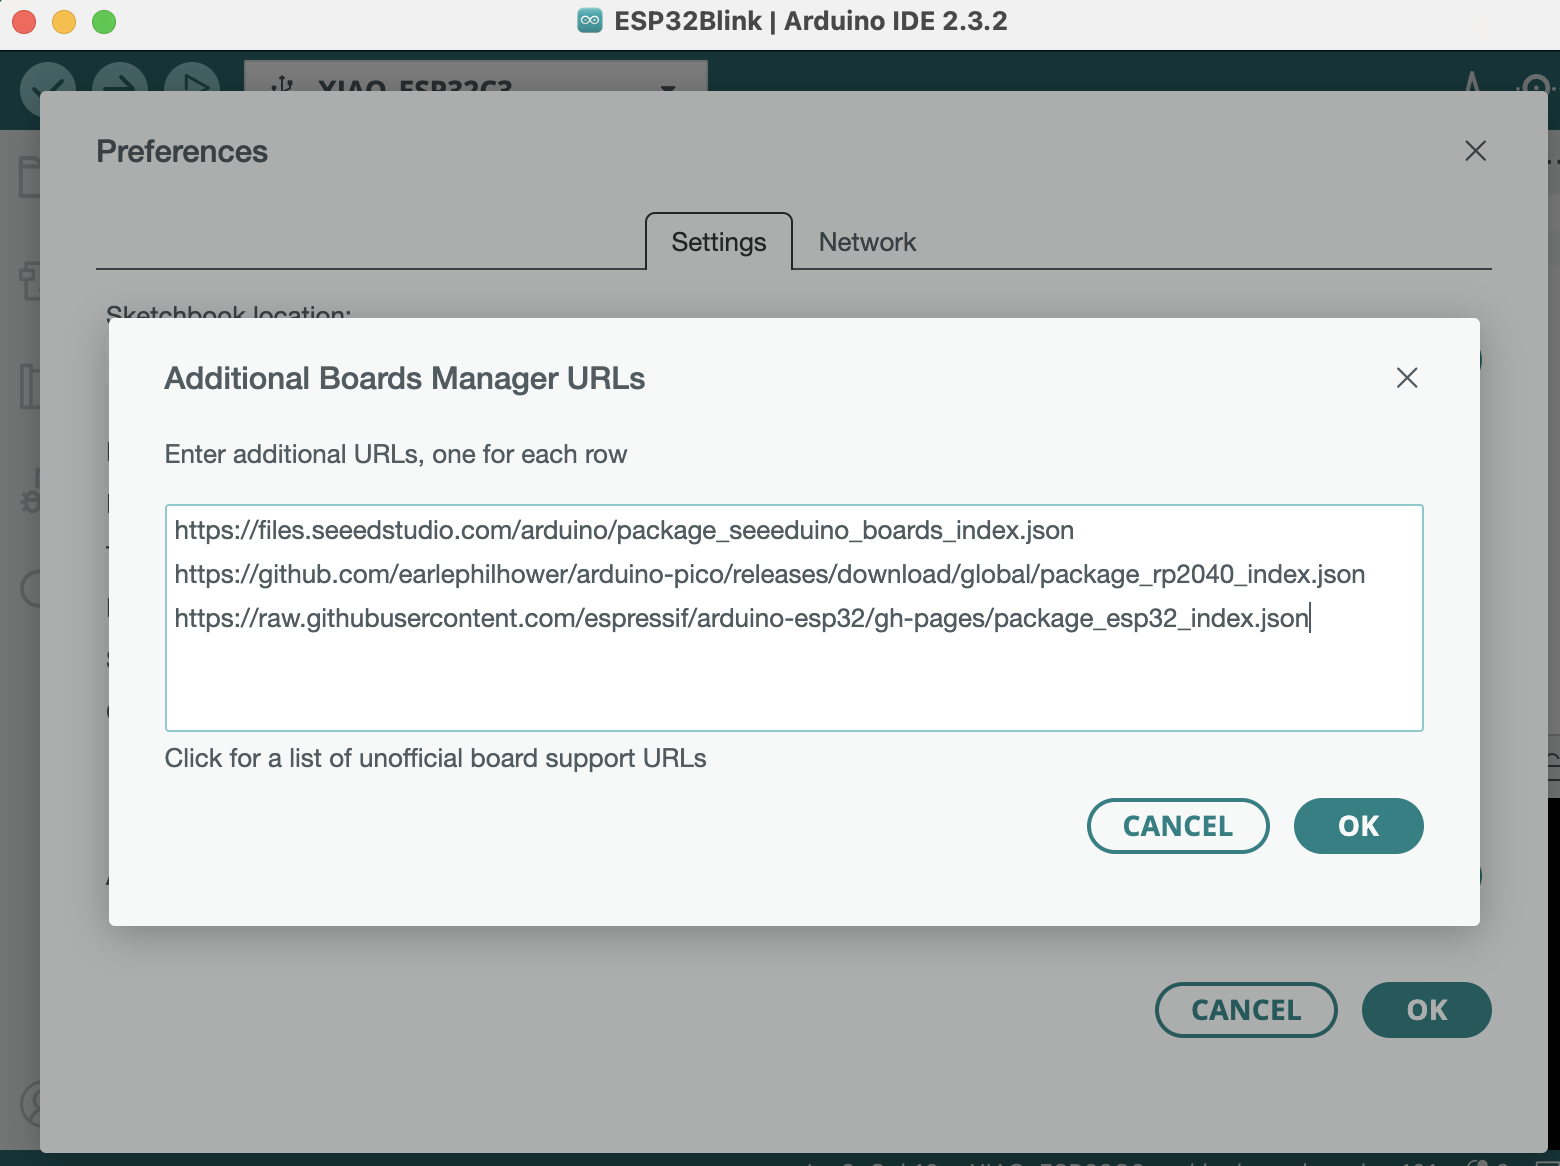
Step1. Install ESP32C3 Libary
For mac,navigate Arduino IDE -> Settings
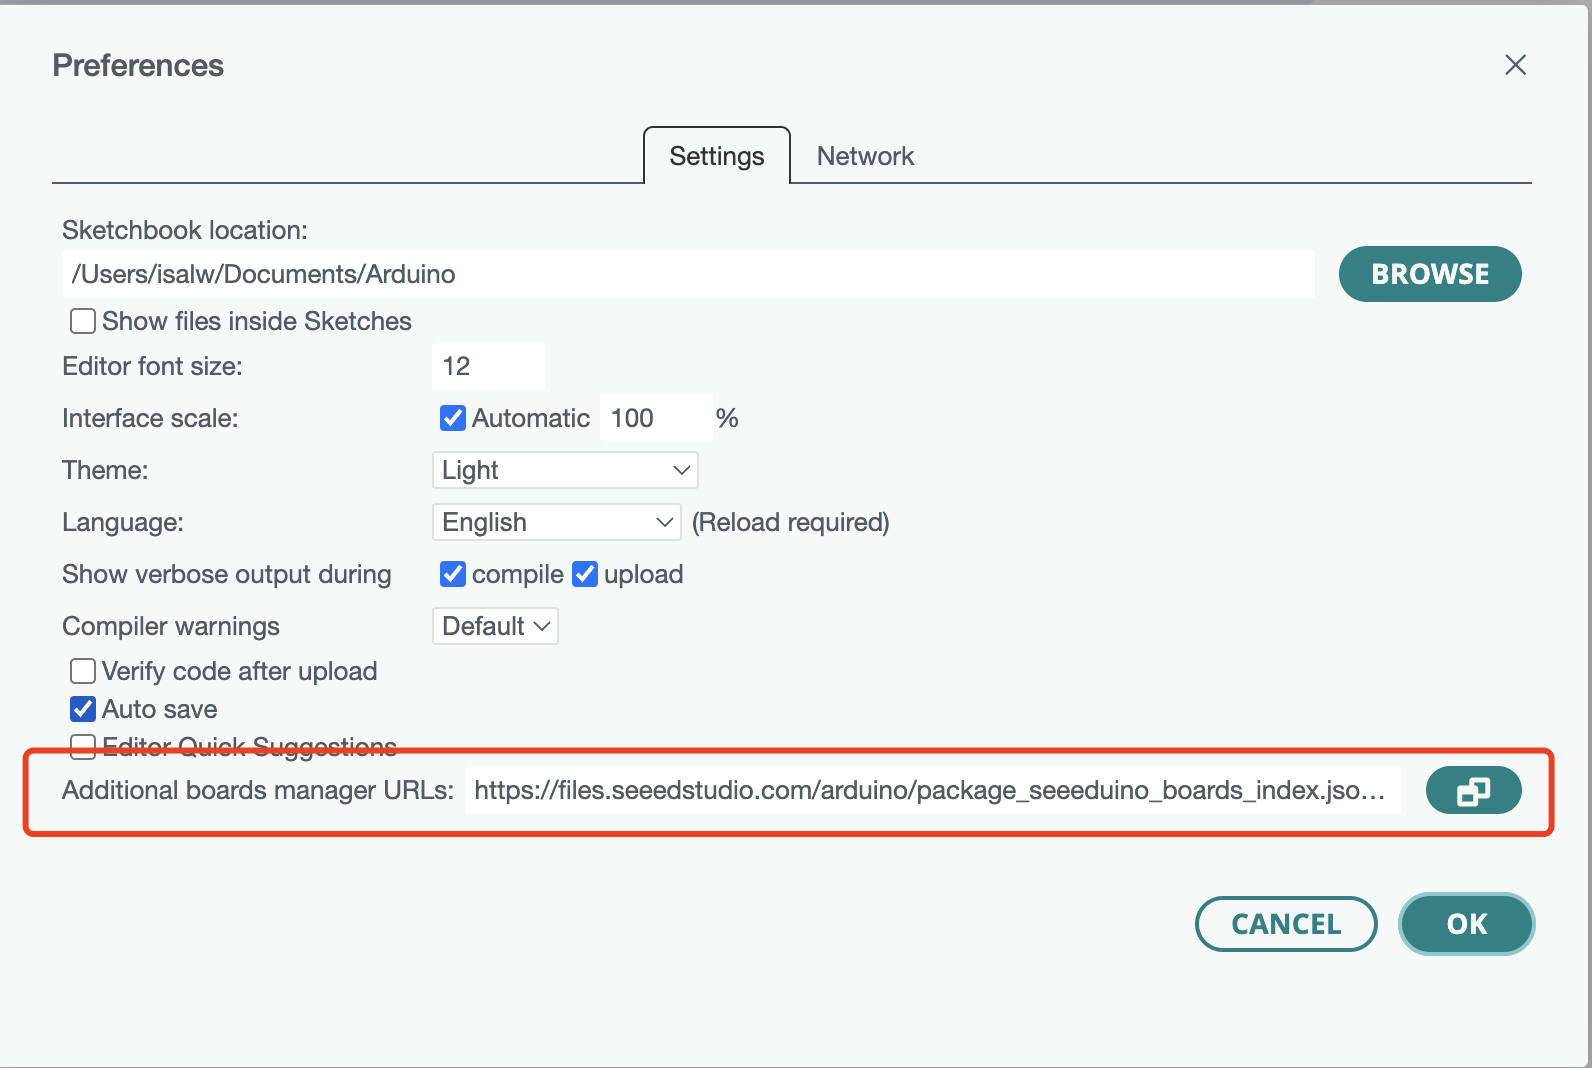
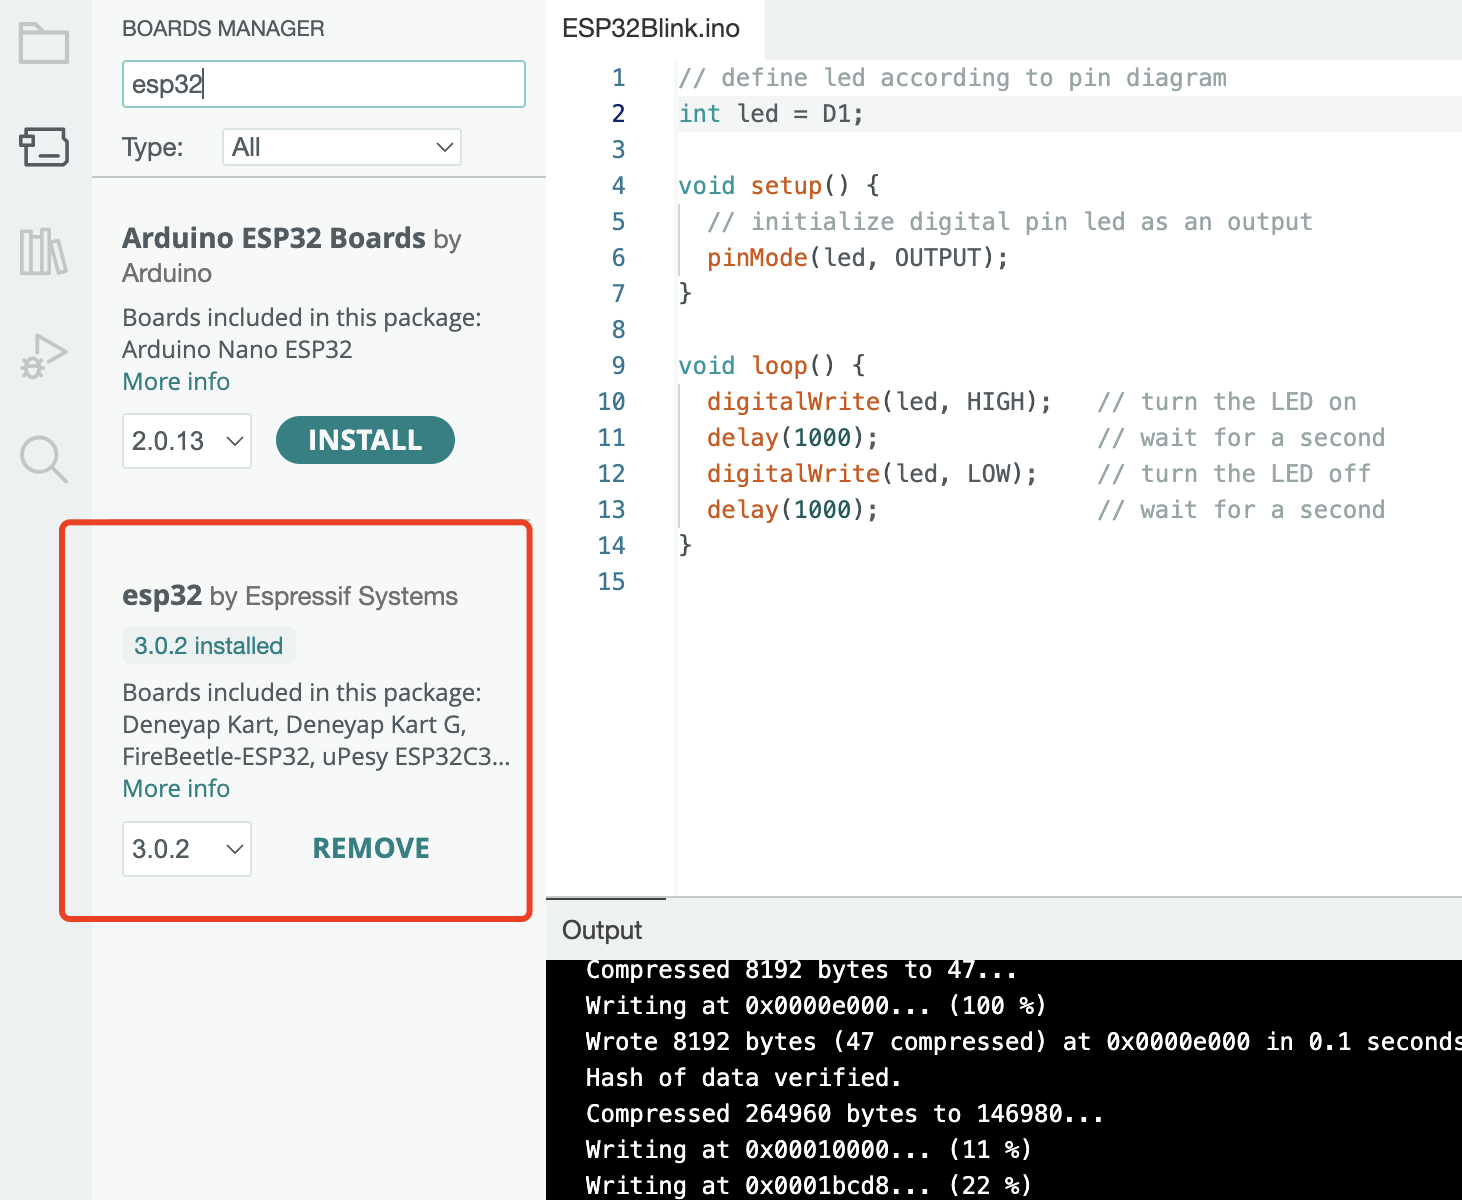
Step2. Install ESP32C3 Board Manager
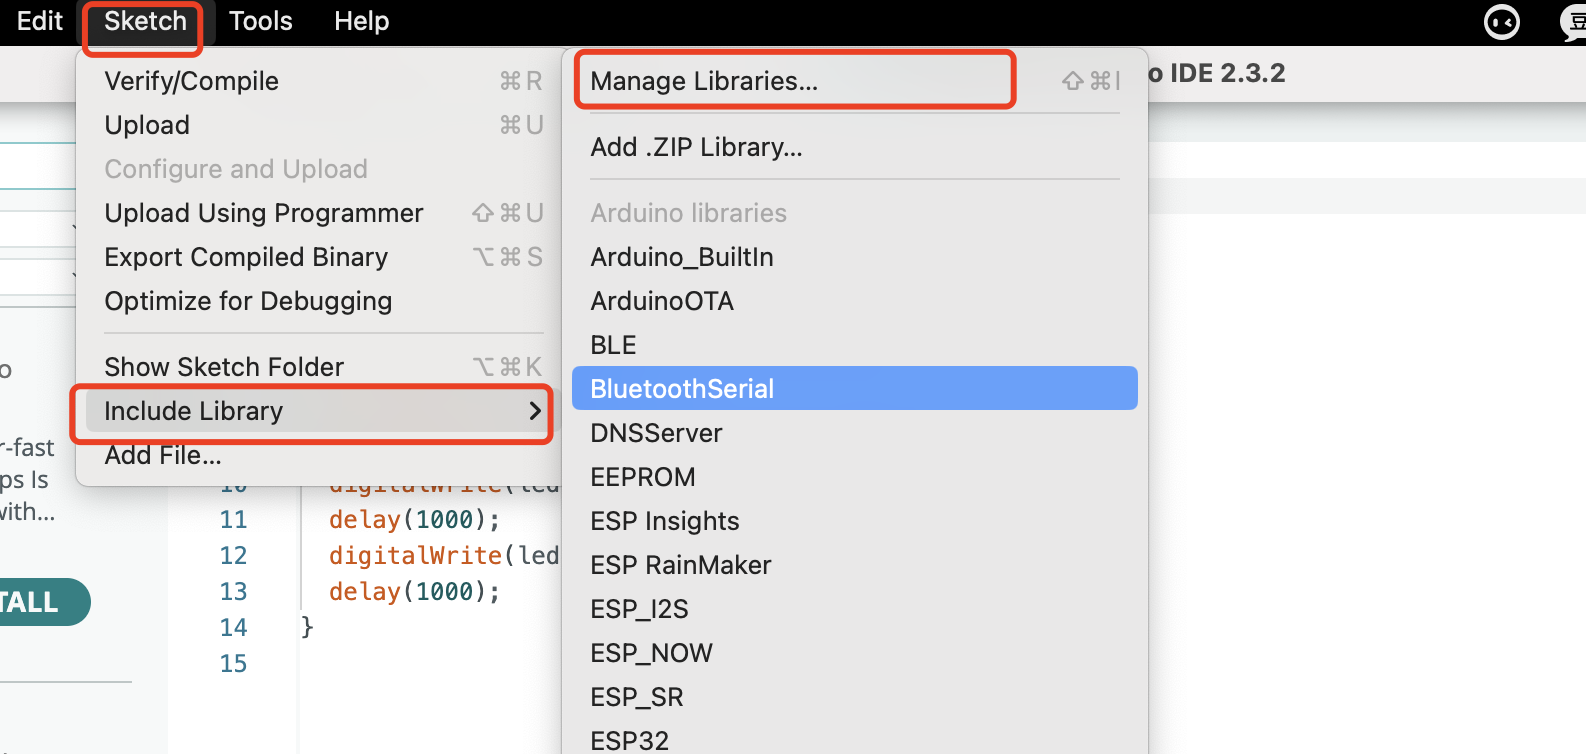
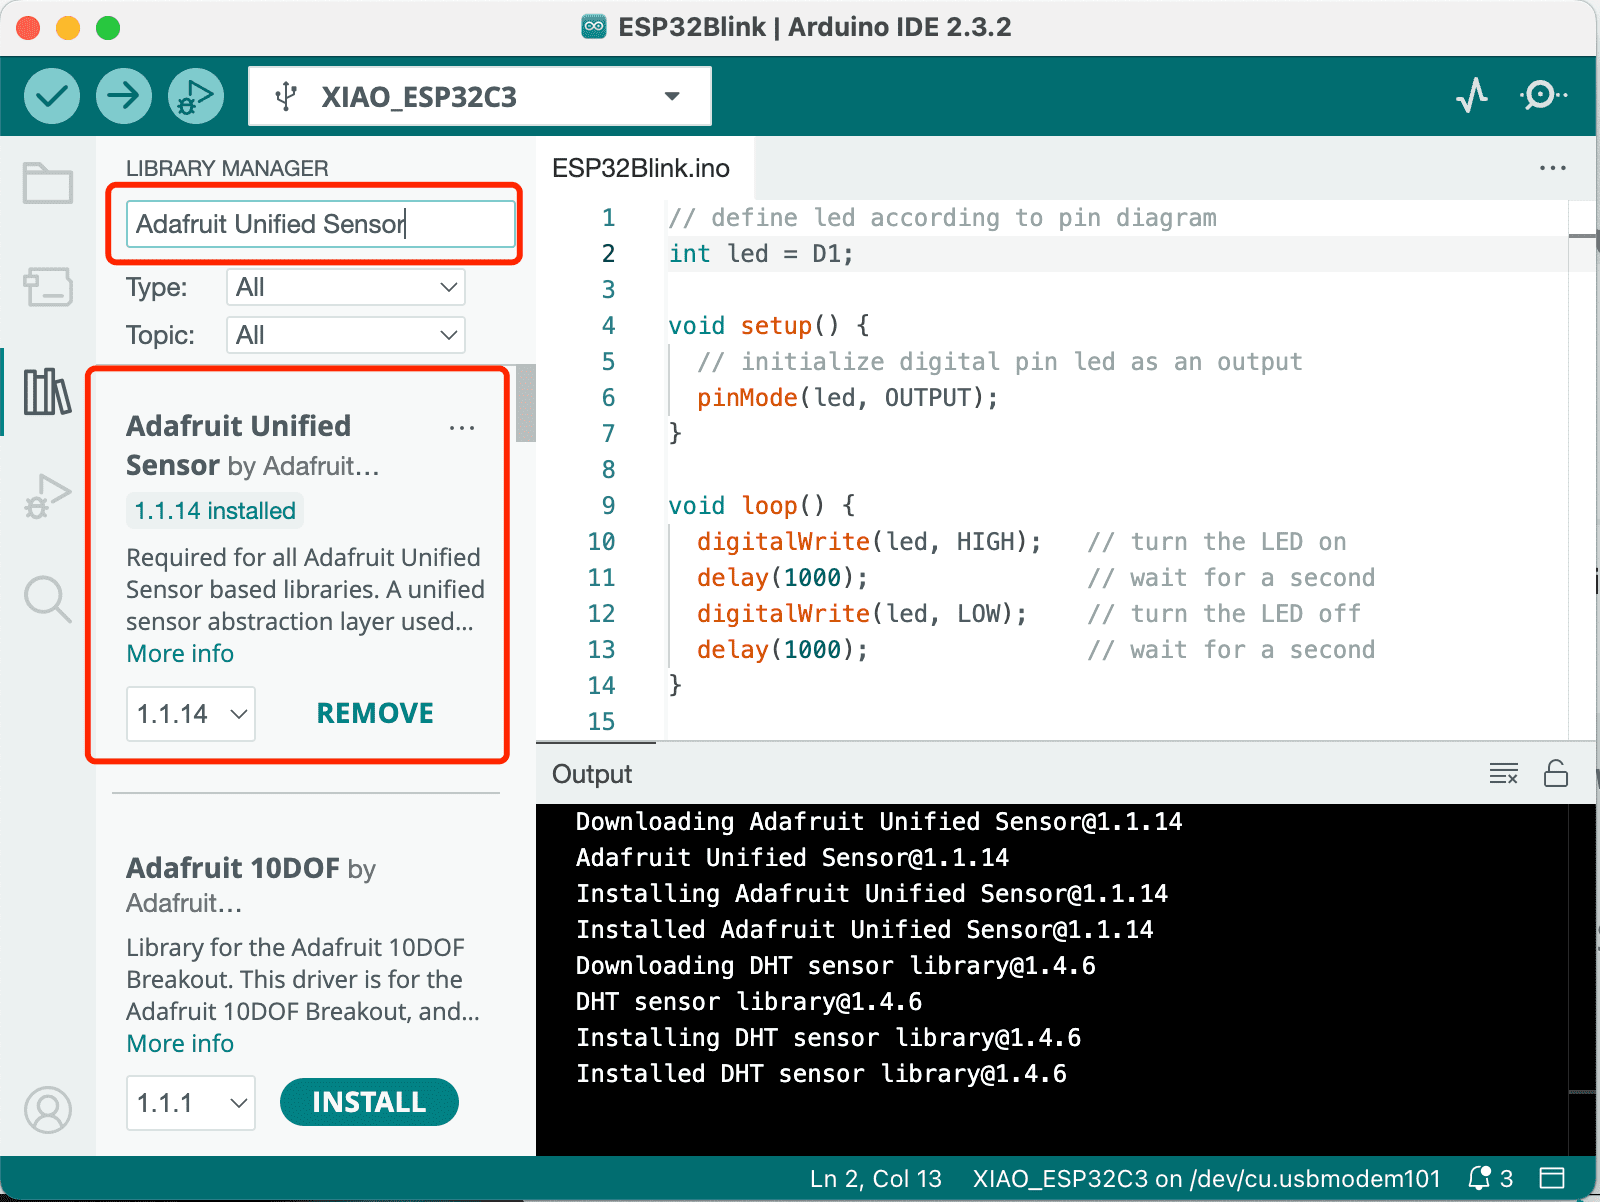
Step3. Add DHT11Library
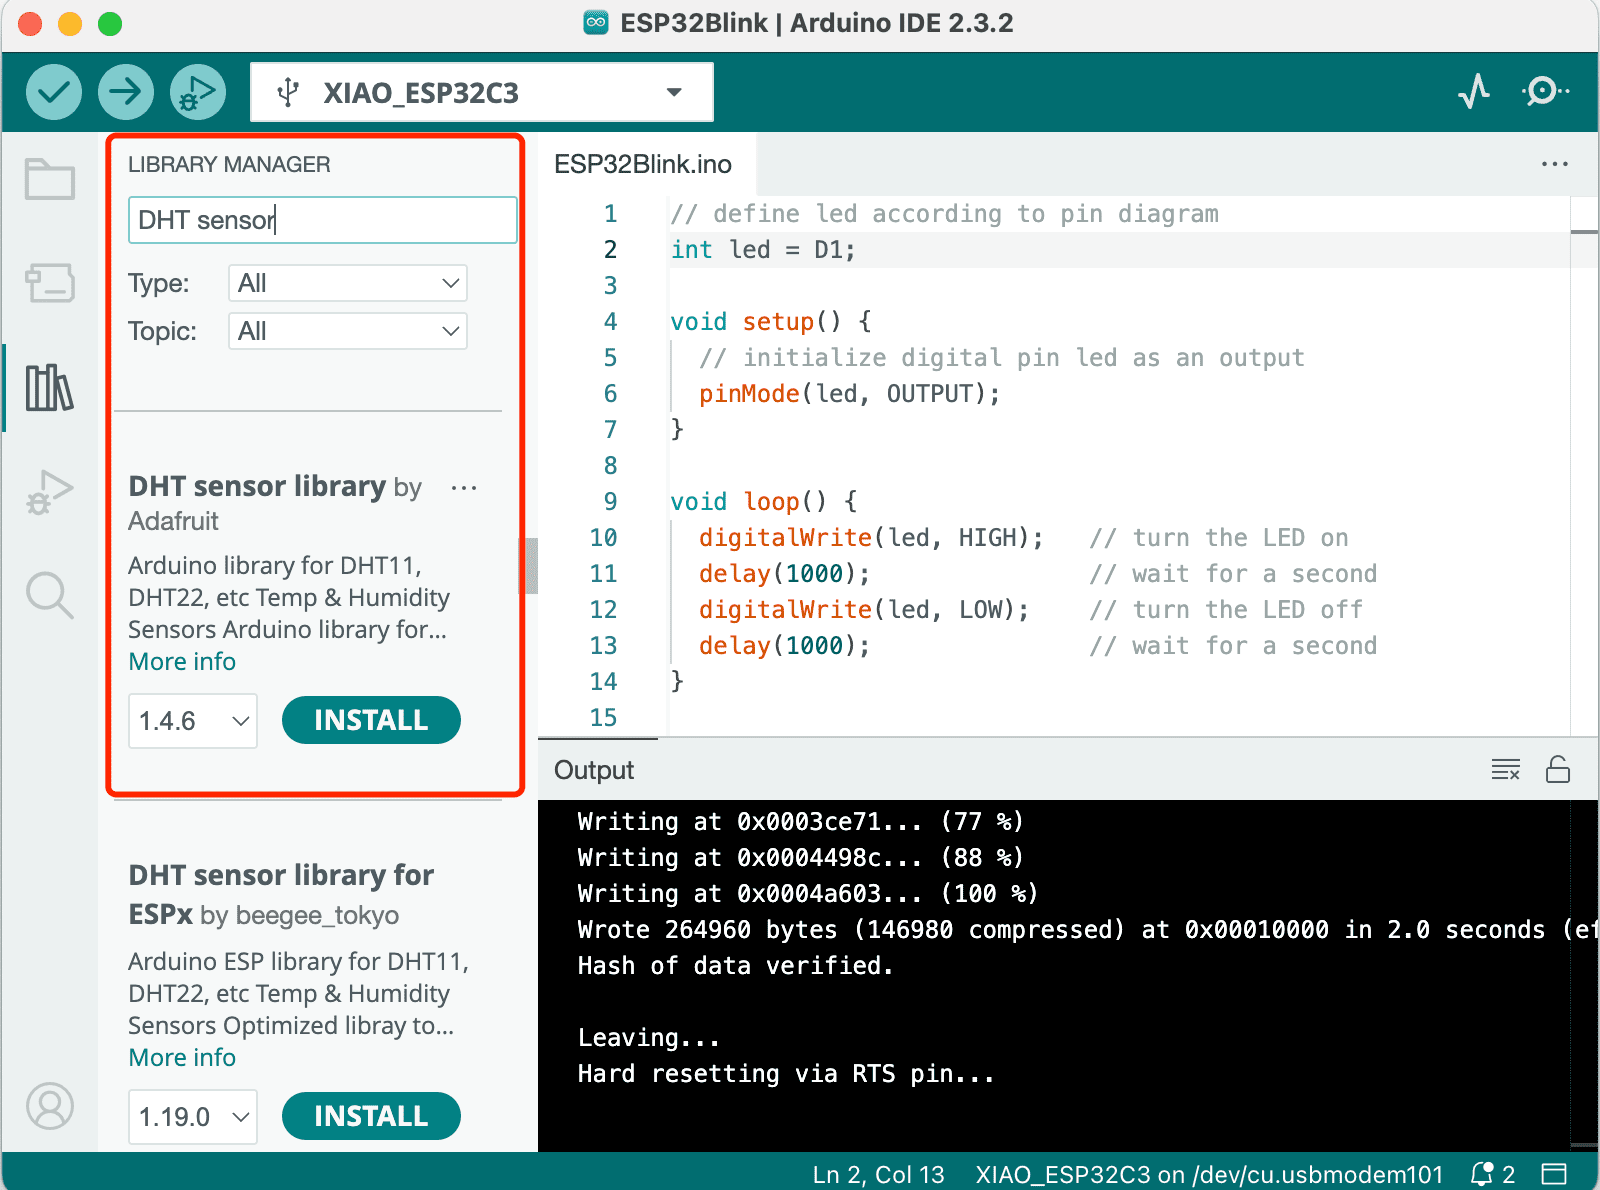
Navigate to Library Manager, search DHT Sensor.
After installing the DHT library from Adafruit, type “Adafruit Unified Sensor” in the search box. Scroll all the way down to find the library and install it.
Step5. Write Code and Make Test.
// Example testing sketch for various DHT humidity/temperature sensors
// Written by ladyada, public domain
// REQUIRES the following Arduino libraries:
// - DHT Sensor Library: https://github.com/adafruit/DHT-sensor-library
// - Adafruit Unified Sensor Lib: https://github.com/adafruit/Adafruit_Sensor
#include "DHT.h"
#define DHTPIN D8 // Digital pin connected to the DHT sensor
#define DHTTYPE DHT11 // DHT 11
DHT dht(DHTPIN, DHTTYPE);
void setup() {
Serial.begin(9600);
Serial.println(F("DHTxx test!"));
dht.begin();
}
void loop() {
// Wait a few seconds between measurements.
delay(2000);
// Reading temperature or humidity takes about 250 milliseconds!
// Sensor readings may also be up to 2 seconds 'old' (its a very slow sensor)
float h = dht.readHumidity();
// Read temperature as Celsius (the default)
float t = dht.readTemperature();
// Read temperature as Fahrenheit (isFahrenheit = true)
float f = dht.readTemperature(true);
// Check if any reads failed and exit early (to try again).
if (isnan(h) || isnan(t) || isnan(f)) {
Serial.println(F("Failed to read from DHT sensor!"));
return;
}
// Compute heat index in Fahrenheit (the default)
float hif = dht.computeHeatIndex(f, h);
// Compute heat index in Celsius (isFahreheit = false)
float hic = dht.computeHeatIndex(t, h, false);
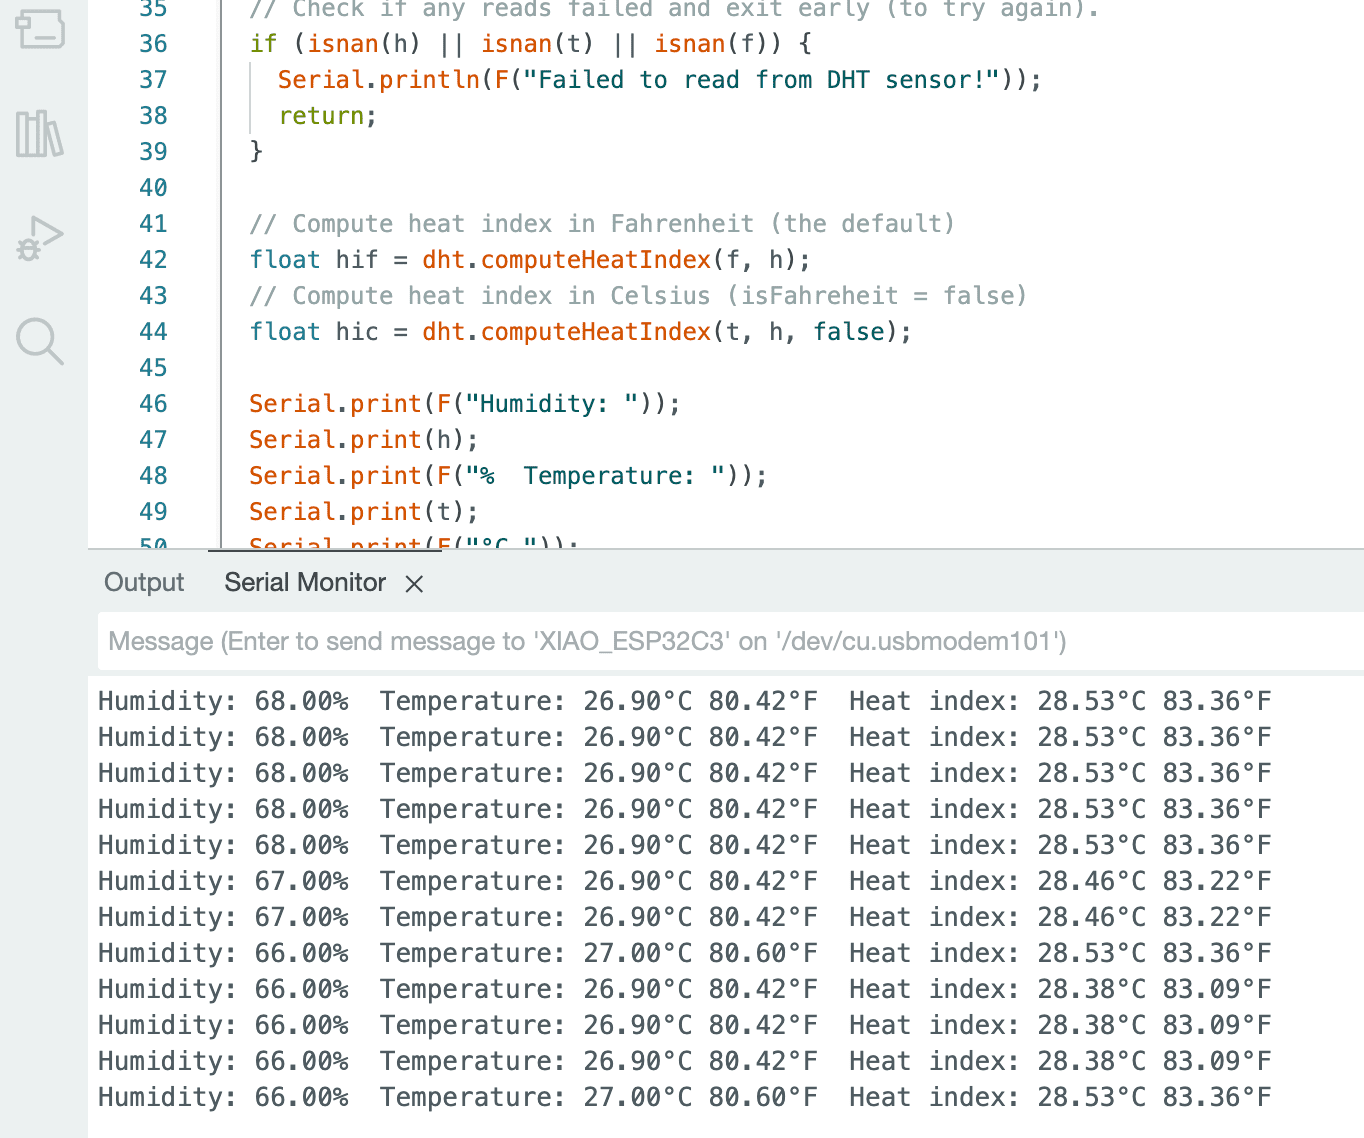
Serial.print(F("Humidity: "));
Serial.print(h);
Serial.print(F("% Temperature: "));
Serial.print(t);
Serial.print(F("°C "));
Serial.print(f);
Serial.print(F("°F Heat index: "));
Serial.print(hic);
Serial.print(F("°C "));
Serial.print(hif);
Serial.println(F("°F"));
}
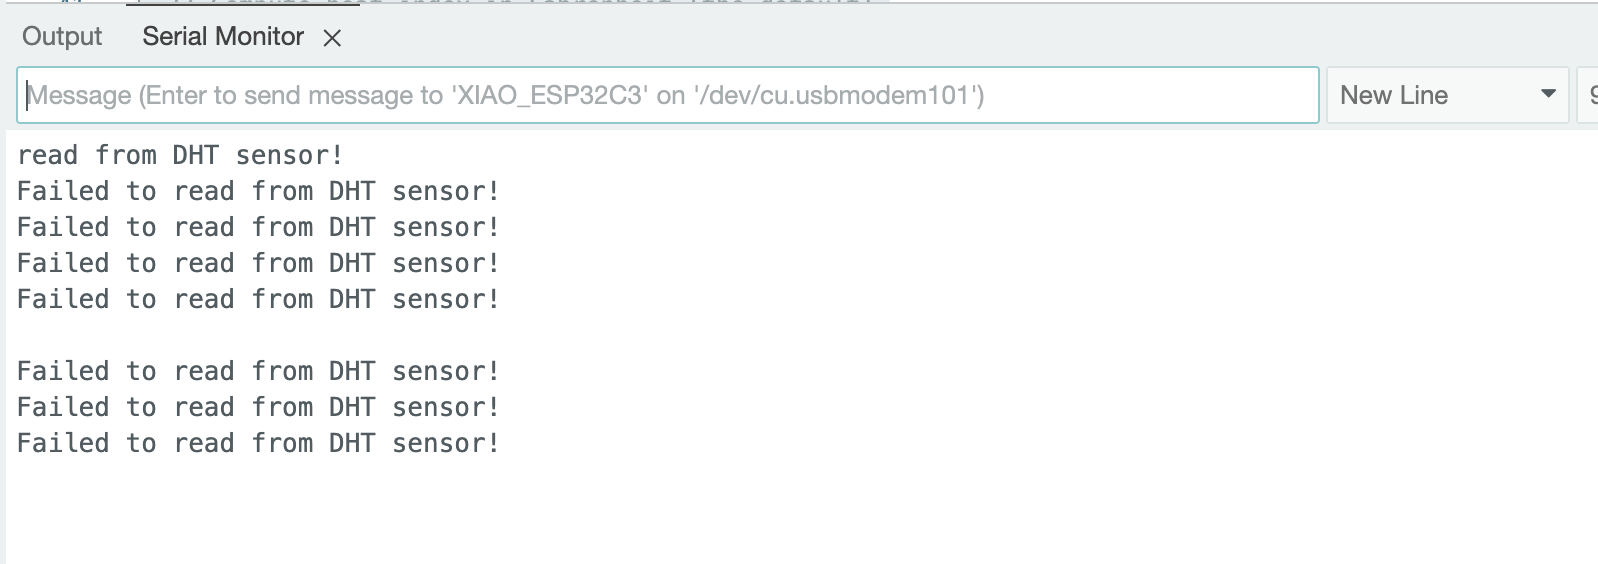
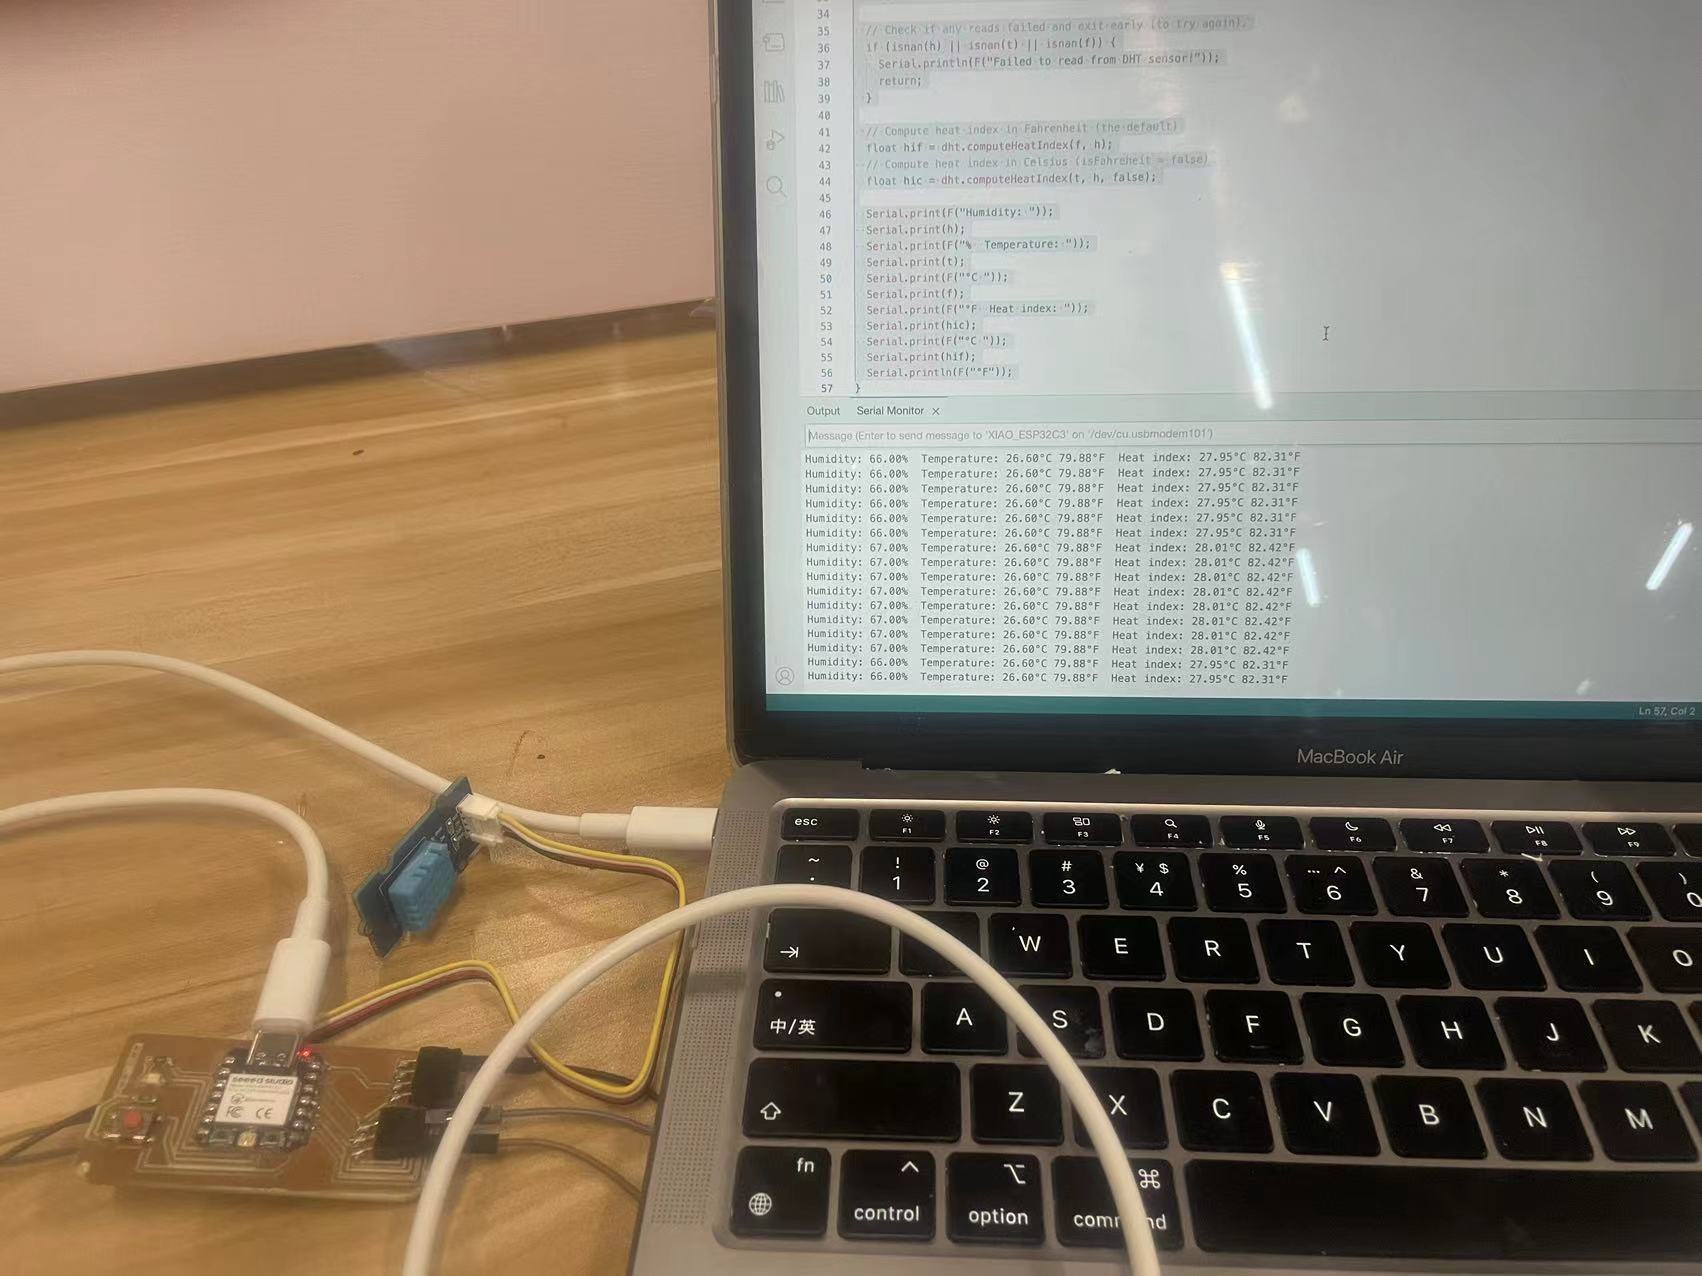
Step5. Upload Code to ESP32C3 and Check Result
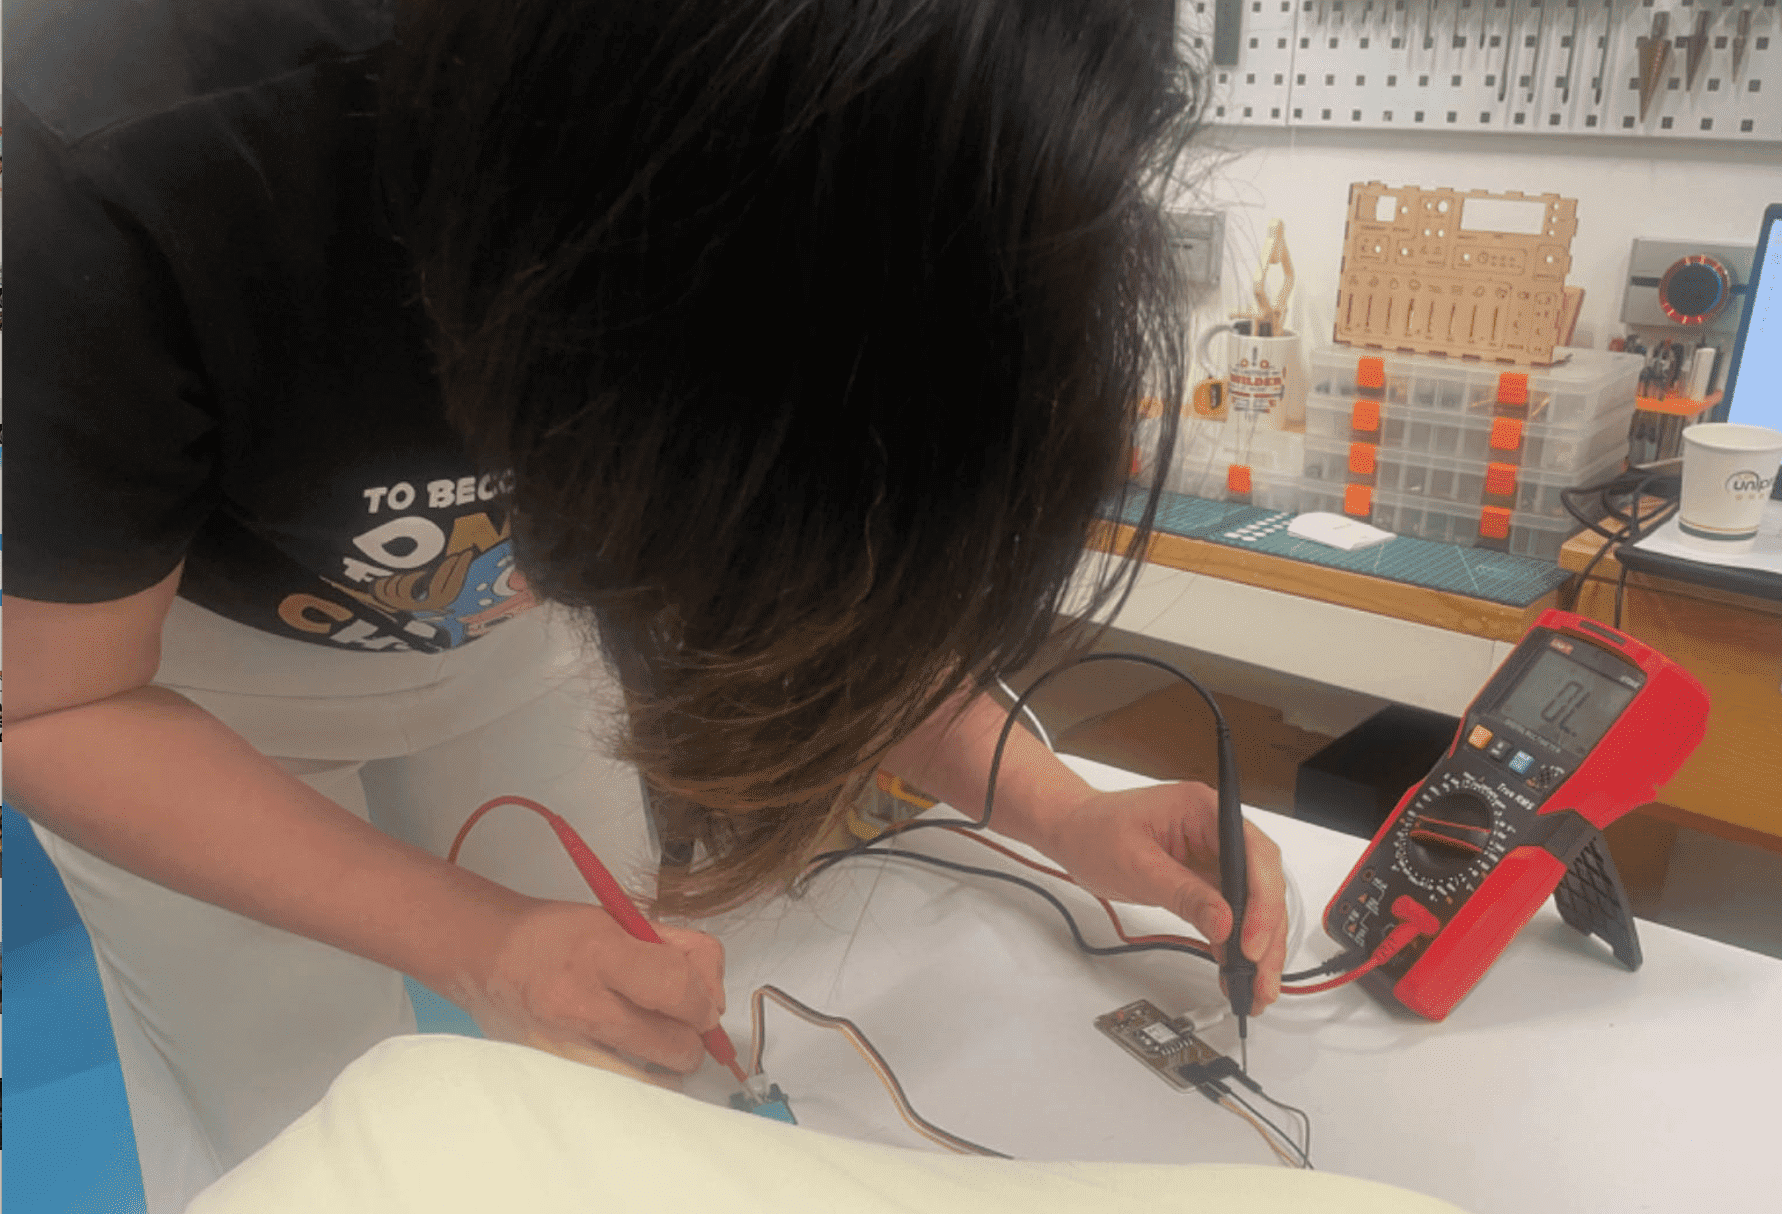
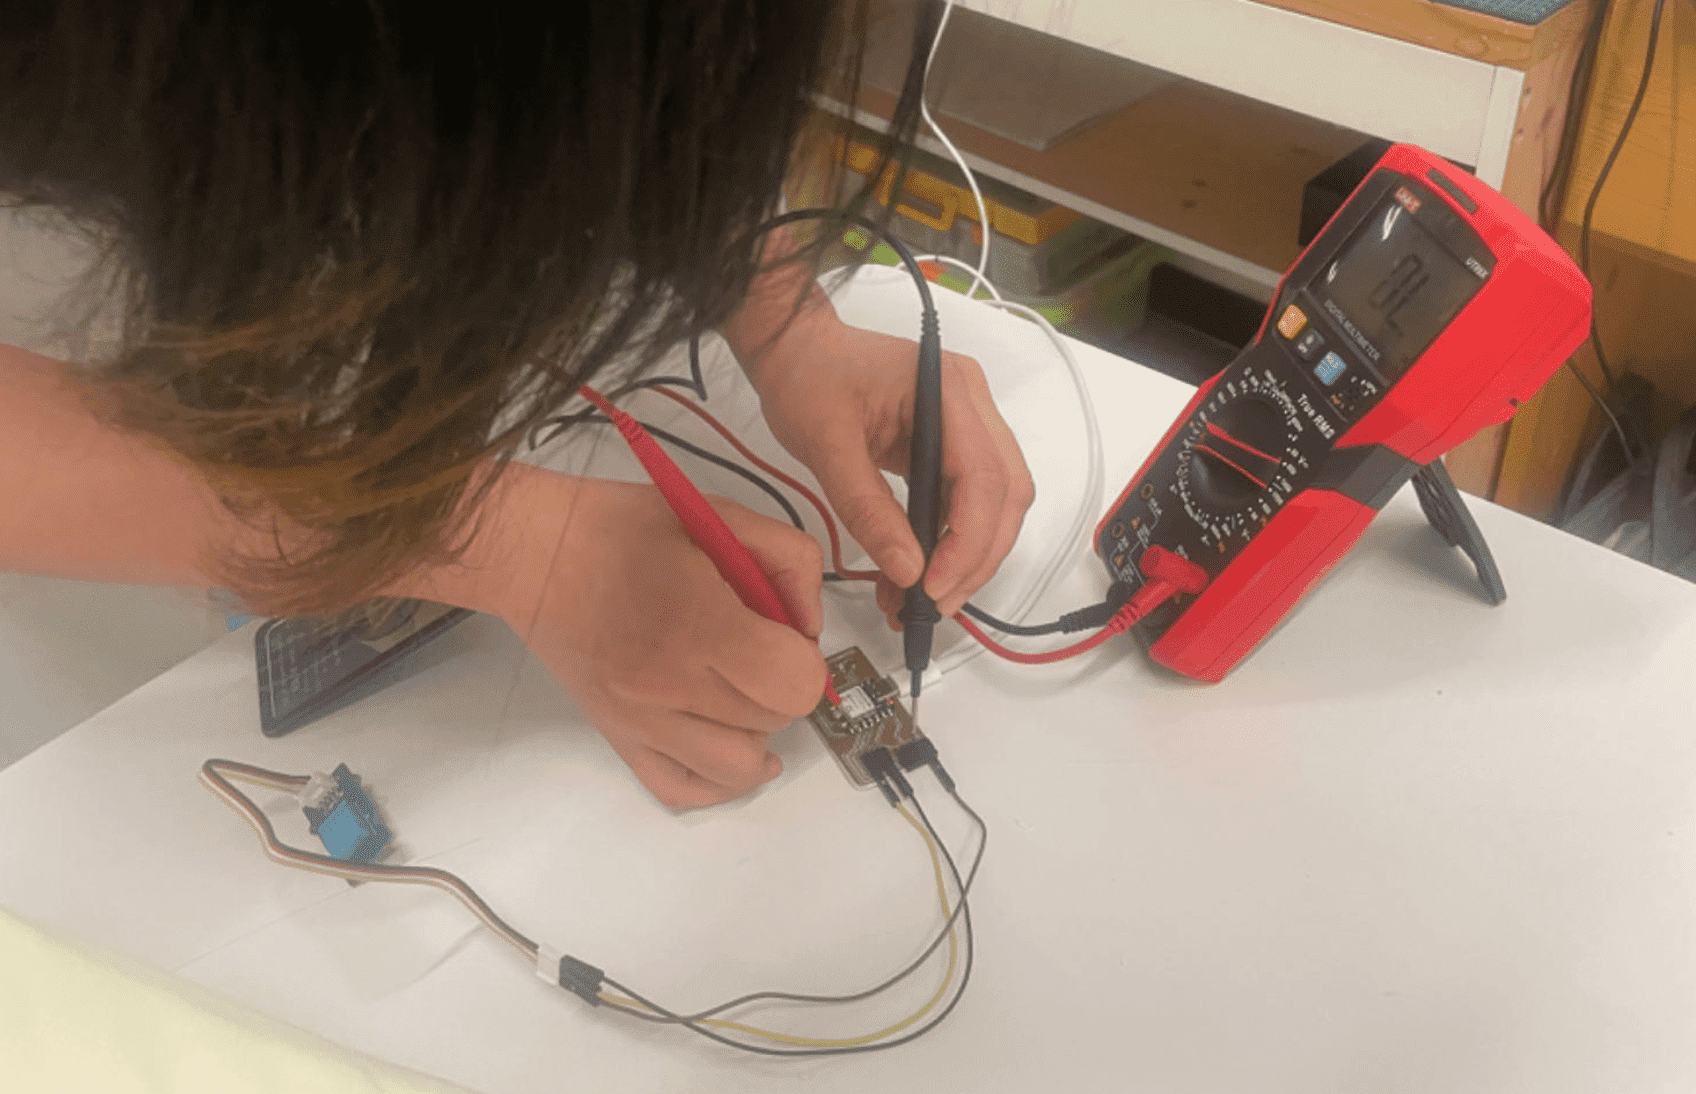
I uploaded the code to ESP32C3, and open the serial monitor to check input data.However I got errors like below:Then I checked the wire connection and found that the data wire was somehow broken. That was why the data couldn't come through.. I changed the wire and finally I got the correct data.