15. Interface and Application Programming
- Group assignment:
Compare as many tool options as possible.
- Individual assignment
Write an application that interfaces a user with an input and/or output device that you made
Group assigment
The task for this week’s group assignment is to compare as many tool options as possible. So let’s begin with comparing some tools(i.e. Processing and websockets) that can be used for this assignment purposes. To begin with I will talk about Processing. I came across Bas’s tutorial. You can check it out it is in great detail and he is an expert in processing thumbs up to him. Bente Talks about WebSockets to communicate with a web-page.
These two techniques have their merits and I will be sharing a few. Processing is great because it is direct. The hardware on your computer can be easily accessed . As long as you keep to the basics it is not hard to learn. Processing uses a main loop function called draw(), it functions much like the loop() function in Arduino. Both environments have a lot of similarities, Arduino is based on the Processing environment.
The draw loop makes it relatively intuitive to get something on the screen and animate it. Processing has simple shape drawing functions, like circle and rect, which makes it a good tool for artists to create computer generated art
Javascript, wether in a web environment or in Node.js takes a different approach. Although Java and Javascript look connected based on the name, they are not. They share as much characteristics as a Car and a Carpet.
Javascript is an event driven language, most of the time you handle events that result from actions you initiated (like loading an image or a video) or events that come from user interaction ( scrolling, like clicking, pressing a key, moving the mouse).
javascript also has drawing functionality that you can use with canvas, to create user interfaces it is common to use html/css. This is a completely different language, that has it’s own history . Using it can be extremely cumbersome as it basically involves translating a graphic design into text and tags.
Individual assignment
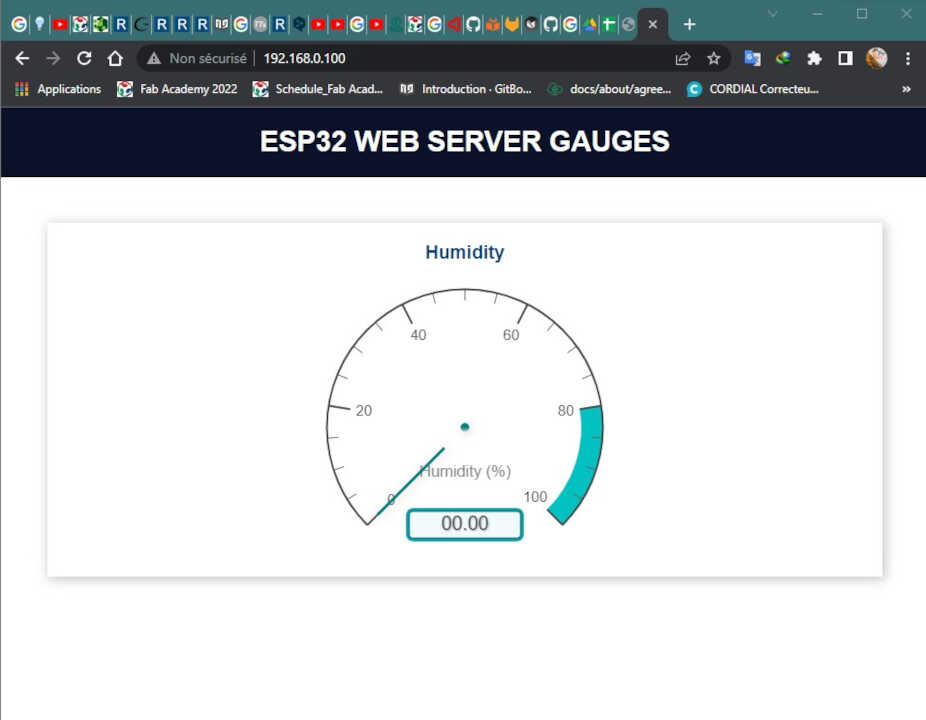
For my assignment this week I will use my card designed for the past assignment on input divice. The board is based on the ESP32 microcontroller. This project will consist of building a web server with ESP32 that will display soil moisture readings. We will create a radial gauge to display the humidity.
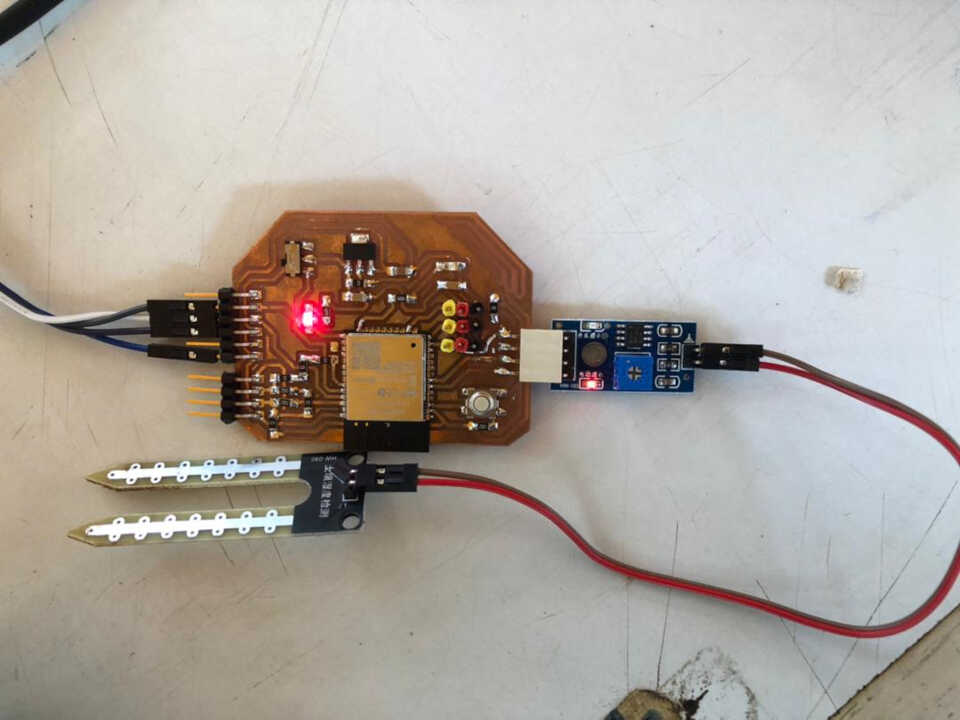
In this situation the router acts as an access point and the ESP32 is set as a station. In this scenario, we need to be connected to your router (local network) to control the ESP32.

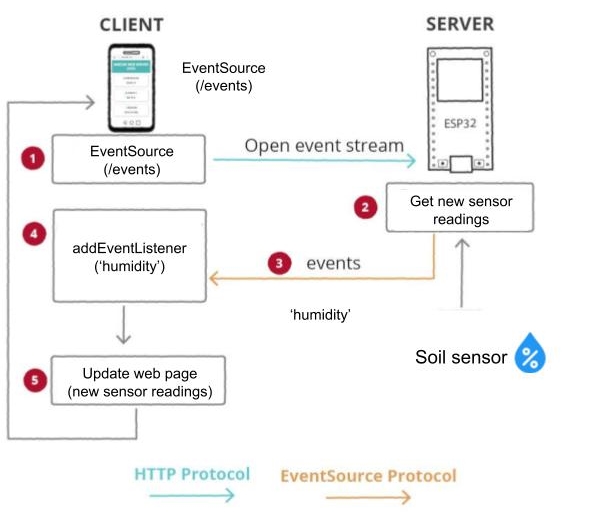
How it Works?
To do this we need to start with some configuration on the arduino software.
the board’s file system (SPIFFS)
To make our project more organized and easier to understand, we will save the HTML, CSS and JavaScript files to build the web page on the map file system (SPIFFS).

The ESP32 contains a serial peripheral interface flash file system (SPIFFS). SPIFFS is a lightweight file system created for microcontrollers with a flash chip, which is connected via the SPI bus, such as the ESP32’s flash memory.
To install SPIFFS, I followed this tutorial that I also recommend
To check if the plugin has been successfully installed, open your Arduino IDE. Select your ESP32 board, go to Tools and check that you have the option “ESP32 Sketch Data Upload”.

File organization
To keep the project organized and make it easier to understand, we will create four files to build the web server:
-
sketch Arduino which manages the web serve ;
-
index.html : to define the content of the web page ;
-
sytle.css : to style the web page ;
-
script.js : to program the web page behavior - manage web server responses, events, create gauges, etc.
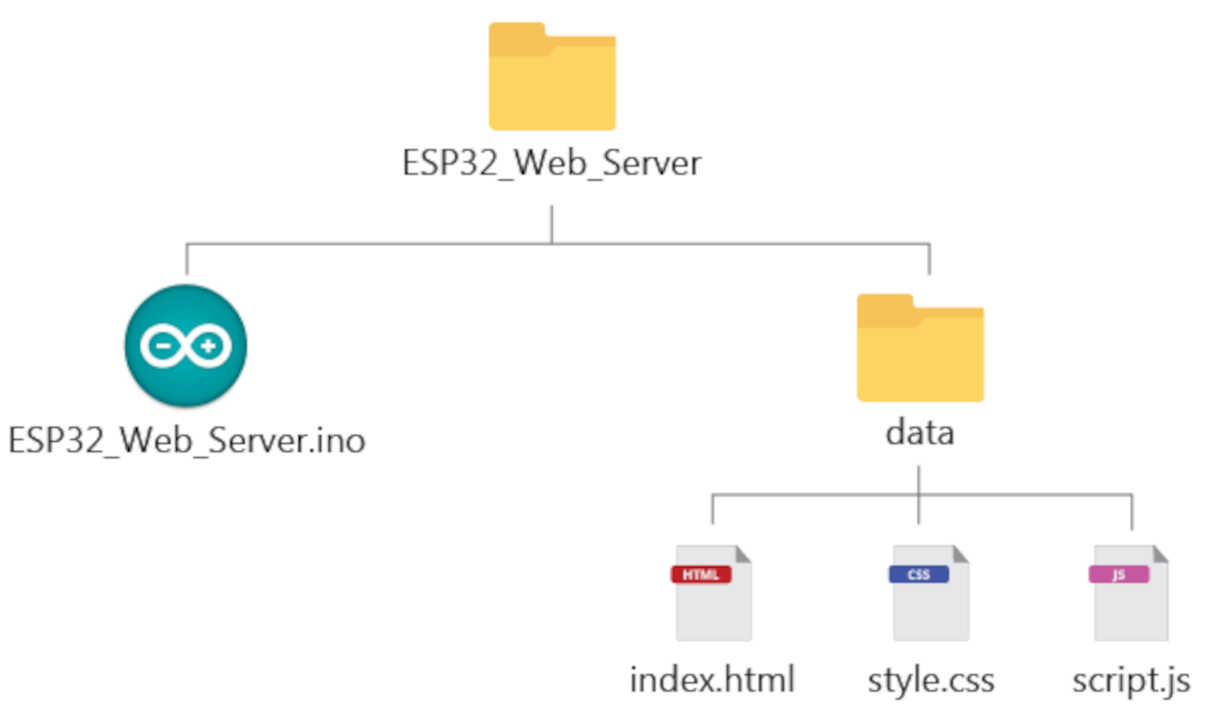
The HTML, CSS and JavaScript files must be saved in a folder called data inside the Arduino sketch folder, as shown in the previous diagram. We will upload these files to the ESP32 file system (SPIFFS).
Arduino programming
To create the web server we need to install some libraries:
-
ESPAsyncWebServer (.zip folder);
-
AsyncTCP (.zip folder)
-
Arduino_JSON library by Arduino version 0.1.0 (Arduino Library Manager)
The ESPAsyncWebServer and AsynTCP libraries aren’t available to install through the Arduino Library Manager, so you need to copy the library files to the Arduino Installation Libraries folder. Alternatively, download the libraries’ .zip folders, and then, in your Arduino IDE, go to Sketch > Include Library > Add .zip Library and select the libraries you’ve just downloaded.
#include <WiFi.h>
#include <AsyncTCP.h>
#include <ESPAsyncWebServer.h>
We’ll use SPIFFS to save the files to build the web server.
#include "SPIFFS.h"
- Network Credentials
Insert your network credentials in the following variables, so that the ESP32 can connect to your local network using Wi-Fi.
const char* ssid = "REPLACE_WITH_YOUR_SSID";
const char* password = "REPLACE_WITH_YOUR_PASSWORD";
- AsyncWebServer and AsyncEventSource
Create an AsyncWebServer object on port 80.
AsyncWebServer server(80);
The following line creates a new event source on /events.
AsyncEventSource events("/events");
- Declaring Variables
The lastTime and the timerDelay variables will be used to update sensor readings every X number of seconds. As an example, we’ll get new sensor readings every 30 seconds (30000 milliseconds). You can change that delay time in the timerDelaym variable.
unsigned long lastTime = 0;
unsigned long timerDelay = 30000;
Declaration of the humidity sensor
int sensor_pin = 34;
The getSensorReadings() function gets the sensor readings and saves them on the readings JSON array.
// Get Sensor Readings and return JSON object
String getSensorReadings(){
  int value=map(analogRead(sensor_pin), 4095, 0, 0, 100);
  readings["humidity"] =  String(value);
  String jsonString = JSON.stringify(readings);
  return jsonString;
}
The readings array is then converted into a JSON string variable using the stringify() method and saved on the jsonString variable.
The function returns the jsonString variable with the current sensor readings. The JSON string has the following format (the values are just arbitrary numbers for explanation purposes).
{
  "humidity" : "50"
}
- Initialize SPIFFS
void initSPIFFS() {
  if (!SPIFFS.begin()) {
    Serial.println("An error has occurred while mounting SPIFFS");
  }
  Serial.println("SPIFFS mounted successfully");
}
- Initialize Wi-Fi The following function sets the ESP32 as a Wi-Fi station and connects to your router using the ssid and password defined earlier.
void initWiFi() {
  WiFi.mode(WIFI_STA);
  WiFi.begin(ssid, password);
  Serial.print("Connecting to WiFi ..");
  while (WiFi.status() != WL_CONNECTED) {
    Serial.print('.');
    delay(1000);
  }
  Serial.println(WiFi.localIP());
  ```

- *setup()*

In the `setup()`, we initialize the Serial Monitor, Wi-Fi, filesystem
```cpp
  void setup() {
  // Serial port for debugging purposes
  Serial.begin(115200);
  initWiFi();
  initSPIFFS();
  ```

- *Handle Requests*

When we access the ESP32 IP address on the root `/` URL, we send the text that is stored on the `index.html` file to build the web page.

```cpp
server.on("/", HTTP_GET, [](AsyncWebServerRequest *request){
  request->send(SPIFFS, "/index.html", "text/html");
});
Serve the other static files requested by the client (style.css and script.js).
server.serveStatic("/", SPIFFS, "/");
Send the JSON string with the current sensor readings when you receive a request on the /readings URL.
// Request for the latest sensor readings
server.on("/readings", HTTP_GET, [](AsyncWebServerRequest *request){
  String json = getSensorReadings();
  request->send(200, "application/json", json);
  json = String();
});
The json variable holds the return from the getSensorReadings() function. To send a JSON string as response, the send() method accepts as first argument the response code (200), the second is the content type (“application/json”) and finally the content (json variable).
- Server Event Source Set up the event source on the server.
events.onConnect([](AsyncEventSourceClient *client){
  if(client->lastId()){
    Serial.printf("Client reconnected! Last message ID that it got is: %u\n", client->lastId());
  }
  // send event with message "hello!", id current millis
  // and set reconnect delay to 1 second
  client->send("hello!", NULL, millis(), 10000);
});
server.addHandler(&events);
Finally, start the server.
server.begin();
- loop()
In the loop(), send events to the browser with the newest sensor readings to update the web page every 30 seconds.
events.send("ping",NULL,millis());
events.send(getSensorReadings().c_str(),"new_readings" ,millis());
Use the send() method on the events object and pass as an argument the content you want to send and the name of the event. In this case, we want to send the JSON string returned by the getSensorReadings() function. The send() method accepts a variable of type char, so we need to use the c_str() method to convert the variable. The name of the events is new_readings.
Usually, we also send a ping message every X number of seconds. That line is not mandatory. It is used to check on the client side that the server is alive.
events.send("ping",NULL,millis());
HTML
In HTML file for this project we includes the JavaScript canvas-gauges library in the head of the HTML file:
<script src="https://cdn.rawgit.com/Mikhus/canvas-gauges/gh-pages/download/2.1.7/all/gauge.min.js"></script>
There is <canvas> tag with the id gauge-humidity, where we’ll render the humidity gauge later on.
<canvas id="gauge-humidity"></canvas>
- Complet htlm code
<!DOCTYPE html>
<html>
  <head>
    <title>Pacome IOT DASHBOARD</title>
    <meta name="viewport" content="width=device-width, initial-scale=1">
    <link rel="icon" type="image/png" href="favicon.png">
    <link rel="stylesheet" href="https://use.fontawesome.com/releases/v5.7.2/css/all.css" integrity="sha384-fnmOCqbTlWIlj8LyTjo7mOUStjsKC4pOpQbqyi7RrhN7udi9RwhKkMHpvLbHG9Sr" crossorigin="anonymous">
    <link rel="stylesheet" type="text/css" href="style.css">
    <script src="http://cdn.rawgit.com/Mikhus/canvas-gauges/gh-pages/download/2.1.7/all/gauge.min.js"></script>
  </head>
  <body>
    <div class="topnav">
      <h1>ESP32 WEB SERVER GAUGES</h1>
    </div>
    <div class="content">
      <div class="card-grid">
        <div class="card">
          <p class="card-title">Humidity</p>
          <canvas id="gauge-humidity"></canvas>
        </div>
      </div>
    </div>
    <script src="script.js"></script>
  </body>
</html>
CSS
html {
  font-family: Arial, Helvetica, sans-serif;
  display: inline-block;
  text-align: center;
}
h1 {
  font-size: 1.8rem;
  color: white;
}
p {
  font-size: 1.4rem;
}
.topnav {
  overflow: hidden;
  background-color: #0A1128;
}
body {
  margin: 0;
}
.content {
  padding: 5%;
}
.card-grid {
  max-width: 1200px;
  margin: 0 auto;
  display: grid;
  grid-gap: 2rem;
  grid-template-columns: repeat(auto-fit, minmax(200px, 1fr));
}
.card {
  background-color: white;
  box-shadow: 2px 2px 12px 1px rgba(140,140,140,.5);
}
.card-title {
  font-size: 1.2rem;
  font-weight: bold;
  color: #034078
}
JavaScript (creating the gauges)
In the javascript code we will follow these different steps:
- initializing the event source protocol;
- adding an event listener for the new_readings event;
- creating the gauges;
- getting the latest sensor readings from the new_readings event and display them in the corresponding gauges;
- making an HTTP GET request for the current sensor readings when you access the web page for the first time.
Get Readings
When you access the web page for the first time, we’ll request the server to get the current sensor readings. Otherwise, we would have to wait for new sensor readings to arrive (via Server-Sent Events), which can take some time depending on the interval that you set on the server.
Add an event listener that calls the getReadings function when the web page loads.
// Get current sensor readings when the page loads
window.addEventListener('load', getReadings);
The window object represents an open window in a browser. The addEventListener() method sets up a function to be called when a certain event happens. In this case, we’ll call the getReadings function when the page loads (‘load’) to get the current sensor readings.
Now, let’s take a look at the getReadings function. Create a new XMLHttpRequest object. Then, send a GET request to the server on the /readings URL using the open() and send() methods.
function getReadings() {
  var xhr = new XMLHttpRequest();
  xhr.open("GET", "/readings", true);
  xhr.send();
}
When we send that request, the ESP will send a response with the required information. So, we need to handle what happens when we receive the response. We’ll use the onreadystatechange property that defines a function to be executed when the readyState property changes. The readyState property holds the status of the XMLHttpRequest. The response of the request is ready when the readyState is 4, and the status is 200.
readyState= 4 means that the request finished and the response is ready;status= 200 means “OK”
So, the request should look something like this:
function getStates(){
  var xhr = new XMLHttpRequest();
  xhr.onreadystatechange = function() {
    if (this.readyState == 4 && this.status == 200) {
      … DO WHATEVER YOU WANT WITH THE RESPONSE …
    }
  };
  xhr.open("GET", "/states", true);
  xhr.send();
}
The response sent by the ESP is the following text in JSON format (those are just arbitrary values).
{
  "humidity" : "64.01",
}
We need to convert the JSON string into a JSON object using the parse() method. The result is saved on the myObj variable.
var myObj = JSON.parse(this.responseText);
The myObj variable is a JSON object that contains the humidity reading. We want to update the gauges values with the corresponding readings.
Updating the value of a gauge is straightforward. For example, our humidty gauge is called gaugeHum (as we’ll see later on), to update a value, we can simply call: gaugeHum.value = NEW_VALUE. In our case, the new value is the temperature reading saved on the myObj JSON object.
gaugeHum.value = myObj.humidity;
Here’s the complete getReadings() function.
function getReadings(){
  var xhr = new XMLHttpRequest();
  xhr.onreadystatechange = function() {
    if (this.readyState == 4 && this.status == 200) {
      var myObj = JSON.parse(this.responseText);
      console.log(myObj);
      var hum = myObj.humidity;
      gaugeHum.value = hum;
    }
  };
  xhr.open("GET", "/readings", true);
  xhr.send();
}
Creating the Gauges
The canvas-charts library allows you to build linear and radial gauges to display your readings. It provides several examples, and it is very simple to use. We recommend taking a look at the documentation and exploring all the gauges functionalities:
HUumidity Gauge
The following lines create the gauge to display the humidity.
// Create Humidity Gauge
var gaugeHum = new RadialGauge({
  renderTo: 'gauge-humidity',
  width: 300,
  height: 300,
  units: "Humidity (%)",
  minValue: 0,
  maxValue: 100,
  colorValueBoxRect: "#049faa",
  colorValueBoxRectEnd: "#049faa",
  colorValueBoxBackground: "#f1fbfc",
  valueInt: 2,
  majorTicks: [
      "0",
      "20",
      "40",
      "60",
      "80",
      "100"

  ],
  minorTicks: 4,
  strokeTicks: true,
  highlights: [
      {
          "from": 80,
          "to": 100,
          "color": "#03C0C1"
      }
  ],
  colorPlate: "#fff",
  borderShadowWidth: 0,
  borders: false,
  needleType: "line",
  colorNeedle: "#007F80",
  colorNeedleEnd: "#007F80",
  needleWidth: 2,
  needleCircleSize: 3,
  colorNeedleCircleOuter: "#007F80",
  needleCircleOuter: true,
  needleCircleInner: false,
  animationDuration: 1500,
  animationRule: "linear"
}).draw();
To create a new radial gauge, use the new RadialGauge() method and pass as an argument the properties of the gauge.
var gaugeTemp = new RadialGauge({
In the next line, define where you want to put the chart (it must be a <canvas> element). In our example, we want to place it in the <canvas> HTML element with the gauge-temperature id—see the HTML file section.
renderTo: 'gauge-humidity',
Then, we define other properties to customize our gauge. The names are self-explanatory, but we recommend taking a look at all possible configurations and changing the gauge to meet your needs.
In the end, you need to apply the draw() method to actually display the gauge on the canvas.
}).draw();
Special attention that if you need to change the gauge range, you need to change the minValue and maxValue properties:
minValue: 0,
maxValue: 100,
You also need to adjust the majorTicks values for the values displayed on the axis.
majorTicks: [
      "0",
      "20",
      "40",
      "60",
      "80",
      "100"

  ],
Handle events
Update the readings on the gauge when the client receives the readings on the new_readings event
Create a new EventSource object and specify the URL of the page sending the updates. In our case, it’s /events.
if (!!window.EventSource) {
  var source = new EventSource('/events');
  ```

Once you’ve instantiated an event source, you can start listening for messages from the server with addEventListener().

These are the default event listeners, as shown here in the AsyncWebServer documentation.

```javascript
source.addEventListener('open', function(e) {
  console.log("Events Connected");
}, false);

source.addEventListener('error', function(e) {
  if (e.target.readyState != EventSource.OPEN) {
    console.log("Events Disconnected");
  }
}, false);

source.addEventListener('message', function(e) {
  console.log("message", e.data);
}, false);
Then, add the event listener for new_readings.
source.addEventListener('new_readings', function(e) {
When new readings are available, the ESP32 sends an event (new_readings) to the client. The following lines handle what happens when the browser receives that event.
source.addEventListener('new_readings', function(e) {
  console.log("new_readings", e.data);
  var myObj = JSON.parse(e.data);
  console.log(myObj);
  gaugeHum.value = myObj.humidity;
}, false);
Basically, print the new readings on the browser console, convert the data into a JSON object and display the readings on the corresponding gauges.
Uploading Code and Files
After inserting your network credentials, save the code. Go to Sketch > Show Sketch Folder, and create a folder called data.

After uploading the code, you need to upload the files. Go to Tools > ESP32 Data Sketch Upload and wait for the files to be uploaded.

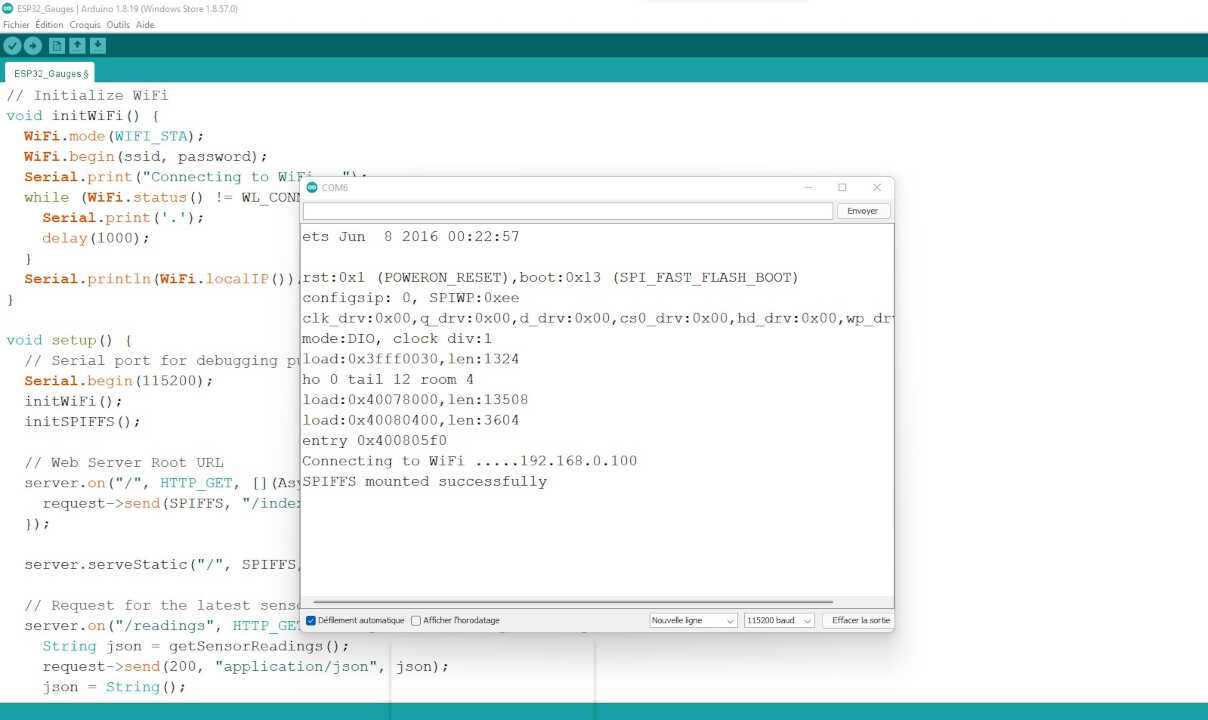
When everything is successfully uploaded, open the Serial Monitor at a baud rate of 115200. Press the ESP32 EN/RST button, and it should print the ESP32 IP address.
Project File
What went wrong/What went well
For this week’s assignment everything went well. I had already worked on a similar interface in the past so everything went smoothly.🤗