14. Interface and application programming
Real-Time Water Flow Monitoring System
Assignment Goal
write an application that interfaces a user with an input &/or output device that you made
Overview
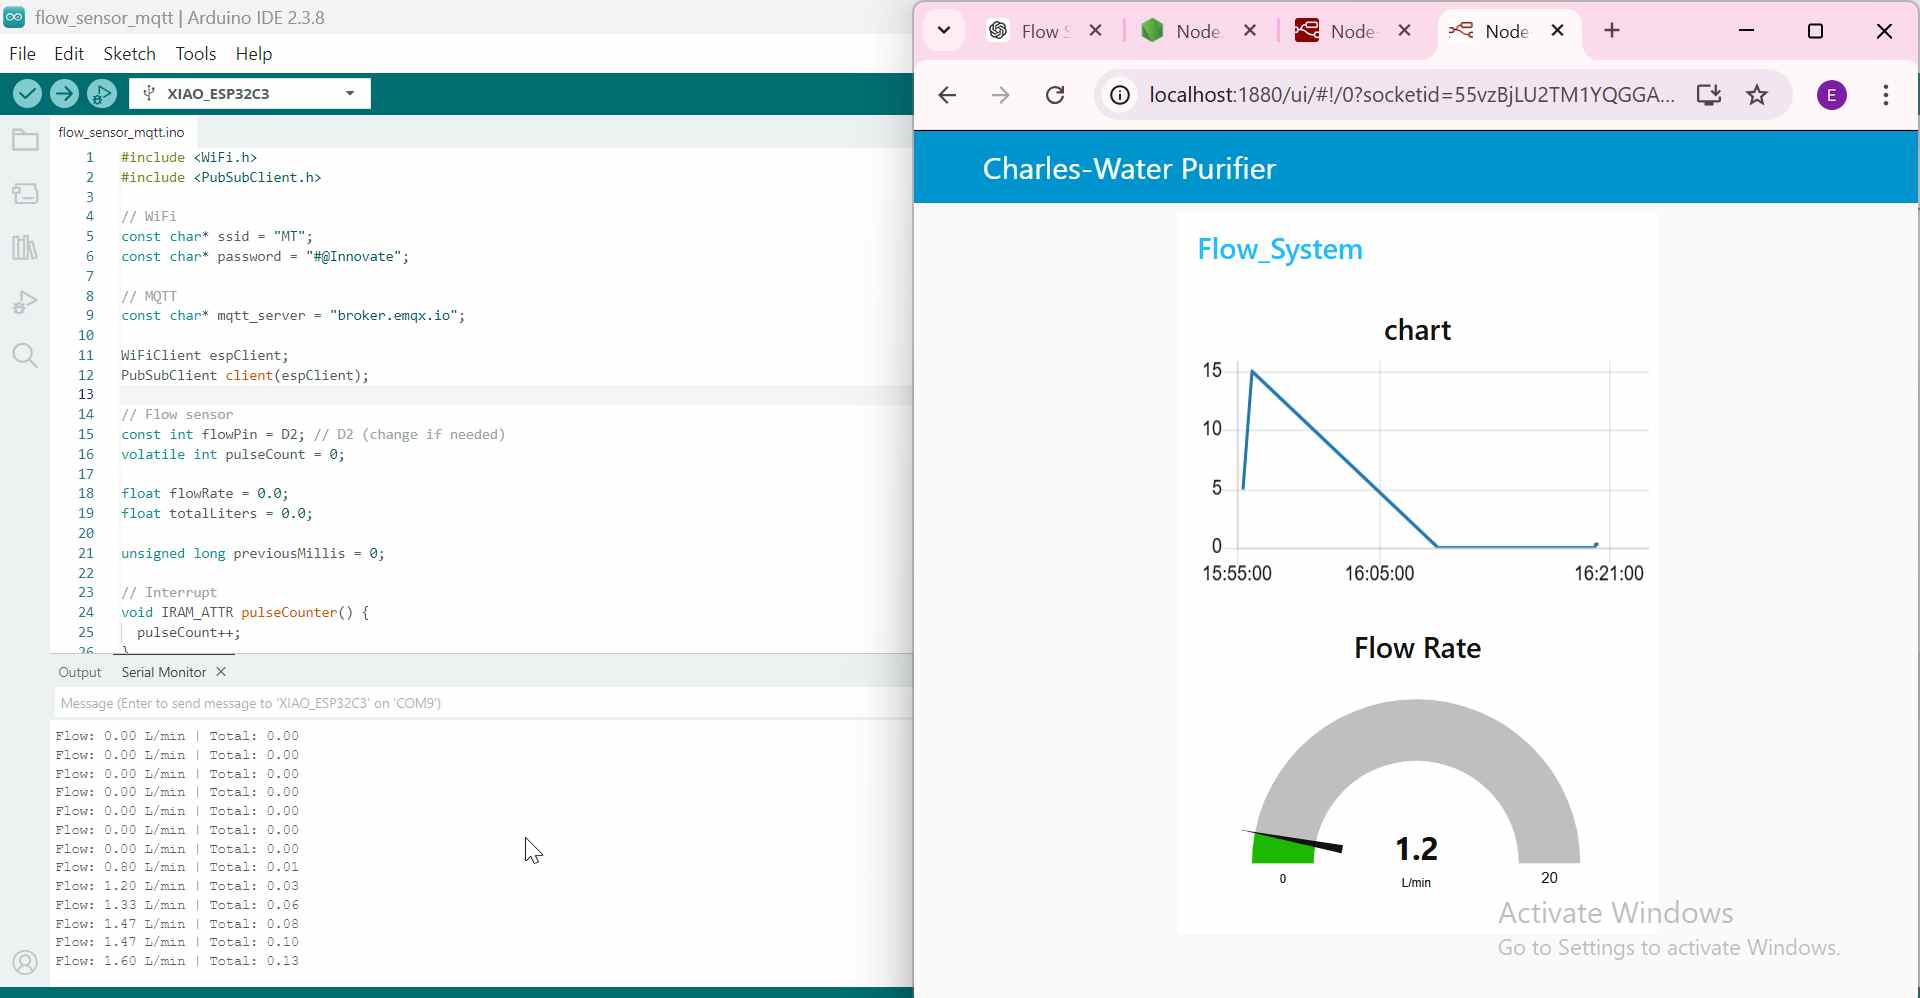
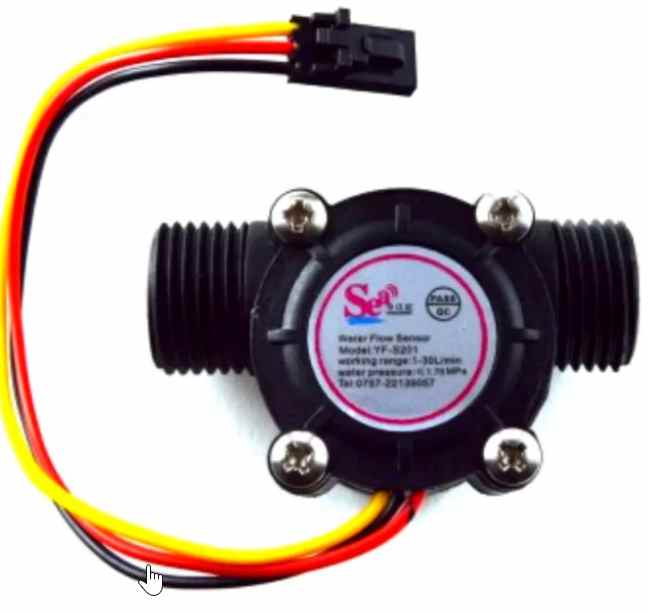
I want to make a radial graphic that shows the increase and decrease of water flow rate system that reads water flow data using flow rate sensor, processes it with an seed xia-ESP32-C3, communicates via MQTT, and visualizes it on a Node-RED dashboard.
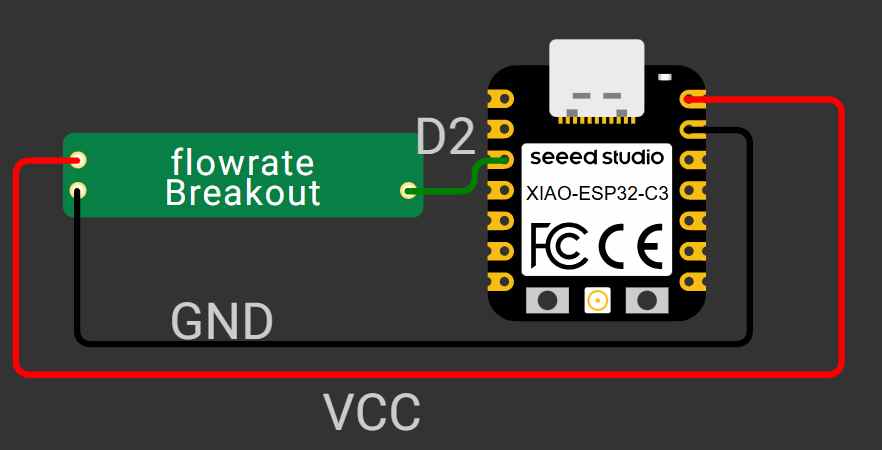
Circuit Diagram
Software Setup
Installing Node.js
Before installing Node-RED, I first installed Node.js.
Node.js is a JavaScript runtime that allows JavaScript programs to run outside a web browser. It is required to run applications such as Node-RED on a computer
Node.js is needed because Node-RED runs on it. Without Node.js, Node-RED cannot be installed or started.
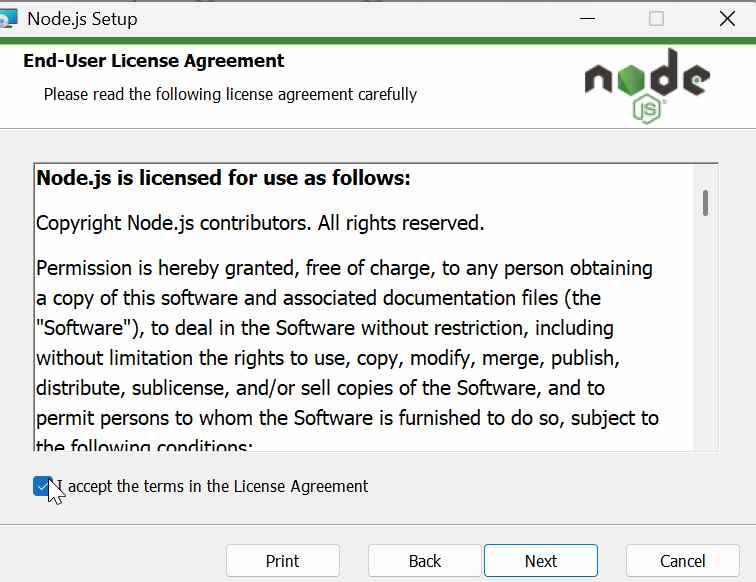
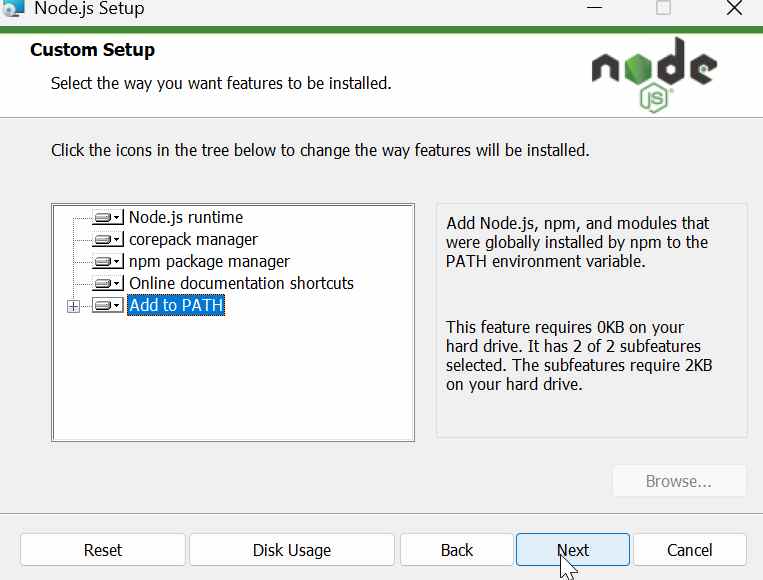
I downloaded the LTS (Long-Term Support) version from the official Node.js website and completed the installation.
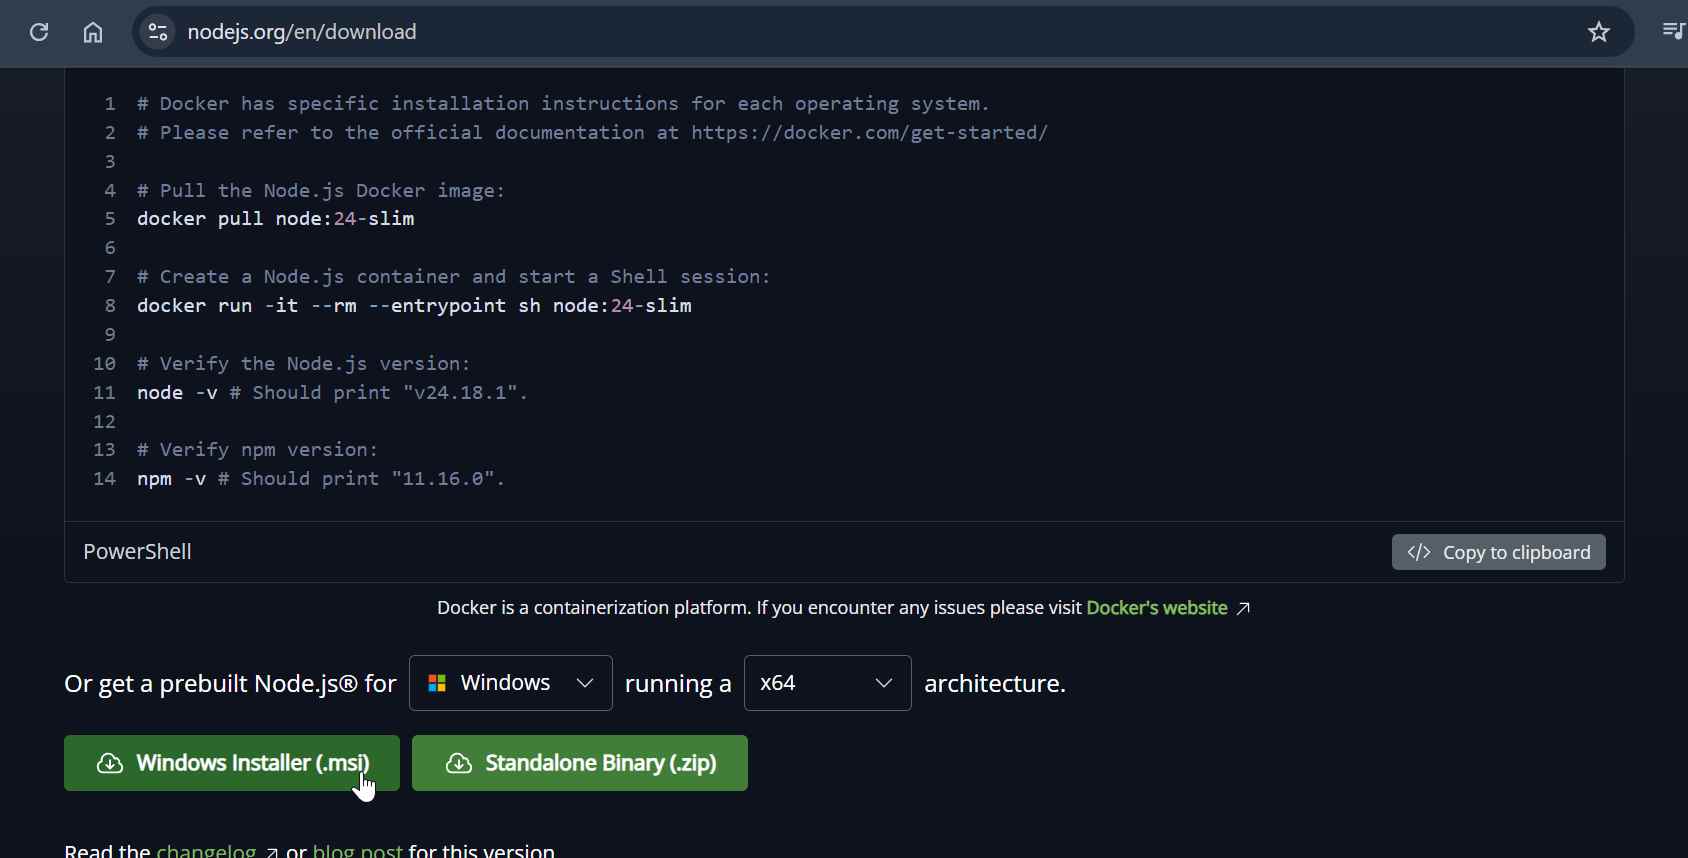
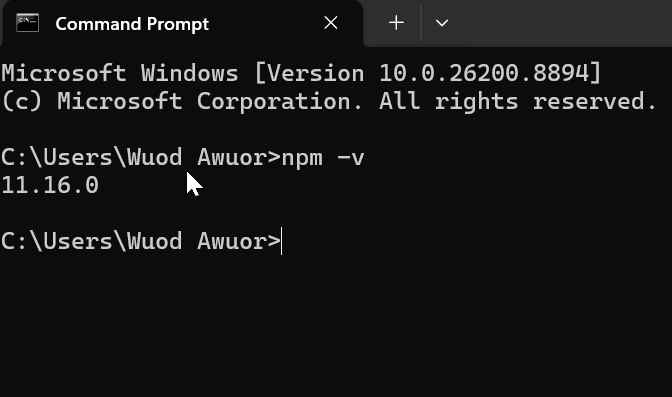
After the installation, I opened Windows Terminal and checked that Node.js had been installed correctly by running:
node -v
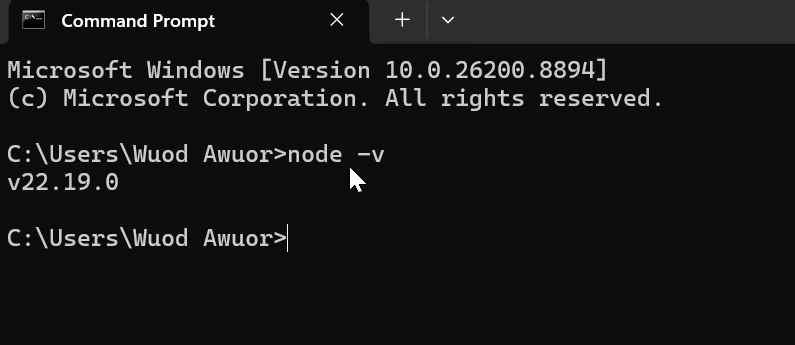
If the installation is successful, the terminal displays the installed version.
npm
npm is a package manager that comes with Node.js and is used to install and manage JavaScript packages. In this project, it was used to install Node-RED and its dashboard components.
When Node.js is installed, npm (Node Package Manager) is installed automatically. npm is used to download and install software packages. In this assignment, I used npm to install Node-RED.
To confirm that npm was installed correctly, I ran:
npm -v
Installing Node-RED
Node-RED is a flow-based programming tool used to connect hardware devices, APIs, and online services. In this project, it was used to subscribe to MQTT data from the ESP32 and display it on a real-time dashboard.
With Node.js and npm installed, I installed Node-RED by running the following command in Windows Terminal:
npm install -g node-red
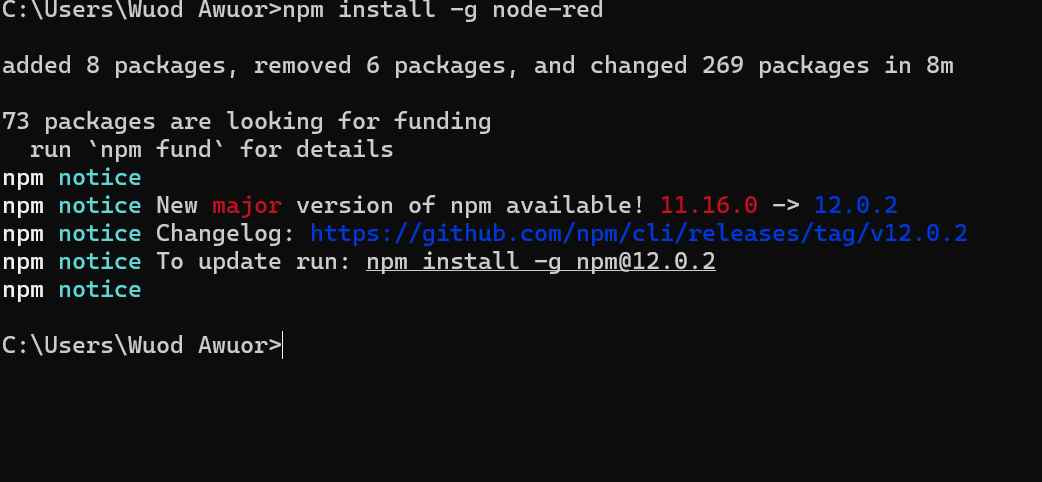
The -g option installs Node-RED globally, so it can be started from any location on the computer.
After the installation finished, I started Node-RED by running:
node-red
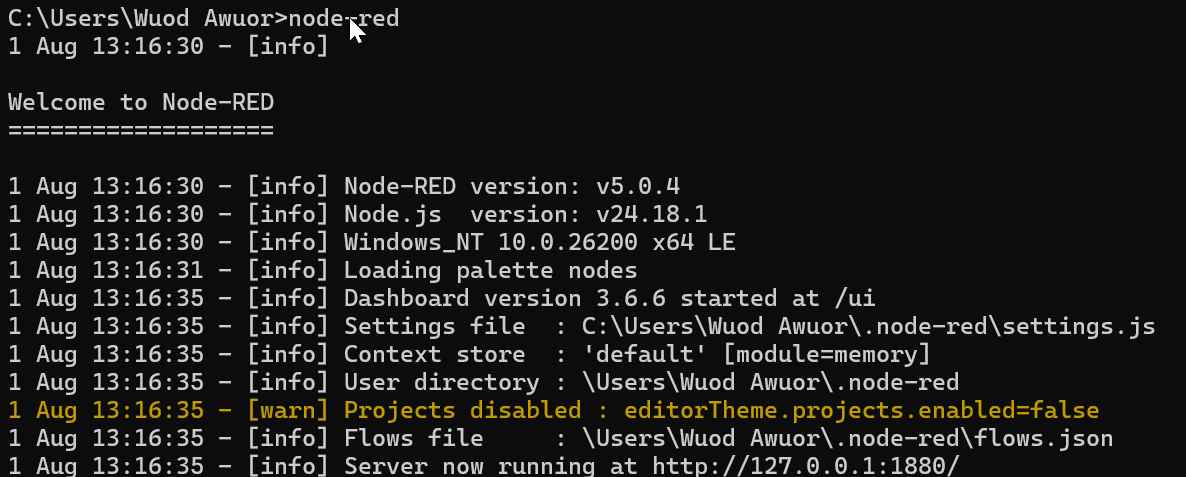
Once the server started, I opened the following address in my web browser:
http://localhost:1880
This opened the Node-RED editor, where I created the dashboard for monitoring the water flow data received from the ESP32.
MQTT Communication
MQTT (Message Queuing Telemetry Transport) is a lightweight messaging protocol designed for communication between IoT devices. It uses a publish/subscribe model, where devices publish data to topics and other devices subscribe to receive that data.
MQTT Broker
An MQTT broker acts as a middleman that receives messages from publishers and delivers them to subscribers. For this project, I used the public MQTT broker:
Broker used: broker.emqx.io
Topics:
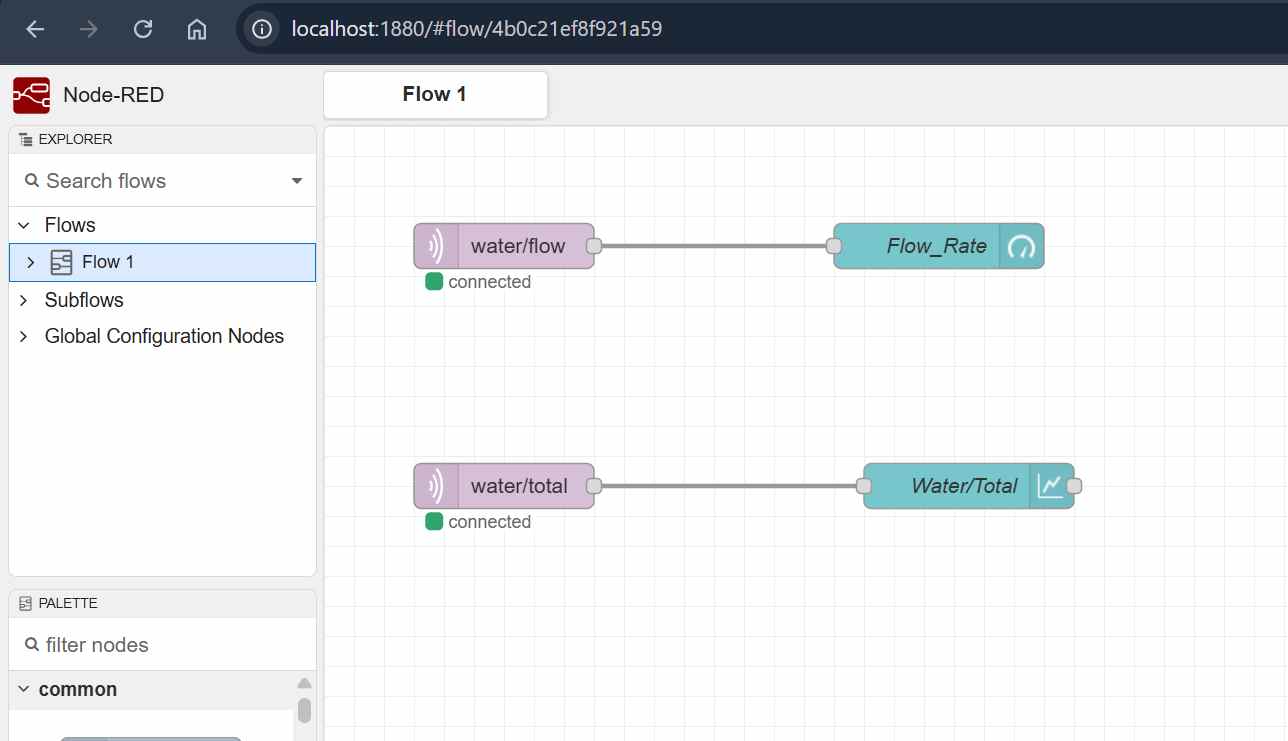
In this project, MQTT was used to send real-time water flow data from the ESP32-C3 to Node-RED. The ESP32 published the flow rate and total water usage to the topics water/flow and water/total, while Node-RED subscribed to these topics and displayed the values on the dashboard.
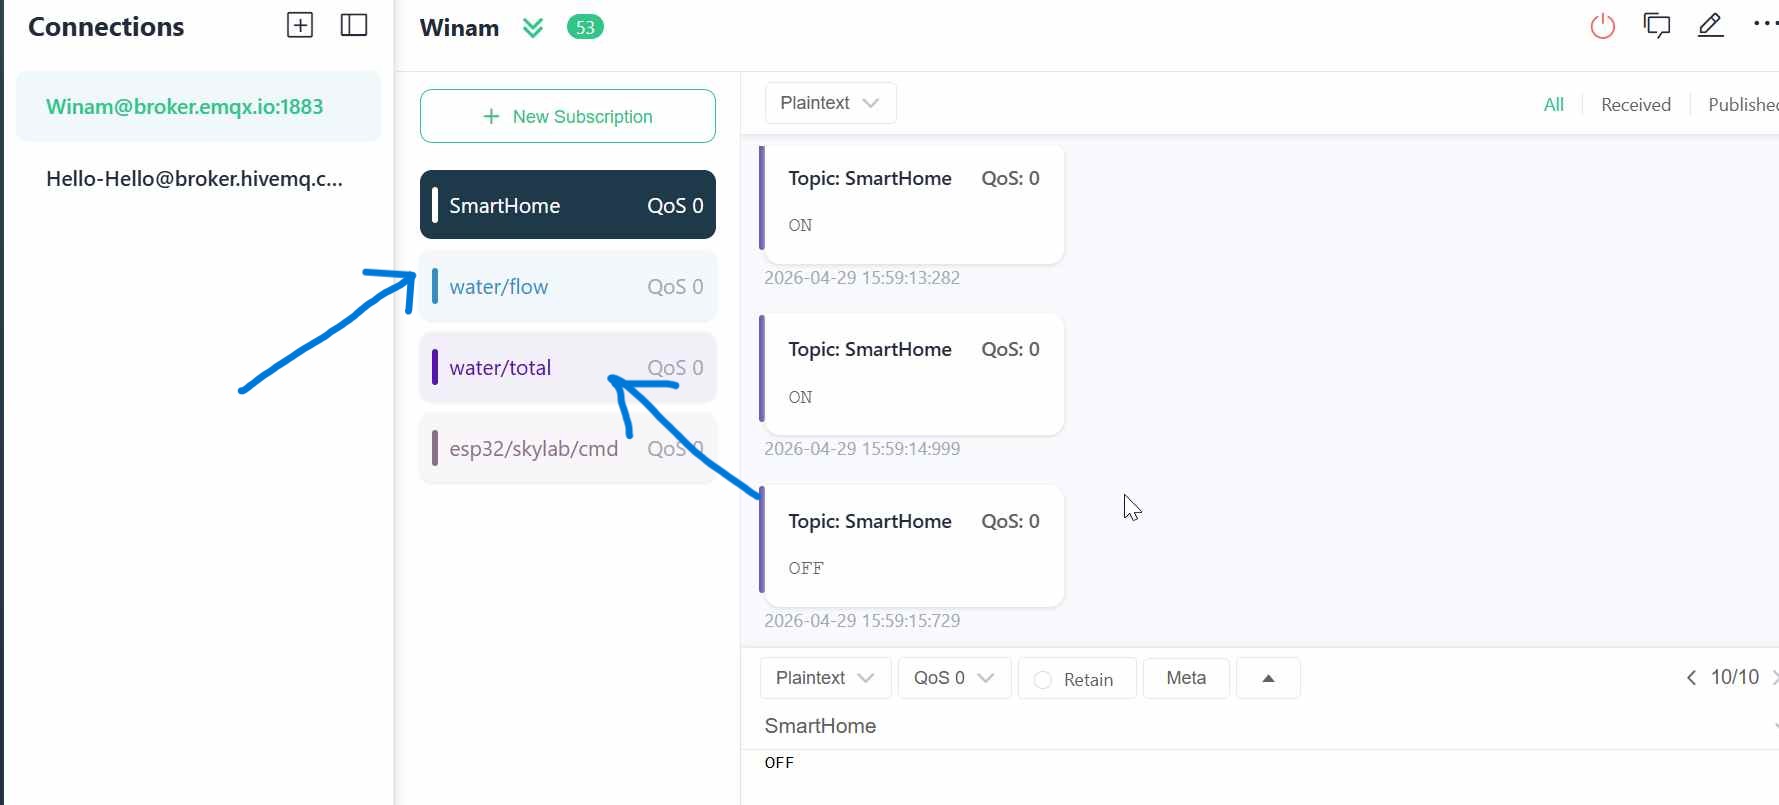
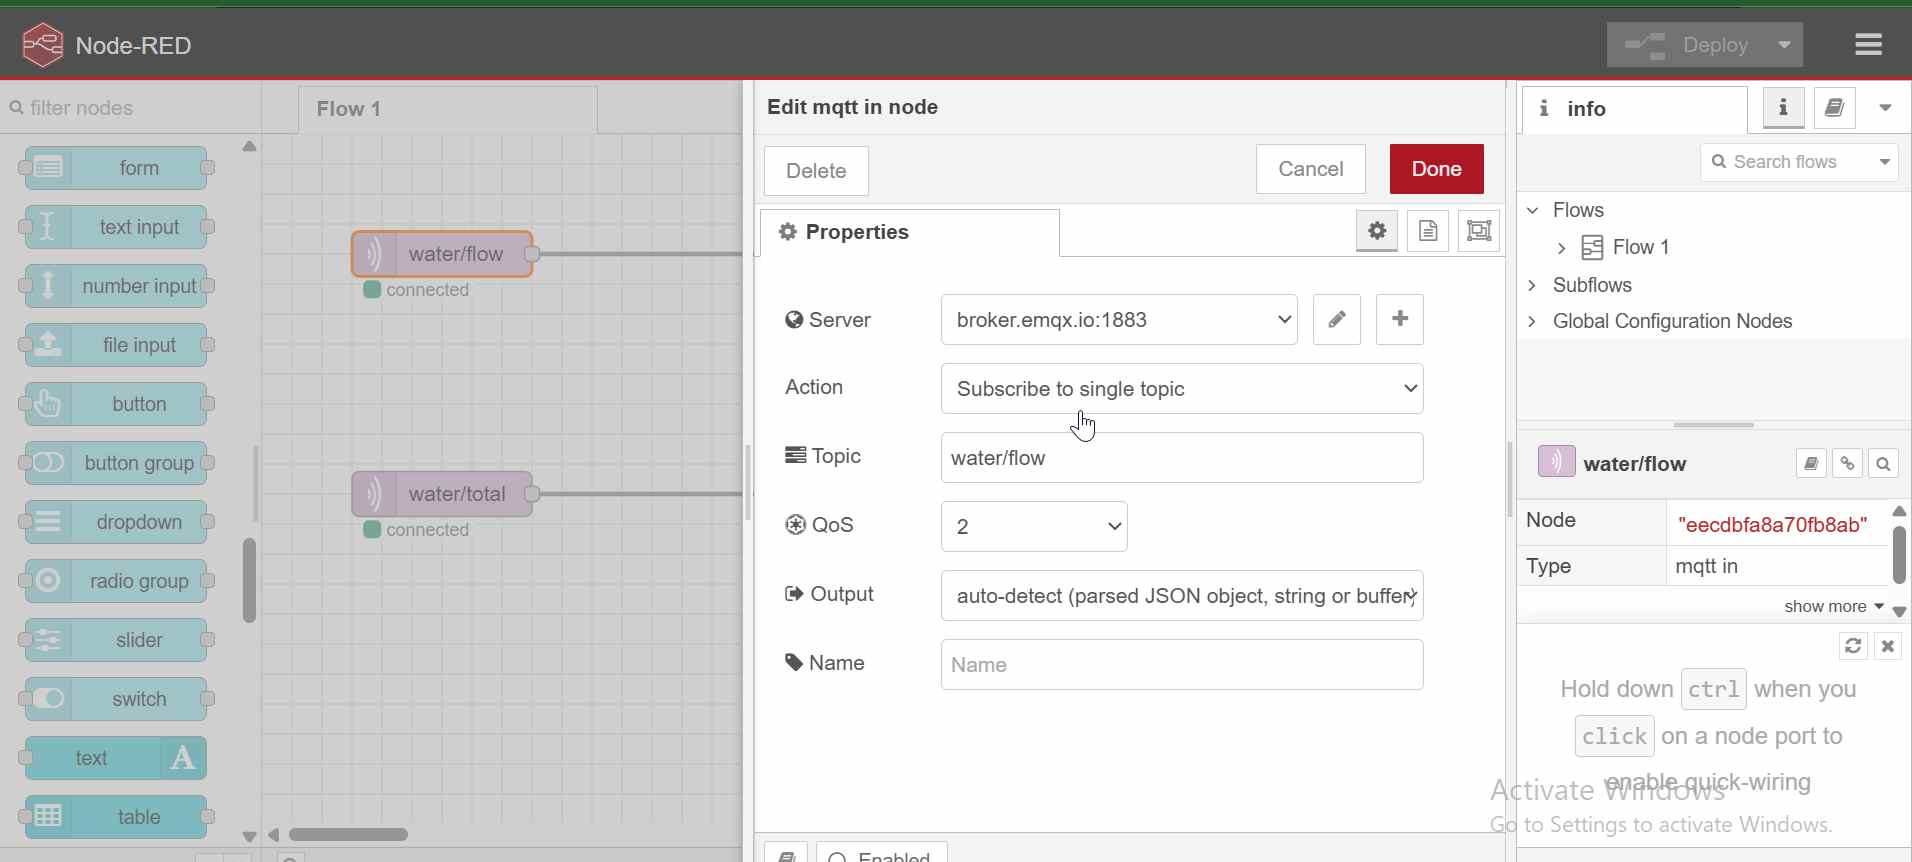
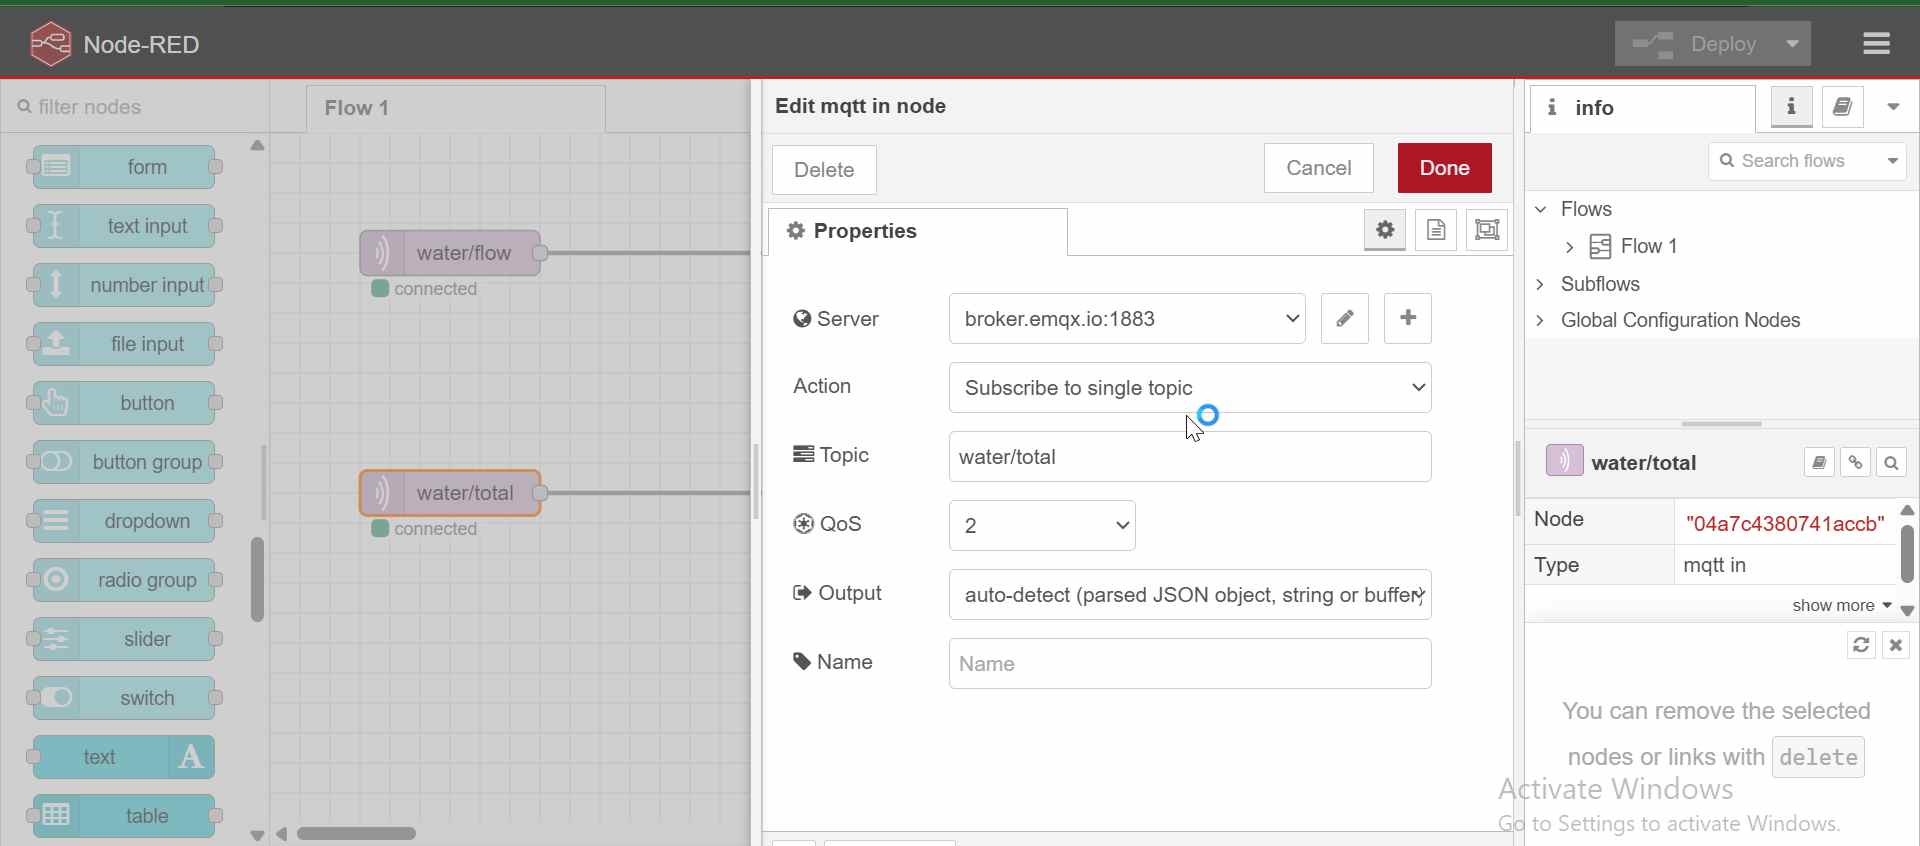
NODE RED Configaration
- water/flow
- water/total
Data is sent as simple numeric values.
Node-RED Interface
Created a dashboard with:
-
Tab: Water Monitor
-
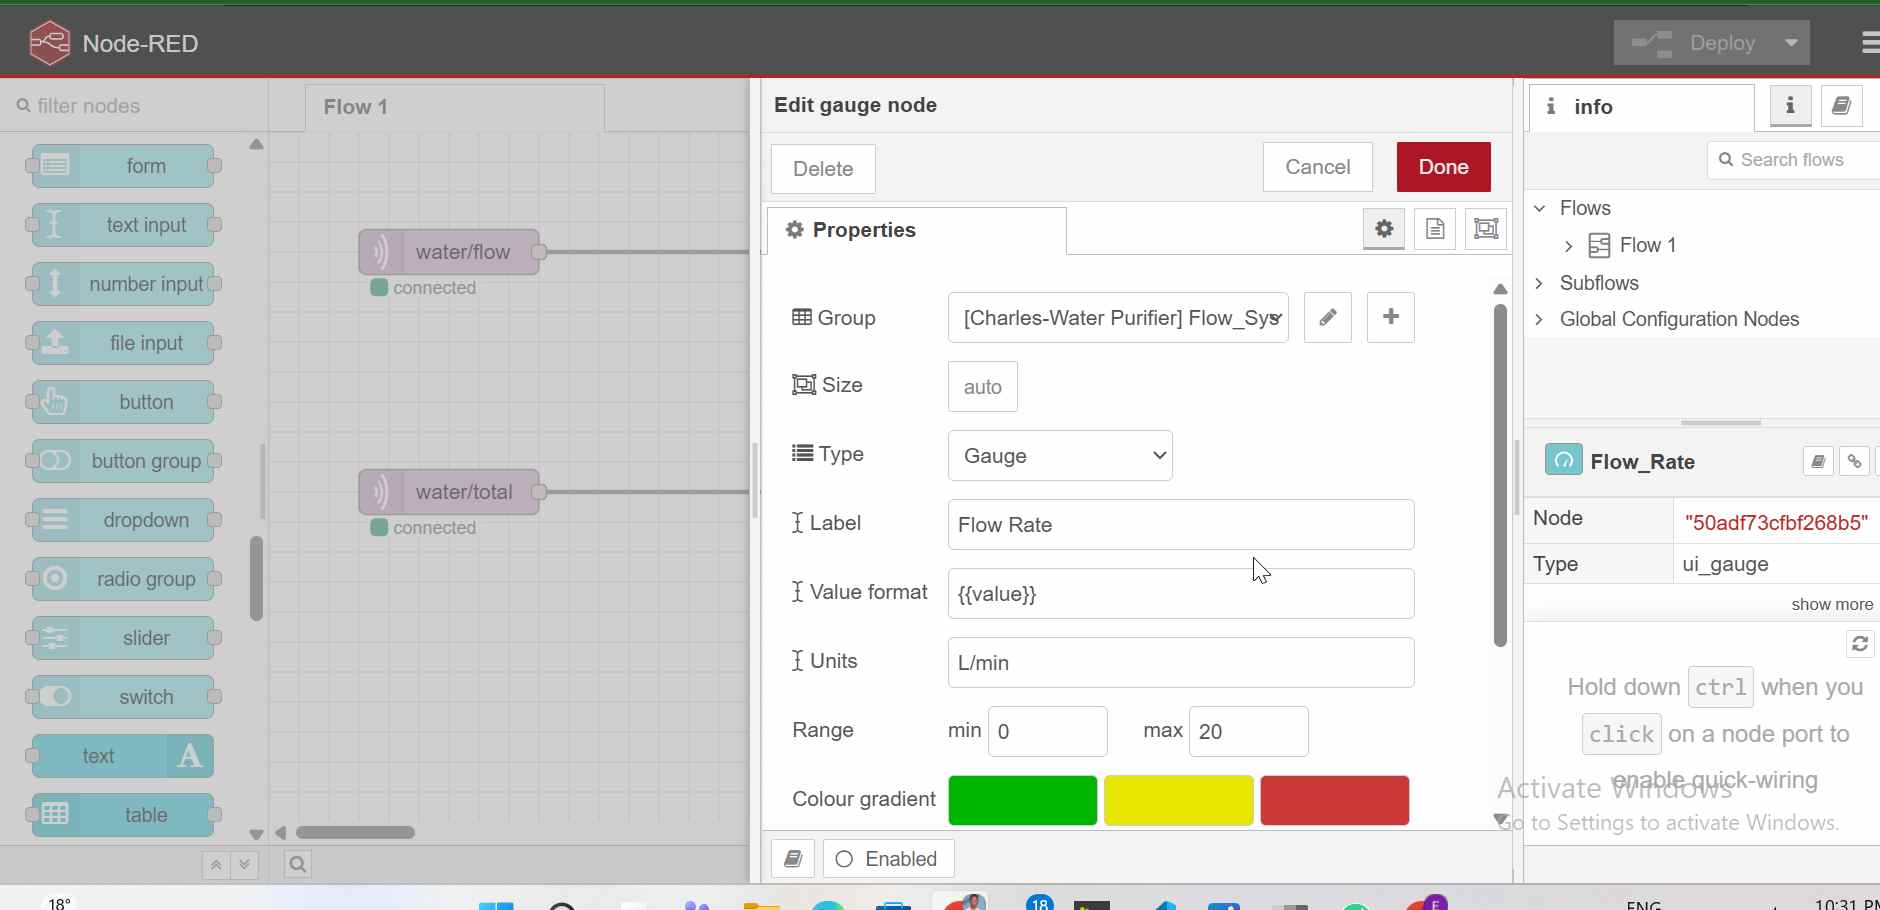
Group: Flow System - Groups were used to organize dashboard elements into logical sections. In this project, the “Flow System” group contains related data such as flow rate and total water usage
Widgets:
-
Gauge for flow rate
-
Chart for total water usage
Flow:
mqtt in (water/flow) → gauge
mqtt in (water/total) → chart
Challenges & Solutions
Sensor not working → fixed pin (D2) Chart showing JSON → used numeric values MQTT mixing → separated topics
Arduino IDE and Libraries
Installed Arduino IDE and required libraries:
-
WiFi
-
PubSubClient
ESP32 Application Code
The ESP32 reads pulses using interrupts, calculates flow rate, and sends data via MQTT.
Key logic:
Flow Rate = pulses / 7.5
Total Liters += flowRate / 60
generated the code using chatgpt prompt below
Write an ESP32-C3 (Arduino) program that reads a water flow sensor using interrupts, calculates flow rate (L/min) and total liters, connects to WiFi, and publishes real-time data to MQTT topics water/flow and water/total using broker.emqx.io
Code
#include <WiFi.h>
#include <PubSubClient.h>

// WiFi
const char* ssid = "MT";
const char* password = "#@Innovate";

// MQTT
const char* mqtt_server = "broker.emqx.io";

WiFiClient espClient;
PubSubClient client(espClient);

// Flow sensor pin
const int flowPin = D2;
volatile int pulseCount = 0;

float flowRate = 0.0;
float totalLiters = 0.0;

unsigned long previousMillis = 0;

// Interrupt function
void IRAM_ATTR pulseCounter() {
  pulseCount++;
}

// Connect WiFi
void setup_wifi() {
  WiFi.begin(ssid, password);
  while (WiFi.status() != WL_CONNECTED) {
    delay(500);
  }
}

// Reconnect MQTT
void reconnect() {
  while (!client.connected()) {
    client.connect("ESP32FlowClient");
  }
}

void setup() {
  Serial.begin(115200);

  pinMode(flowPin, INPUT_PULLUP);
  attachInterrupt(digitalPinToInterrupt(flowPin), pulseCounter, FALLING);

  setup_wifi();
  client.setServer(mqtt_server, 1883);
}

void loop() {
  if (!client.connected()) reconnect();
  client.loop();

  unsigned long currentMillis = millis();

  if (currentMillis - previousMillis >= 1000) {
    previousMillis = currentMillis;

    noInterrupts();
    int pulses = pulseCount;
    pulseCount = 0;
    interrupts();

    // Flow rate calculation
    flowRate = pulses / 7.5;

    // Total water accumulation
    totalLiters += (flowRate / 60.0);

    char flowMsg[20];
    char totalMsg[20];

    sprintf(flowMsg, "%.2f", flowRate);
    sprintf(totalMsg, "%.2f", totalLiters);

    client.publish("water/flow", flowMsg);
    client.publish("water/total", totalMsg);

    Serial.print("Flow: ");
    Serial.print(flowRate);
    Serial.print(" L/min | Total: ");
    Serial.println(totalLiters);
  }
}
- Conclusion This project demonstrates application programming, device interfacing, MQTT communication, and user interface development using Node-RED.