Interface and application programming
hero shot
Group assignment page.
Individual assignment
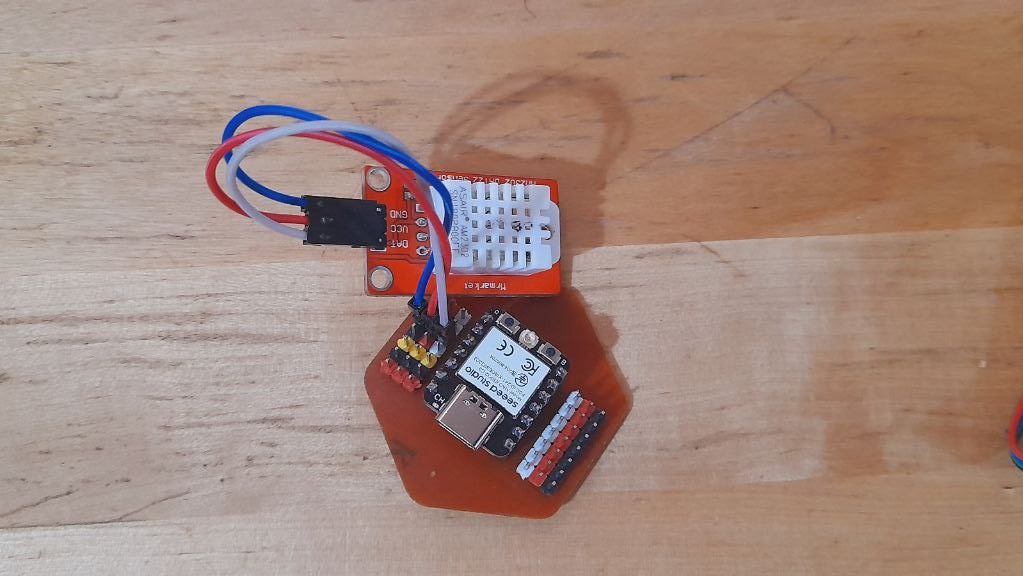
For this Week Assignment I have Upgrade my work on ‘Week 04 - Embedded programming’ using my updated board design on ‘Week 09 - output devices’.
I have Tried Blynk and telegram separately to send data online and also control my XIAO_ESP32 board.
This week I have added the Blynk Android App and Sensor Readings and plotting on ESP Web Server.
This Week’s Update
ESP32 Web Server
Based on Random Nerd Tutorials I have added an ESP WebServer to the project keeping the previous code and functions.
Simply put The idea its to have a web page served by the ESP on the local network. On that Webpage Sensor data can be displayed.
Installing required library
To begin I have installed few libraries and thier dependencies on my Arduino IDE:
Arduino Code
I then Modified my code with the telegram bot option to add the web server codes. The new lines have Week14 as comment before the code line the find them easily.
//Week14
//#include <WiFi.h> // This was already include on week 04 Code
#include <ESPAsyncWebServer.h>
#include <SPIFFS.h>
AsyncWebServer object Creation on port 90. the default port was 80.
// Week 14
// Create AsyncWebServer object on port 90
AsyncWebServer server(90);
I have then added the function that will read the sensor Values and make them available to the served page :
//This function reads the moisture level from the DHT22
String read_H_DHT22(){
  humidity = dht.readHumidity();
  if (isnan(humidity)) {
    //Serial.println("Failed to read from DHT22 sensor!");
    return "NAN";
  }
  else {
    return String(humidity);
  }
}

//This function reads the temperature level from the DHT22
String read_T_DHT22(){
  temperatureC = dht.readTemperature();
  if (isnan(temperatureC)) {
    //Serial.println("Failed to read from DHT22 sensor!");
    return "NAN";
  }
  else {
    return String(temperatureC);
  }
}
In the Void setup I have initialized/started the SPIFFS
  // Week14 Initialize SPIFFS
  if (!SPIFFS.begin()) {
    Serial.println("An Error has occurred while mounting SPIFFS");
    return;
  }
Adding Route to get to the page files and html request for values and a the end of the setup started the server.
//Week14  Route for root / web page
  server.on("/", HTTP_GET, [](AsyncWebServerRequest * request) {
    request->send(SPIFFS, "/index.html");
  });
  server.on("/temperature", HTTP_GET, [](AsyncWebServerRequest * request) {
    request->send_P(200, "text/plain", read_T_DHT22().c_str());
  });
  server.on("/humidity", HTTP_GET, [](AsyncWebServerRequest * request) {
    request->send_P(200, "text/plain", read_H_DHT22().c_str());
  });

  // Start server
  server.begin();
Nothing is needed in the void loop but I had to add a value return line for both state (Closed an Open) for the button state change monitor function so it returns a value so the web serve can also request it values. and changed the function type from Void to string
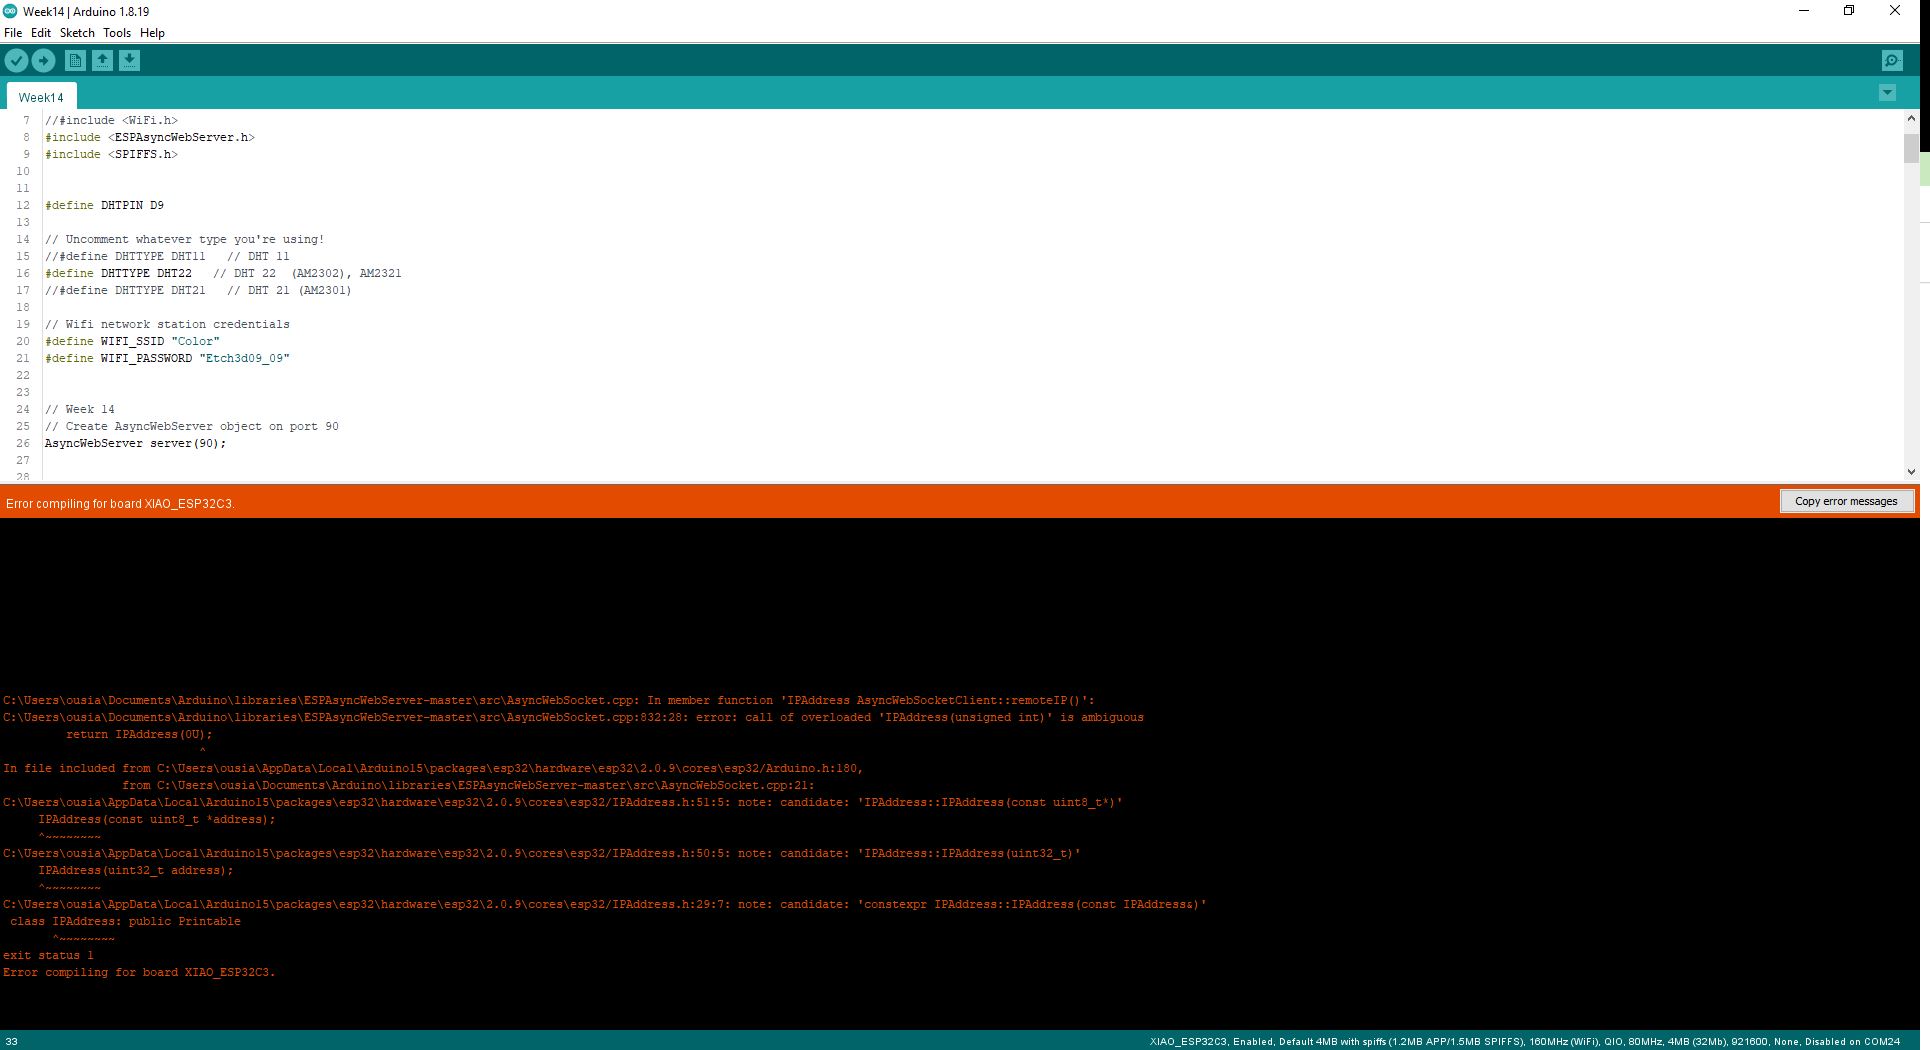
After that I have tried to verify and compile my code and have run into this error:
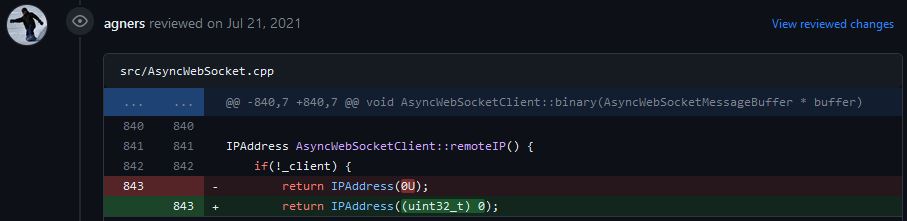
 and fixed it with this
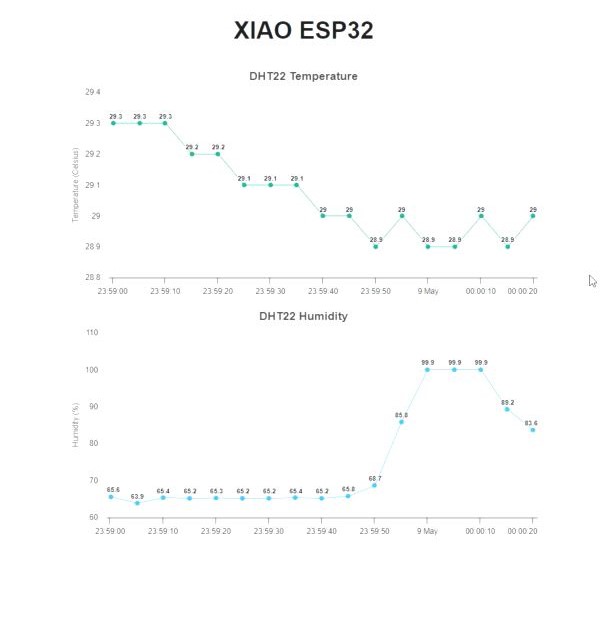
Gui and how it works
The web page being served is an HTMl file located on the ESP board. It is stored on the SPIIF files system of the ESP32. It has a script code that request periodically values from the bord and plot then on the page adding time stamps and adjusting Axis value range.
Webpage Code
<!DOCTYPE HTML><html>
<!-- Rui Santos - Complete project details at https://RandomNerdTutorials.com

Permission is hereby granted, free of charge, to any person obtaining a copy
of this software and associated documentation files.
The above copyright notice and this permission notice shall be included in all
copies or substantial portions of the Software. -->
<head>
  <meta name="viewport" content="width=device-width, initial-scale=1">
  <script src="https://code.highcharts.com/highcharts.js"></script>
  <style>
    body {
      min-width: 310px;
        max-width: 800px;
        height: 400px;
      margin: 0 auto;
    }
    h2 {
      font-family: Arial;
      font-size: 2.5rem;
      text-align: center;
    }
  </style>
</head>
<body>
  <h2>XIAO ESP32 </h2>
  <div id="chart-temperature" class="container"></div>
  <div id="chart-humidity" class="container"></div>
</body>
<script>
var chartT = new Highcharts.Chart({
  chart:{ renderTo : 'chart-temperature' },
  title: { text: 'DHT22 Temperature' },
  series: [{
    showInLegend: false,
    data: []
  }],
  plotOptions: {
    line: { animation: false,
      dataLabels: { enabled: true }
    },
    series: { color: '#059e8a' }
  },
  xAxis: { type: 'datetime',
    dateTimeLabelFormats: { second: '%H:%M:%S' }
  },
  yAxis: {
    title: { text: 'Temperature (Celsius)' }
    //title: { text: 'Temperature (Fahrenheit)' }
  },
  credits: { enabled: false }
});
setInterval(function ( ) {
  var xhttp = new XMLHttpRequest();
  xhttp.onreadystatechange = function() {
    if (this.readyState == 4 && this.status == 200) {
      var x = (new Date()).getTime(),
          y = parseFloat(this.responseText);
      //console.log(this.responseText);
      if(chartT.series[0].data.length > 40) {
        chartT.series[0].addPoint([x, y], true, true, true);
      } else {
        chartT.series[0].addPoint([x, y], true, false, true);
      }
    }
  };
  xhttp.open("GET", "/temperature", true);
  xhttp.send();
}, 5000 ) ; // Week 14 changed from 30 seconds "30000" to 5 seconds "5000"

var chartH = new Highcharts.Chart({
  chart:{ renderTo:'chart-humidity' },
  title: { text: 'DHT22 Humidity' },
  series: [{
    showInLegend: false,
    data: []
  }],
  plotOptions: {
    line: { animation: false,
      dataLabels: { enabled: true }
    }
  },
  xAxis: {
    type: 'datetime',
    dateTimeLabelFormats: { second: '%H:%M:%S' }
  },
  yAxis: {
    title: { text: 'Humidity (%)' }
  },
  credits: { enabled: false }
});
setInterval(function ( ) {
  var xhttp = new XMLHttpRequest();
  xhttp.onreadystatechange = function() {
    if (this.readyState == 4 && this.status == 200) {
      var x = (new Date()).getTime(),
          y = parseFloat(this.responseText);
      //console.log(this.responseText);
      if(chartH.series[0].data.length > 40) {
        chartH.series[0].addPoint([x, y], true, true, true);
      } else {
        chartH.series[0].addPoint([x, y], true, false, true);
      }
    }
  };
  xhttp.open("GET", "/humidity", true);
  xhttp.send();
}, 5000 ) ; // Week 14 changed from 30 seconds "30000" to 5 seconds "5000"

</script>
</html>
Issue and troubleshooting
- I wanted to try both a page that had sensor values displayed and also alow to set values and toggle switches but couldn’t make it for now. I will keep searching and trying.