Individual Assignment
Write an application that interfaces a user with input and/or output device(s) on a board that you made.
Group Assignment
Compare as many tool options as possible.
Document your work to the group work page and reflect on your individual page what you learned.
Learning outcomes
- Implement a Graphical User Interface (GUI) using programming and explore protocols to communicate with an MCU board.
Write an application that interfaces a user with input and/or output device(s) on a board that you made.
For this week I wanted to take the opportunity and learn more about json file format. I started by getting temperature readings on my input device I created in week 11 Input Devices.
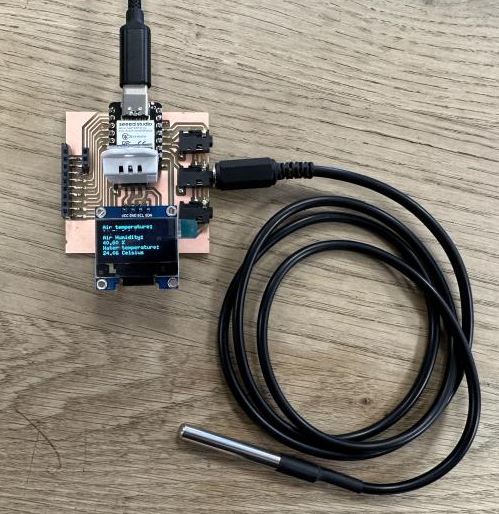
Getting temperature readings was straight forward but to get the readings in json format I had to use the ArduinoJson library. I used examples from the ArduinoJson website to format the readings.
Once I had the temperature data I wanted to get real time clock data along with the readings. To get real time data I needed to connect the device to the internet. Using the WiFi and time library I got my device online and real time data. I used this code example to get the esp32c3 Xiao online and real time data.
The time data is in epoch format or Unix time which is a date and time representation widely used in computing. It measures time by the number of seconds that have elapsed since 00:00:00 UTC on 1 January 1970, the Unix epoch, without adjustments made due to leap seconds. In epoch 1683287940 is the number of seconds since 00:00:00 UTC on 1 January 1970 or May 5, 2023 11:59:00 AM GMT+00:00.
Code
	/*
  Rui Santos
  Complete project details at https://RandomNerdTutorials.com/epoch-unix-time-esp32-arduino/

  Permission is hereby granted, free of charge, to any person obtaining a copy
  of this software and associated documentation files.

  The above copyright notice and this permission notice shall be included in all
  copies or substantial portions of the Software.
*/
//-------------------------------------------------------------------Wifi Date/time stuff
//include wifi and time to get real date/time data
#include
#include "time.h"
//-------------------------------------------------------------------Wifi Date/time stuff

#include
#include
#include "DHT.h"

#define DHTPIN 20
#define DHTTYPE DHT22   // DHT 22  (AM2302), AM2321

DHT dht(DHTPIN, DHTTYPE);

int readingNumber = 1;
String temp = "";

//-------------------------------------------------------------------Wifi Date/time stuff
// Replace with your network credentials  //-------------------------Wifi Date/time stuff
const char* ssid = "NetworkName";    //-------------------------Wifi Date/time stuff
const char* password = "Password";    //---------------------------Wifi Date/time stuff
//-------------------------------------------------------------------Wifi Date/time stuff
// NTP server to request epoch time
const char* ntpServer = "pool.ntp.org";    //------------------------Wifi Date/time stuff
// Variable to save current epoch time
unsigned long epochTime;    //---------------------------------------Wifi Date/time stuff

// Function that gets current epoch time
unsigned long getTime() {//---------------------------------------Wifi Date/time stuff
  time_t now;//---------------------------------------Wifi Date/time stuff
  struct tm timeinfo;
  if (!getLocalTime(&timeinfo)) {
    //Serial.println("Failed to obtain time");
    return(0);
  }
  time(&now);
  return now;
}

// Initialize WiFi
void initWiFi() {
  WiFi.mode(WIFI_STA);
  WiFi.begin(ssid, password);
  Serial.print("Connecting to WiFi ..");
  while (WiFi.status() != WL_CONNECTED) {
    Serial.print('.');
    delay(1000);
  }
  Serial.println(WiFi.localIP());
}
//-------------------------------------------------------------------Wifi Date/time stuff


void setup(void) {
//-------------------------------------------------------------------Wifi Date/time stuff
  Serial.begin(115200);
  initWiFi();
  configTime(0, 0, ntpServer);
//-------------------------------------------------------------------Wifi Date/time stuff
  dht.begin();
}

void loop(void) {
//-------------------------------------------------------------------Wifi Date/time stuff
  epochTime = getTime();
  //Serial.print("Epoch Time: ");
  //Serial.println(epochTime);
  delay(1000);
//-------------------------------------------------------------------Wifi Date/time stuff


  //For this example I only want 6 readings to be output to json
  while(readingNumber < 7){
    if(readingNumber == 1){
      //need open bracket before putting in json data
      Serial.println("[");
    }

    float t = dht.readTemperature();

    // deley between each temperature reading
    delay(1000);

    //get data in json format
    StaticJsonDocument<1024> doc;
    String json;

    doc["date"] = epochTime;
    doc["temperature"] = t;

    serializeJson(doc, json);
    serializeJsonPretty(doc, Serial);

    //need a comma "," between each reading
    if(readingNumber < 6){
      Serial.println(",");
    }

    //need closing bracket after last json data
    if(readingNumber == 6){
      Serial.println();
      Serial.println("]");
    }

    readingNumber++;
  }

}
This code takes six temperature readings and prints to Serial monitor in json format. I was unable to post the data directly to my GitLab page, I´ll get to that in the next spiral. But for now I just copied the data from the Serial monitor and pasted it into a json file.
Output from code
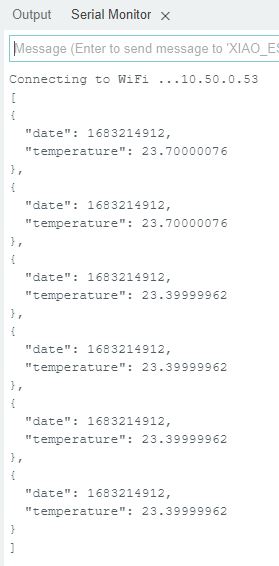
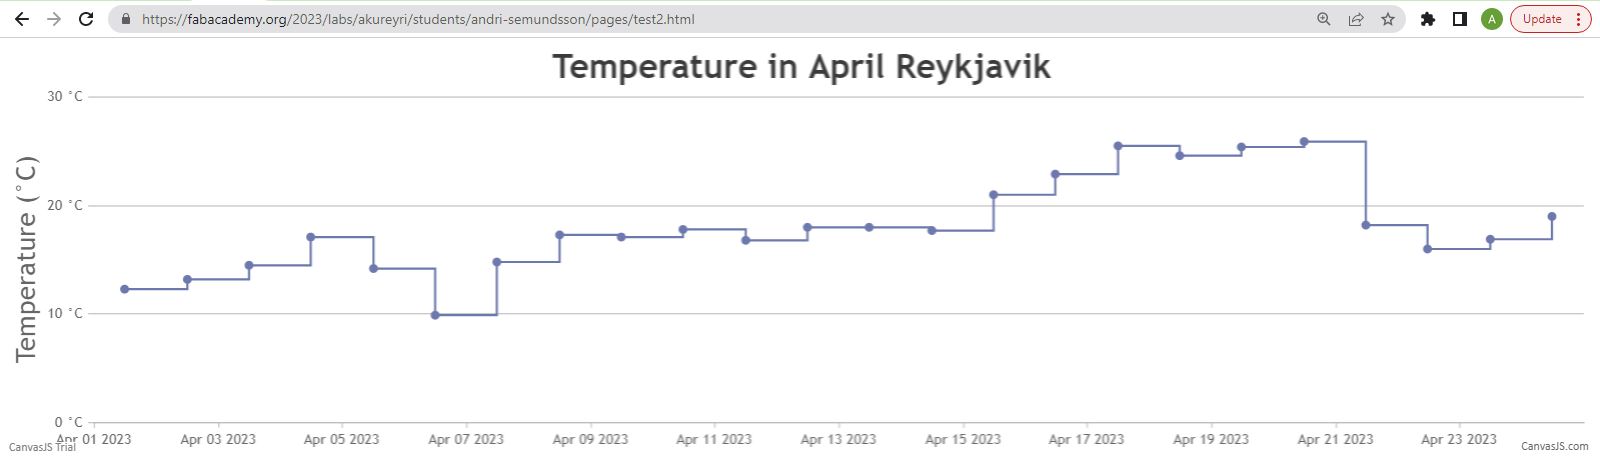
Now that I got my json data I want to display the data in a graph. To make a more interesting graph I created a mock json file with 30 dates and temperature readings.
I decided to use canvasJS to display the data. I saved the json file on my repo and linked the javascript code to my json file. It took me a while to get everything working but once I had one graph up and running it was easy to use different types of graphs.
It is easy to change the theme and style of graph. Just edit the "theme" and "type" fields.
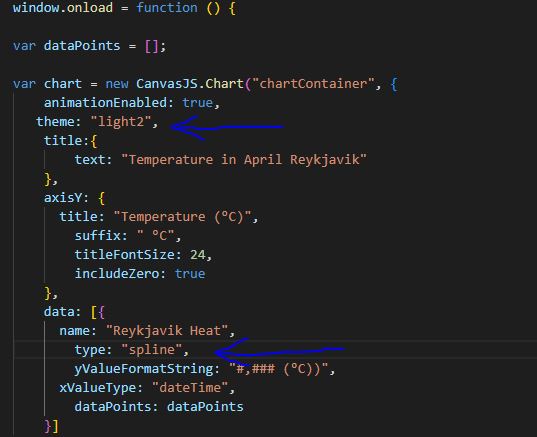
Spline graph (dark)
I tested a few types of graphs, some looked very nice while some did not make sense for the type of data I was displaying.
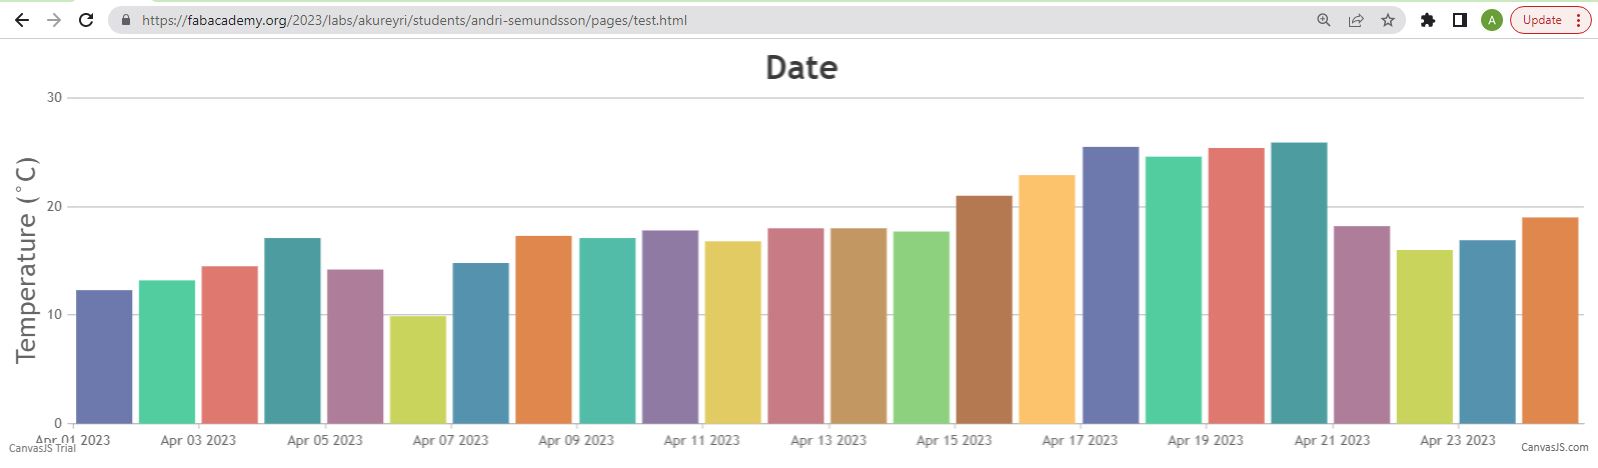
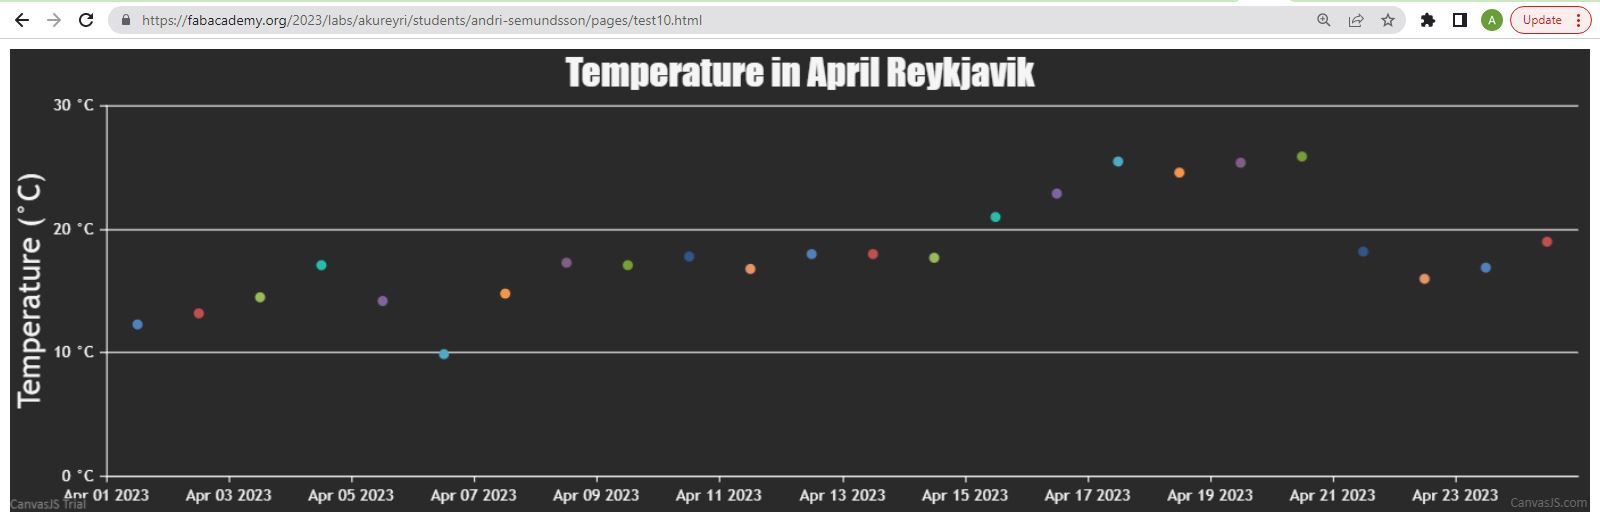
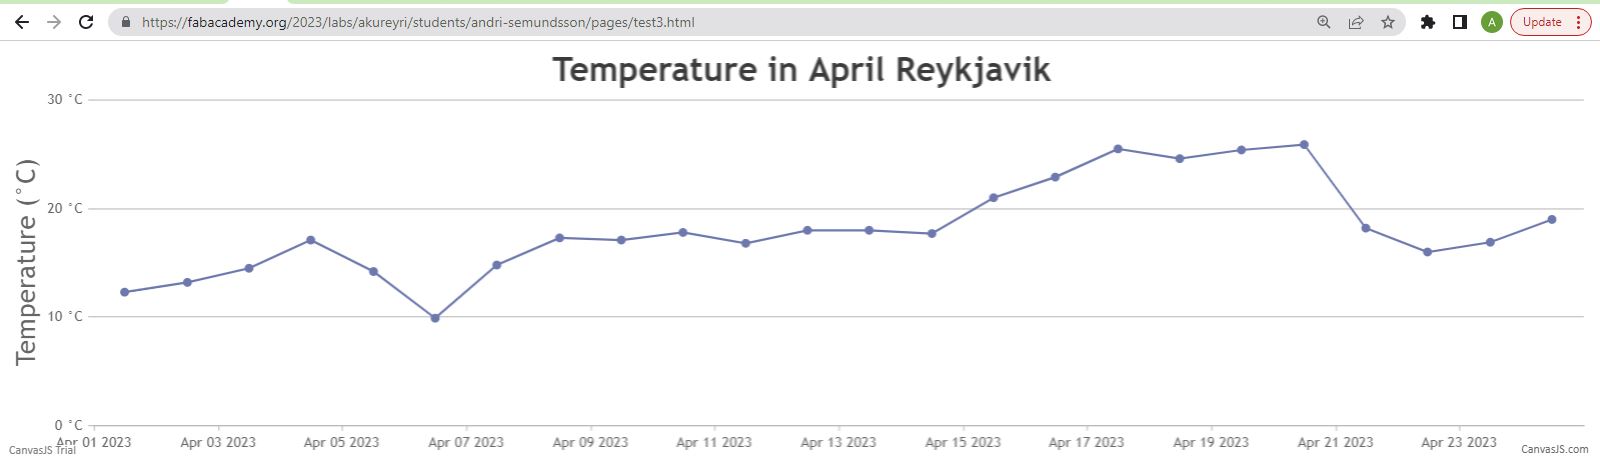
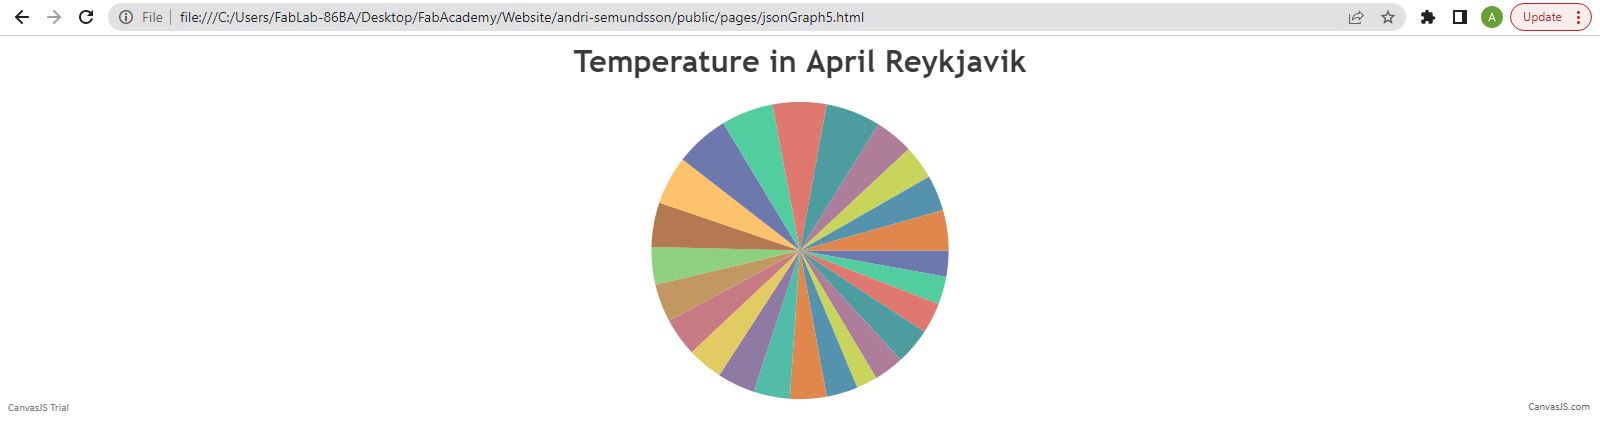
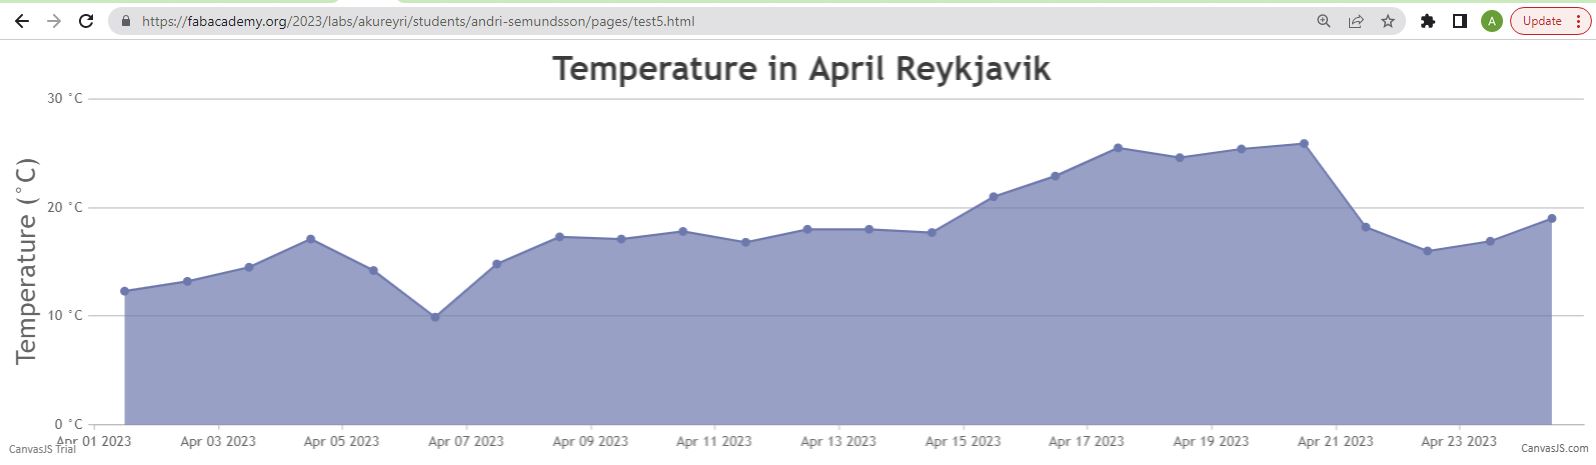
I am happy with these graphs and I like how they are interactive, holding the mouse pointer over a data point gives you more info.
Group Assignment
Compare as many tool options as possible.
There are many tools to make a GUI to display and interact with data.
CanvasJS
As seen above I used CanvasJS for my individual assignment. CanvasJS is easy to implement, you simply add the code snippets to you website and point to your data to get visualized data points.
CanvasJS is free to use.
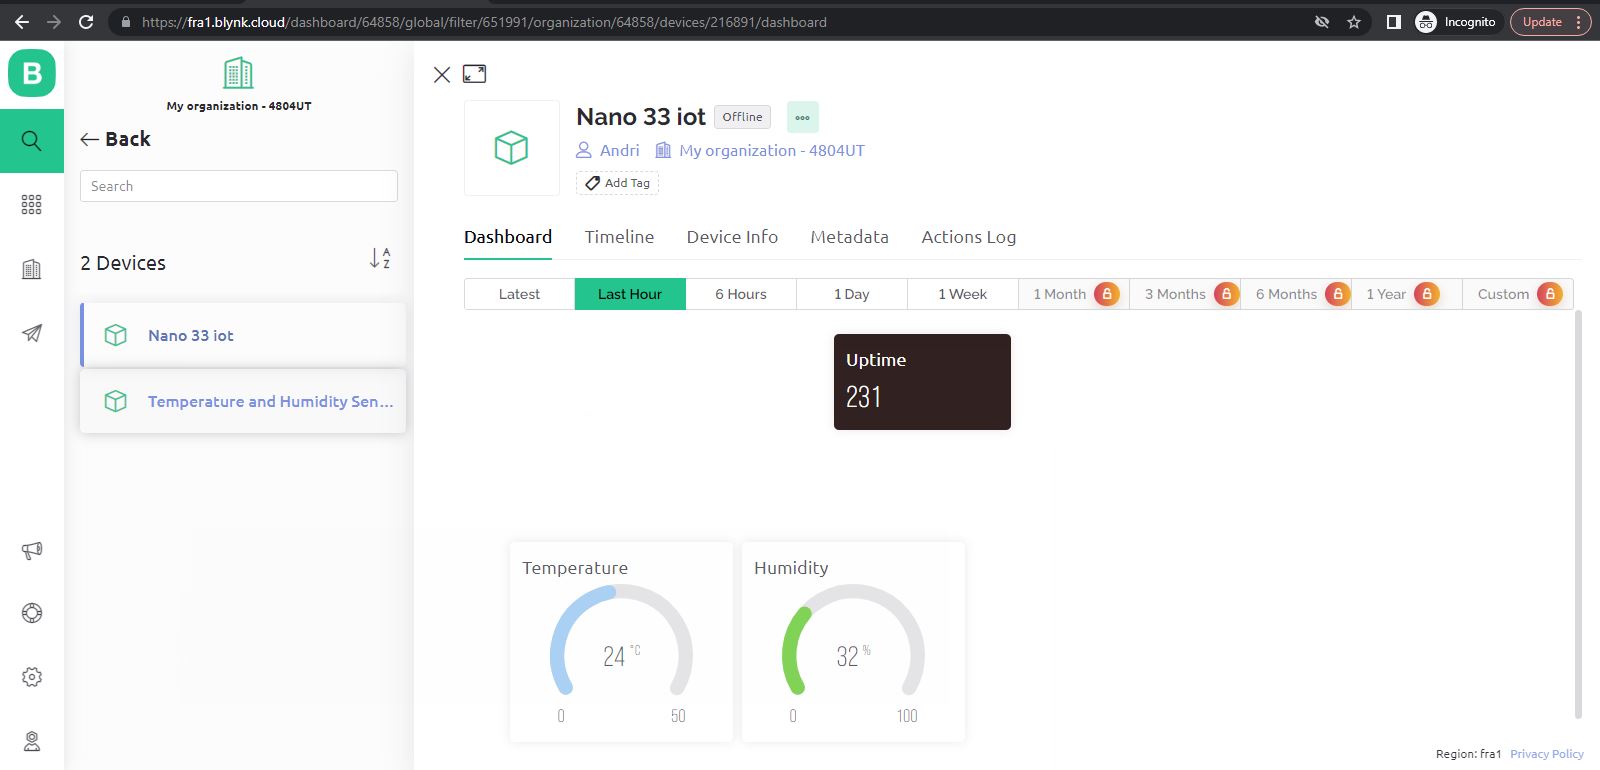
Blynk
Blynk is an Internet of things (IoT) company which provides a platform for building mobile (IOS and Android) applications that can connect electronic devices to the Internet and remotely monitor and control these devices.
Blynk has excellent example codes and instructions on how to get everything up and running.
Blynk is free to a degree, the FREE plan allows for 2 devices and 1 week of historical data. The PLUS plan has up to 10 devices and 3 months of historical data. The PLUS plan should be enough for most simple projects. They also have a PRO plan which is more for commercial development allowing more devices, widgets and 6 months of historical data.
The data can be viewed on their website and mobile app.
ThingSpeak
ThingSpeak is an open-source software written in Ruby which allows users to communicate with internet enabled devices. It facilitates data access, retrieval and logging of data by providing an API to both the devices and social network websites.
There are several code examples and tutorials to get up everything working.
The pricing for ThingSpeak depends on the number of messages and channels you use. The FREE plan allows 3 million messages a year and 4 channels. The STANDARD plan allows 33 million messages a year per unit and up to 250 channels per unit. The STANDARD plan is meant for all commercial, government and revenue generating activities with a price at $710 per year.
The data can be viewed on their website and through apps.
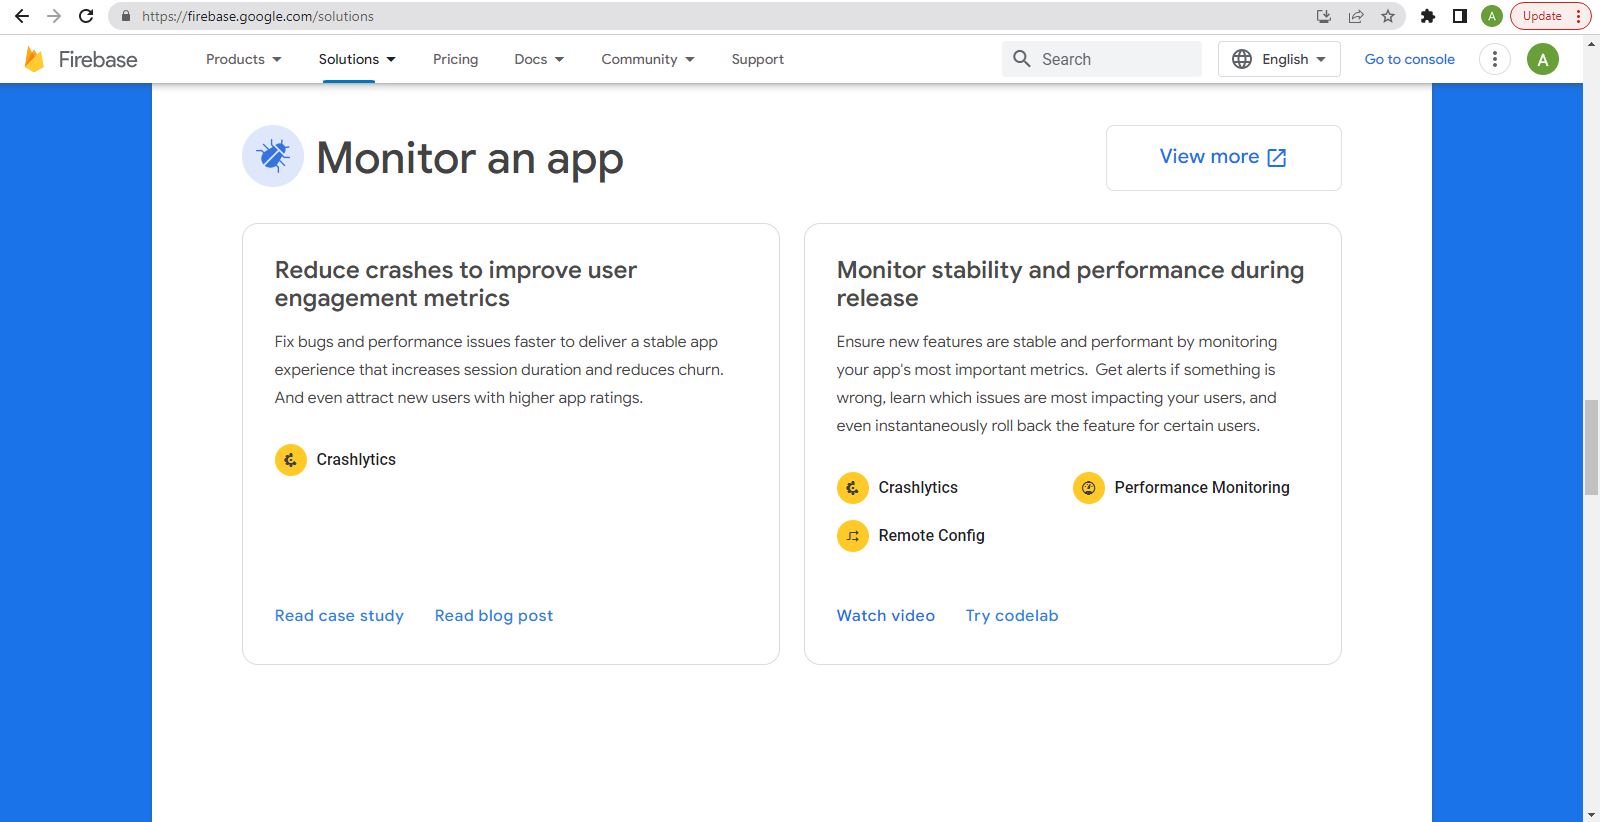
Firebase
Firebase is a mobile and web development platform provided by Google. It offers a suite of tools and services that help developers build and scale applications quickly and efficiently. Firebase provides various features that facilitate tasks such as database management, user authentication, cloud storage, hosting, real-time messaging, and more. It is designed to simplify the development process by providing developers with pre-built components and infrastructure, reducing the need for backend server setup and management. Firebase supports multiple platforms and programming languages, making it versatile for different application requirements. Overall, Firebase empowers developers to focus on building high-quality applications by handling many common backend tasks and providing seamless integration with other Google services.
Firebase has differen pricing piers. Spark (Free): Firebase Spark plan provides a generous free tier that allows you to start using Firebase without any cost. It includes a range of features and services, with certain limitations on usage and scalability. Flame (Pay as you go): Firebase Flame plan is a flexible pricing model based on your usage. You pay for the specific services you use, such as Realtime Database, Cloud Firestore, Cloud Storage, Authentication, etc. Pricing is based on factors like data storage, data transfer, authentication operations, and other service-specific metrics. Blaze (Pay as you go): Firebase Blaze plan is suitable for larger-scale projects or applications with high usage. It provides greater scalability and access to advanced features. With Blaze, you are billed based on usage and have access to additional capabilities, such as usage monitoring, expanded quotas, and more.