3D Printed Generator
Now that I had my prototype working (or spinning smoothly under a fan) I decided to return to the 3D printed generator I made to see if I could in any way improve this.
Useful feedback from Neil
During the review of my final project in class (wk15) Neil sensibly suggested that this project could be split into two larger projects: a generator and the wind turbine. As such it would make a great collaborative project.
So I did use the GitLab issue tracker to see if anyone wanted to collaborate on this, alas I had no takers in the generator department. This is why, with my very basic Savonious prototype already spinning as I’ve been hacking away at this since week 3 (see prototype), I wanted to try and make more use of 3D printed generator design, magnets and windings. And hope to build a collaborative project out of what transpires.
If anything, the goal here is to understand how to generate and measure power. How much wind do I need to generate an equal amount of power as required by a tachometer and LCD.
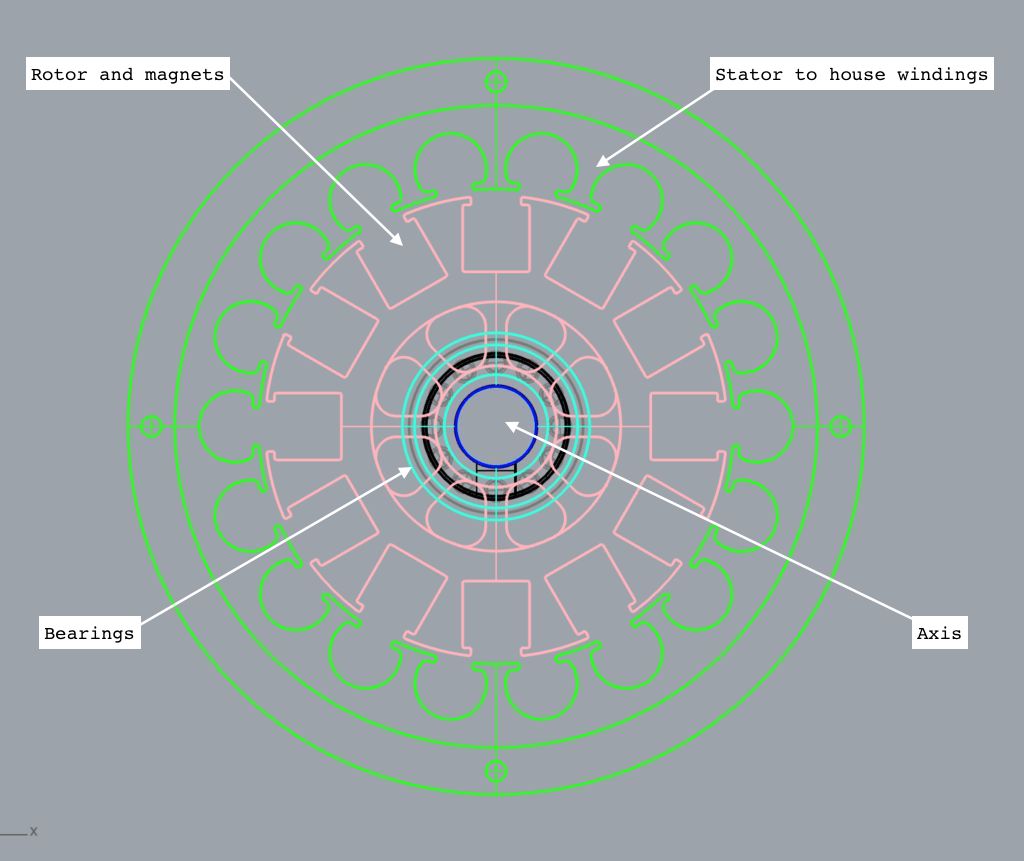
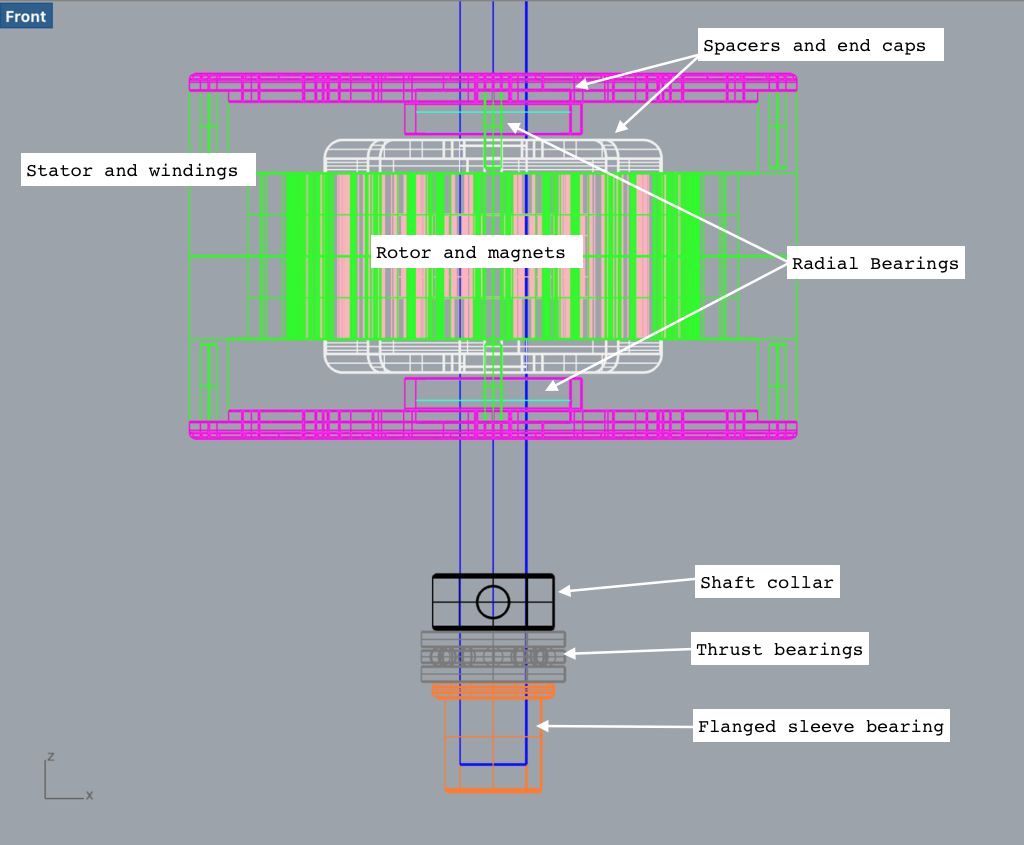
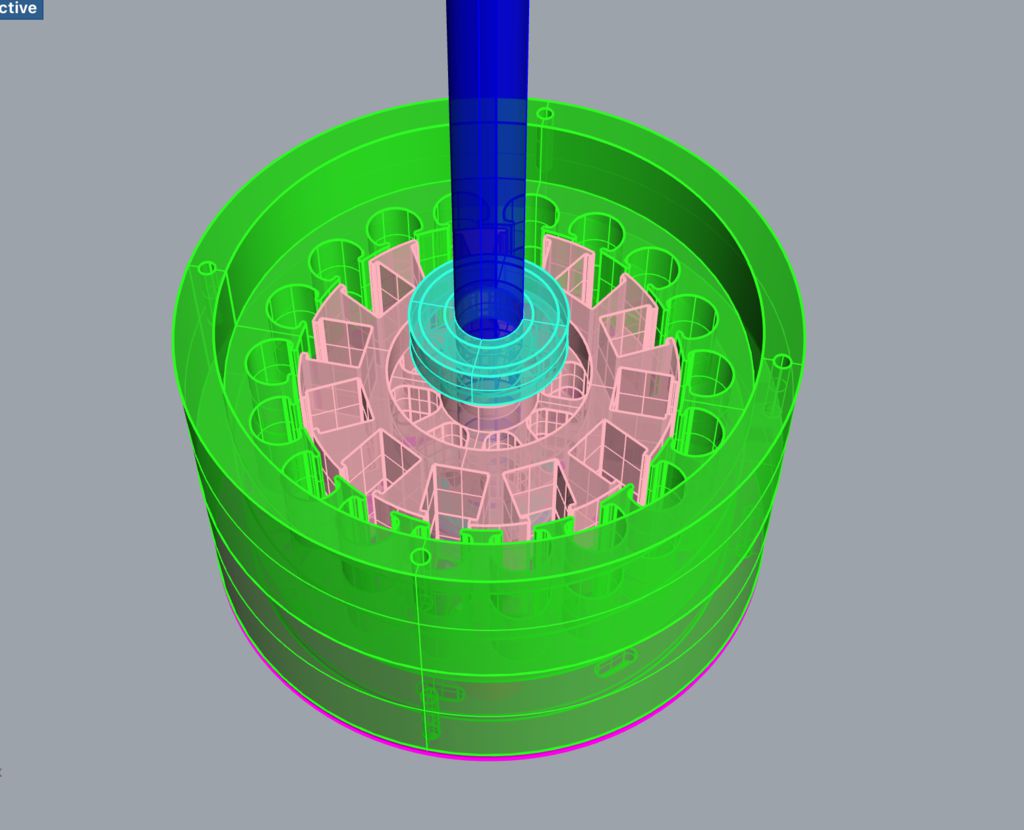
3D Printing (a re-designed) generator
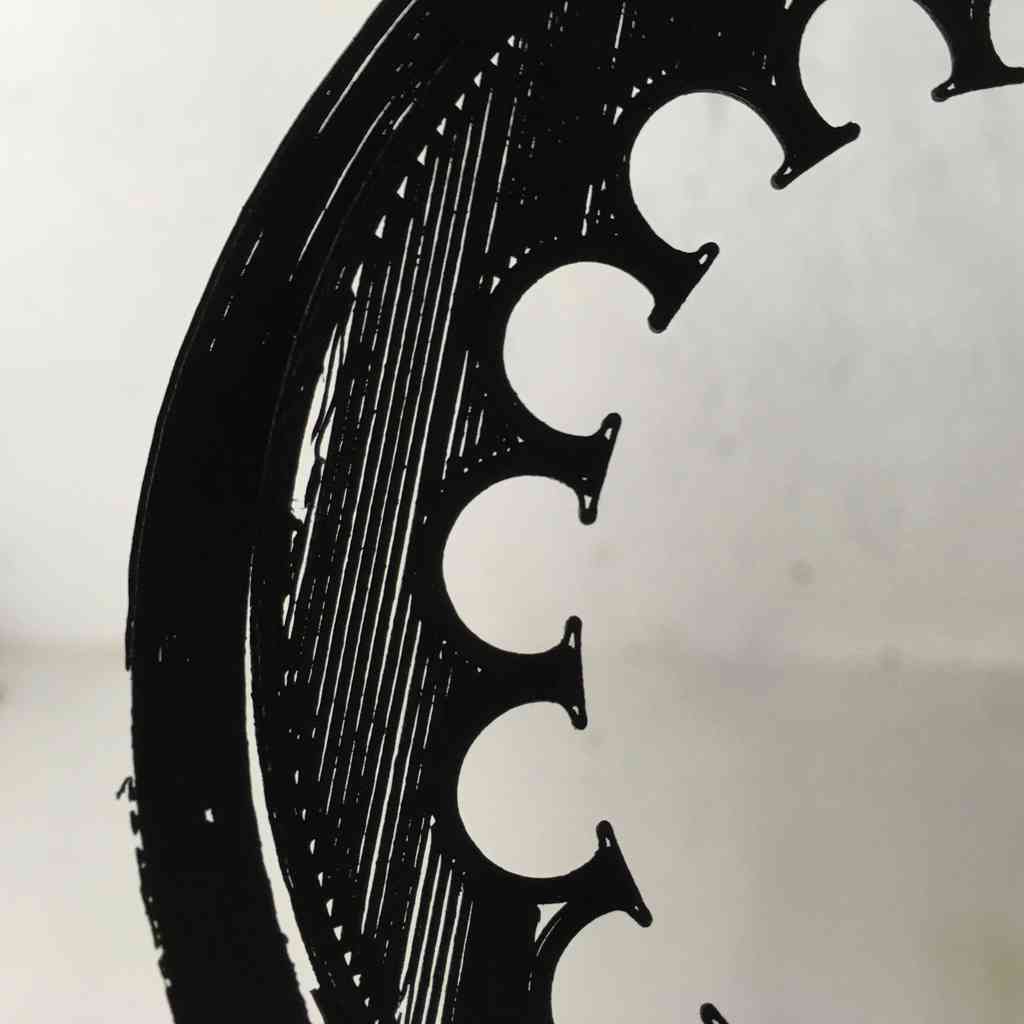
- Added a new stator core with smaller slots, and openings on the rotor magnet housing.
My first design limited as it was made with molding and casting in mind. I figured I could make a few simple improvements to this design. This was relatively straight forward and involved opening the space between the magnets and the windings so that the magnets are held in tightly but not totally surrounded by PLA to increase the magnetic flux. Secondly, make the stator slots slightly smaller to hold the windings in a tighter fit, again closer to the magenets.
 |
 |
Failed magnetic filament print
So I first wanted to test printing in conductive graphene PLA filament which we had lying about in the lab. Using a conductive material for my stator housing I think could really improve the magnetic flux from the magnets to the wire, and possibly improve the overall efficiency of the generator.
For this all you have to do is set the print temperature to 220 degrees (c). It was 1.75 mm filament and so worked on our Makerbot, only that after about half hour or so the filament (maybe because it was old) kept on cracking in the feedline so clogging up the extruder and stopping the print. At first we thought it could have been the infill spacing, but after the second go we saw it was the filament. Here are my failed attempts:
 |
 |
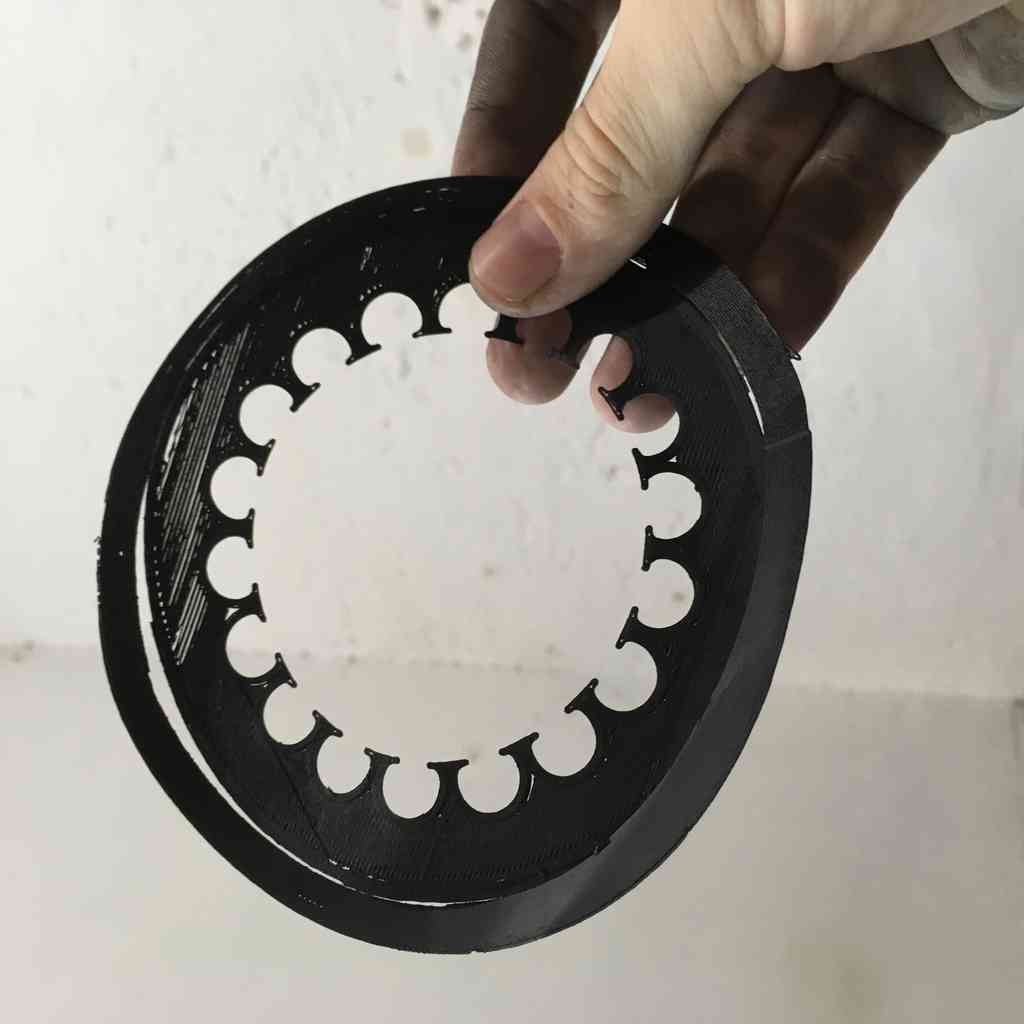
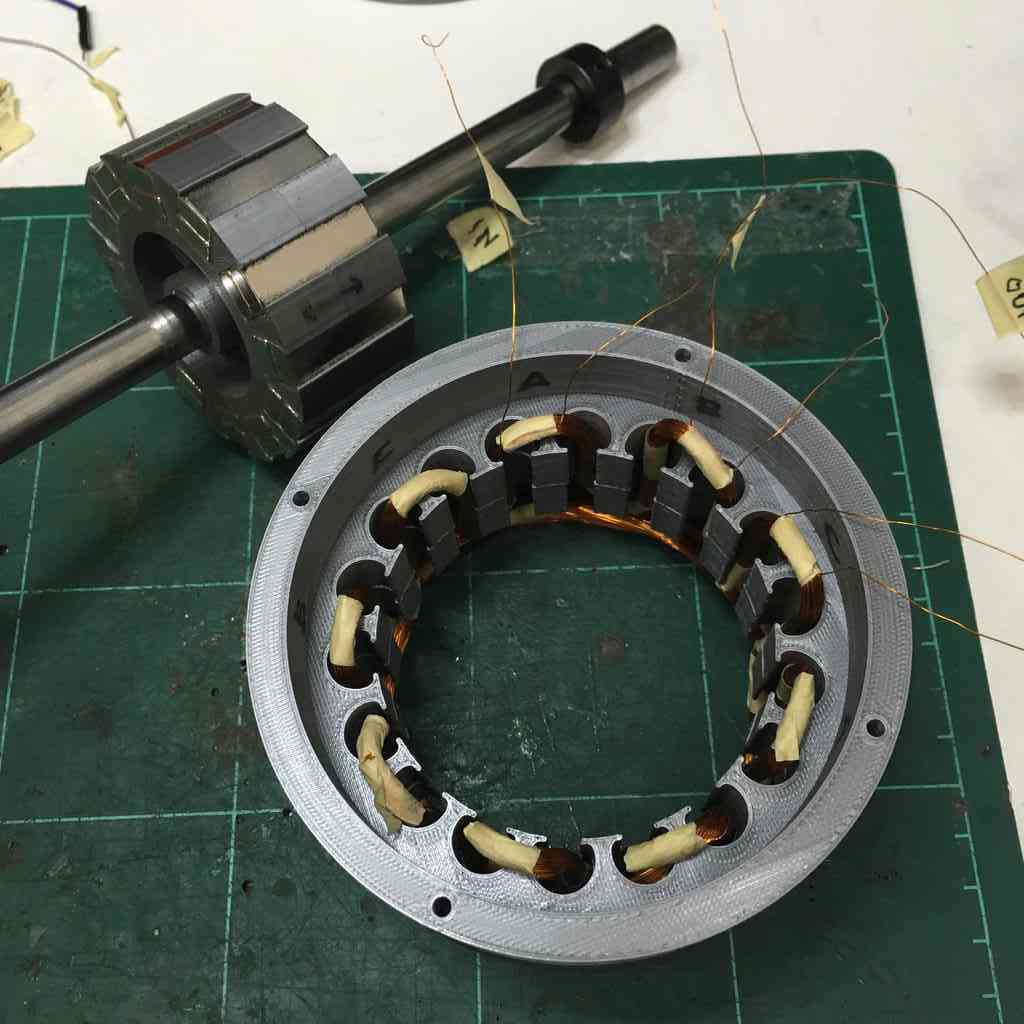
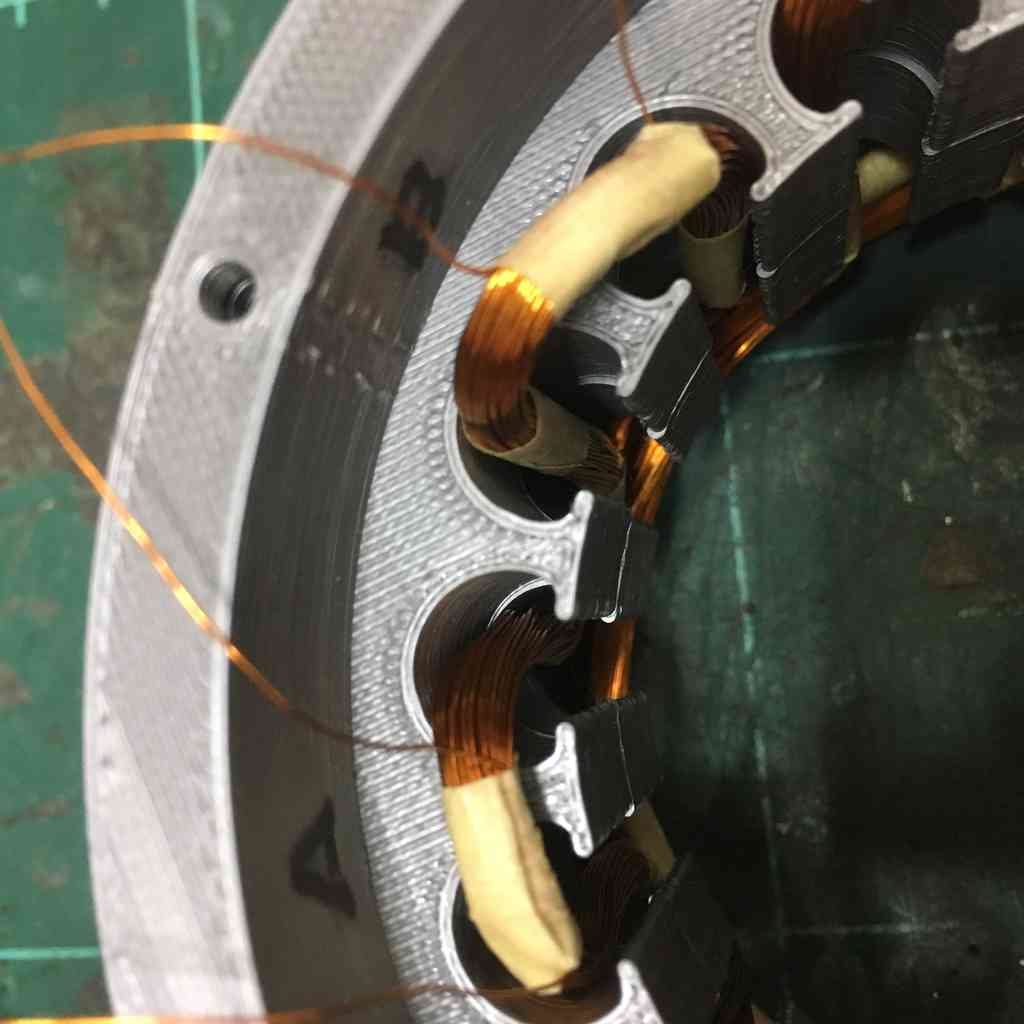
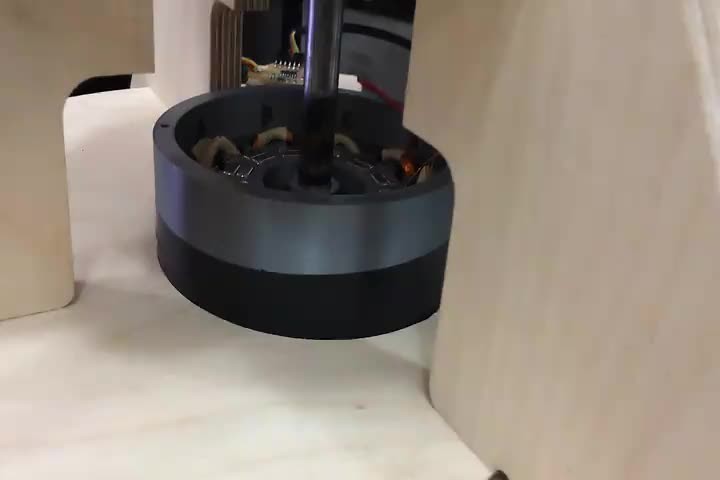
Back to PLA
After a few attempts I gave up on the conductive graphene and went back to simple PLA. Here are my stator and rotor with windings and magnets.
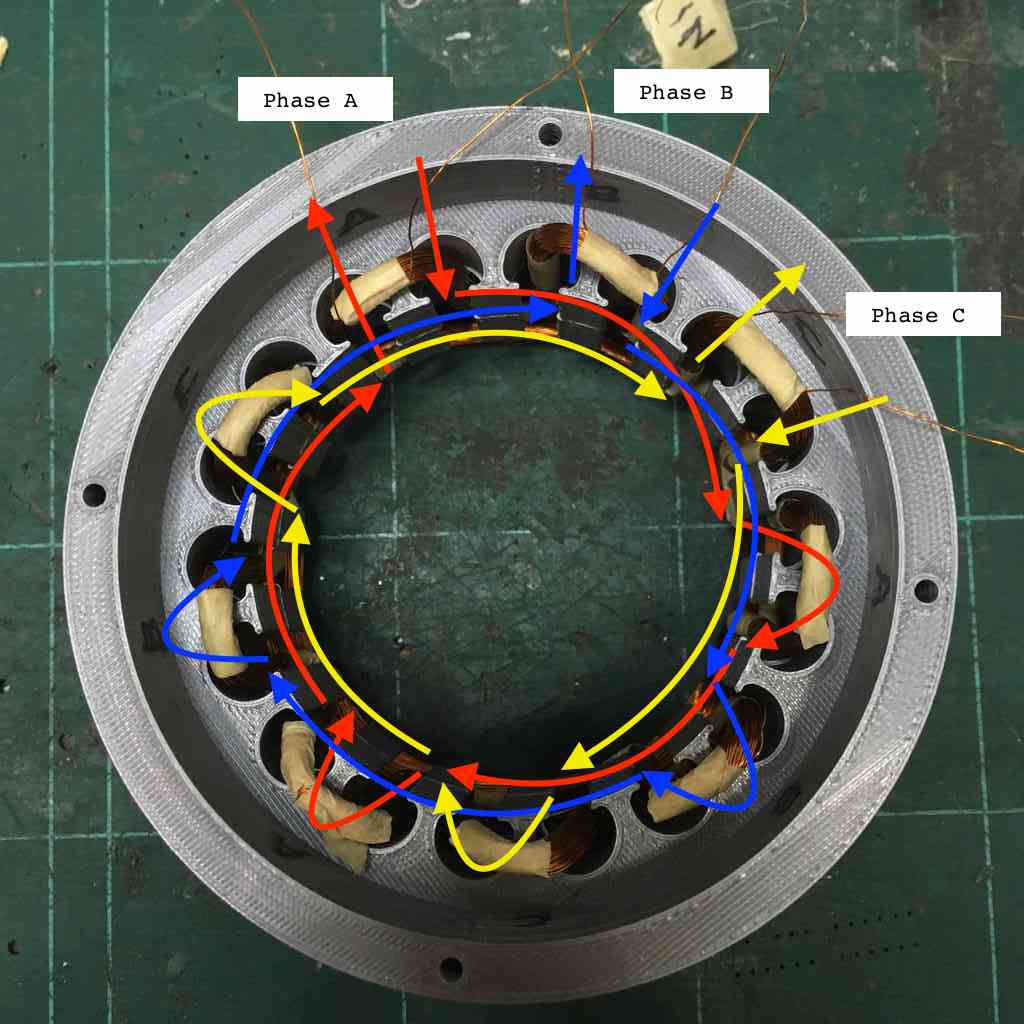
3 phase power
In a symmetric three-phase power supply system, three conductors each carry an alternating current of the same frequency and voltage amplitude, each with a phase difference of one third of a cycle. It should look something like this:

The common reference is usually connected to ground and often to a current-carrying conductor called the neutral. This is why many common house-application inverters have three pins.
Why the Wye configuration?
There are two basic configurations of three-phase power, Delta and Wye. The Wye (shaped like a Y) is the more common one, and it’s main advantage to wye power is that the phase-to-neutral voltage is equal on all three legs. In Delta configuration, the phase voltage is equal to the line voltage, whereas in Y configuration, the phase voltage is the line voltage divided by root 3 (sqrt(3) = 1.732).See here:

This makes Wye ideal for connection to earth ground because of the neutral point symmetry. Wye also provides lower insulation stress, important for high voltages. A Delta on the other hand is useful for dedicated loads, and where grounding is not as important or other technical reasons. It is also well suited for lower voltage higher current. Further reading on this here and for more info on this subject I highly recommend phase converterinfo
This is what a 3 phase wye configuration looks like in action:
STOP. Rewind
Turns out after quite a lot of testing and abuse in my earlier prototype, I had torn some of my windings and some had become loose and tangled after lots of fiddling.
This was no doubt affecting the balance and performance of my generator, as with my original drill tests I was getting some strange readings.
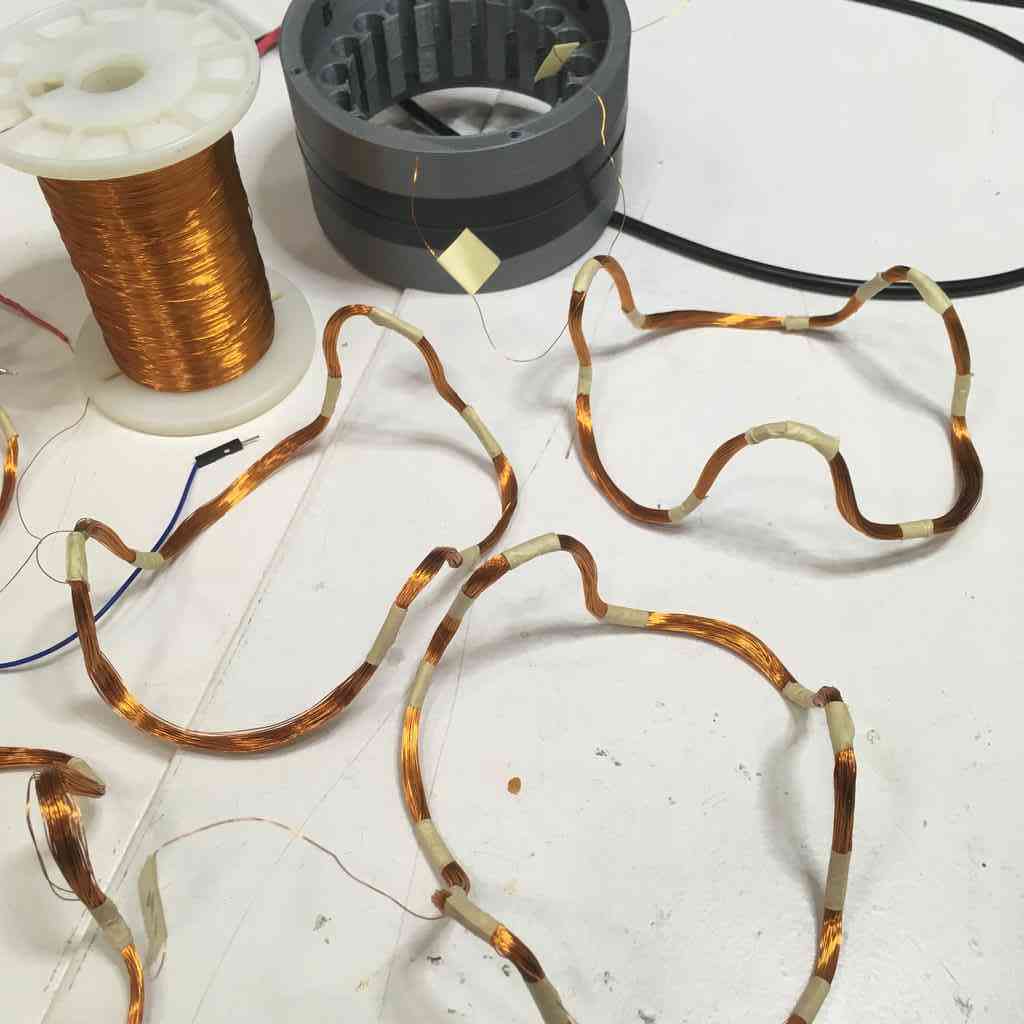
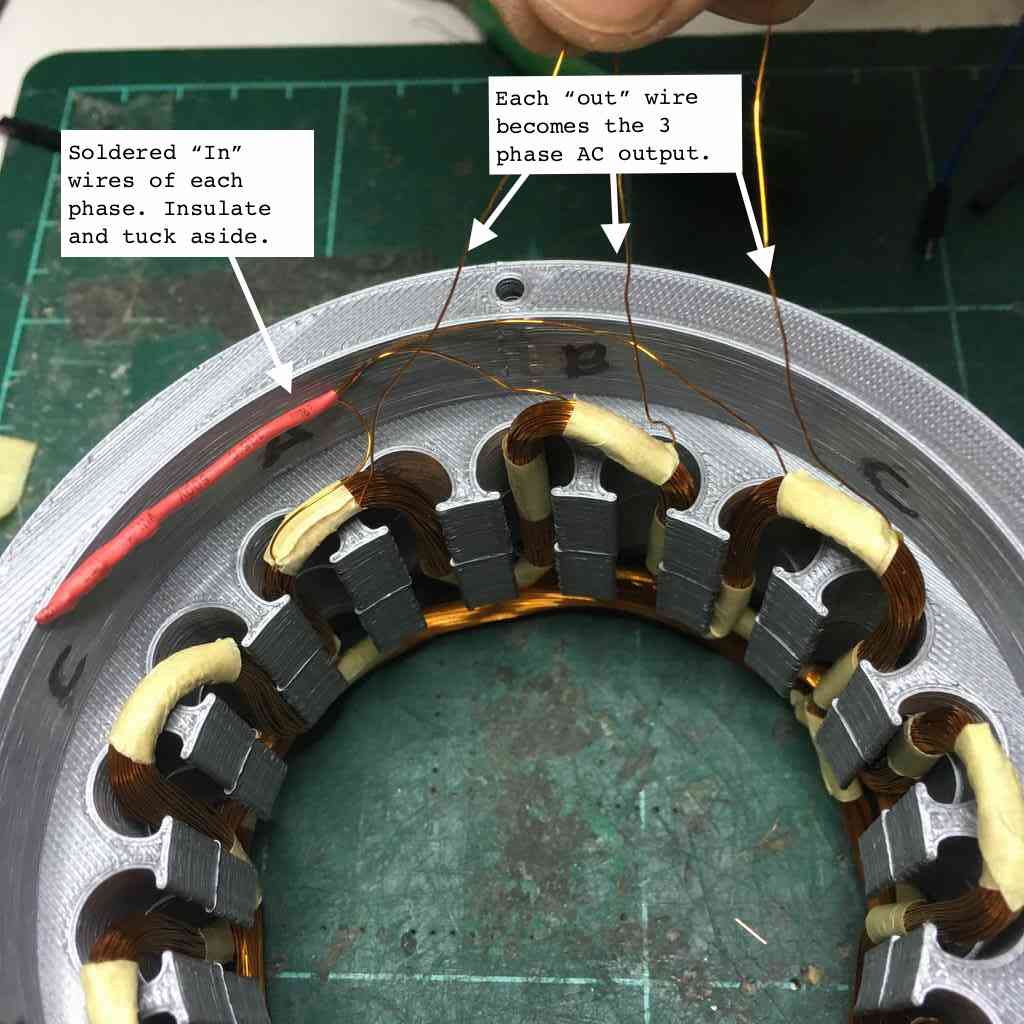
Using the same rustic method outlined in prototype to rewind another 3 phases this time with 100 turns x 0.2 mm gage wire See above.
My thinking with here is that will the same low gage (0.2 mm) wire and more turns I will have more resistance and therefore be able to pull more current at a lower wind speeds. Lets try.
 |
 |
Generator specs
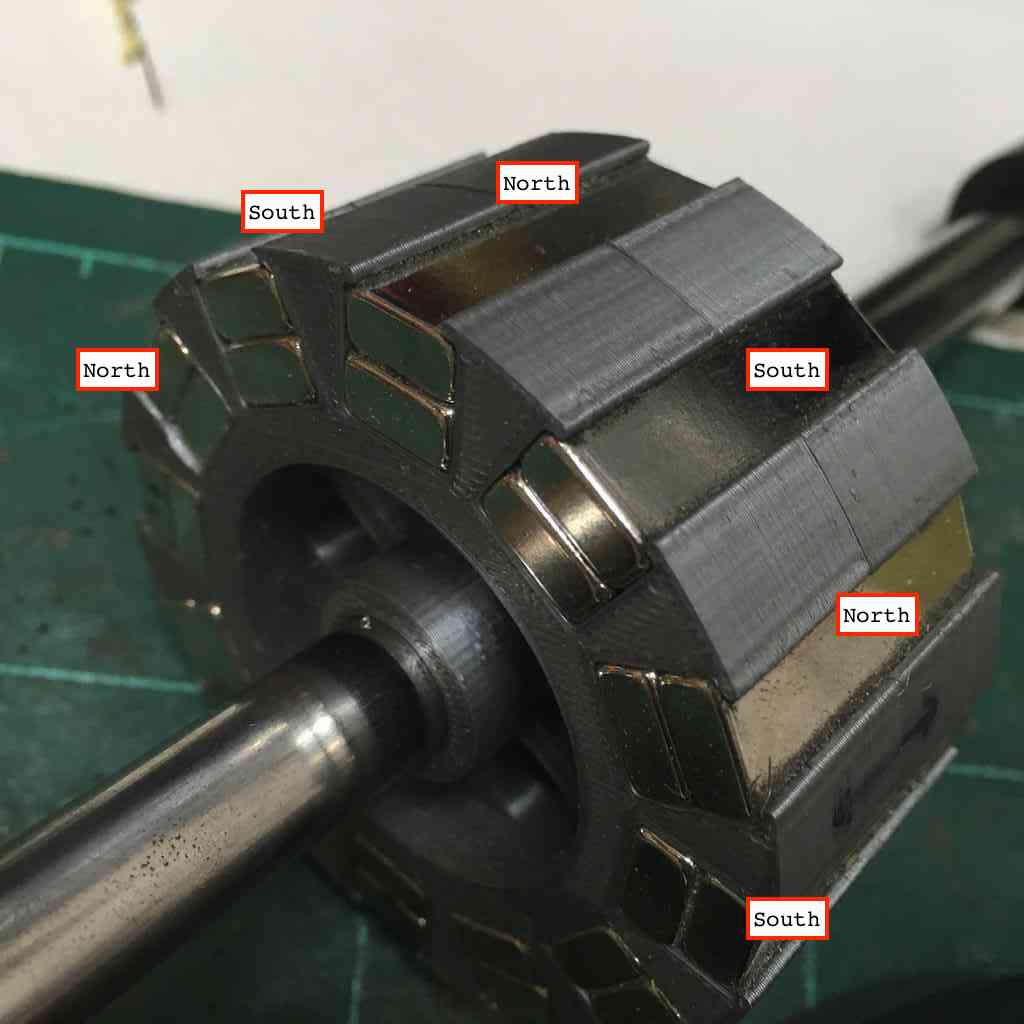
- 24 back to back 10x5x30 neodimium magnets
- 12 slot rotor housing the magnets, alternating poles.
- 3 phase wye configuration stator core
- 1 phase = 100 turns of 0.2 mm gage copper wire
 |
|
Measuring three-phase power
First off a massive shout out and thanks to my buddy Greg Durrens who happened to be swing by the FabLab. He not only showed me how to carry out some basic tests, but also taught me how to correctly use an Oscilloscope and understand some necessary basics! His electrical engineering experience was vital to helping me understand how to successfully measure the power output of my generator.
AC/DC
Living easy, living free, Season ticket on a one-way ride, Asking nothing, leave me be Taking everything in my stride…
Alternating Current (AC)
As the name indicates, AC alternates. That is it flows one way, then the other way, continually reversing direction between positive (+) and negative (-).
The rate of changing direction is called the frequency of the AC and it is measured in hertz (Hz) which is the number of forwards-backwards cycles per second.
Most mains electricity operate on alternating current which we then convert into a steady DC supply to power our household electronics and devices. Similarly, our alternator is producing 3 phase alternating current which we have to convert to direct current to render useful.
Direct Current (DC)
Direct Current (DC) is very much a one way ride. While it is always flowing in the same direction it may increase and decrease. Electronic circuits - especially those running our AVR microprocessors, normally require a steady DC supply. This means a constant at one value or a smooth DC supply which has only a small variation or ripple.
For more on this, Electronics Club have a great explanation on the subject. Here you can see the difference between the two measured against time.

Root Mean Square (RMS)… huh?
The value of an AC voltage is continually fluctuating like a wave from zero up to the positive peak, through zero to the negative peak and back to zero again (see green sine wave above). Clearly for most of the time it is less than the peak voltage, so this is not a good measure of its real effect.
This is why we use the root mean square voltage (VRMS) which is 0.7 of the peak voltage (Vp). The same applies to amps. When measuring AC on a multimeter we are showing the RMS value of the voltage or current. This is calculated as:
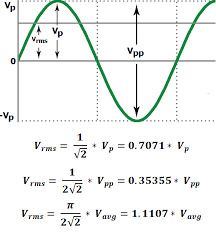
The RMS value is the effective value of a varying voltage or current. It is the equivalent steady DC value which gives the same effect. For example, a lamp connected to a 6V RMS AC supply will light with the same brightness when connected to a steady 6V DC supply.
If you want to understand the math of RMS look here. But otherwise, just accept it is a far more useful way of measuring AC than looking at peak voltage.
RMS vs peak voltage?
When using AC voltmeters and ammeters show the RMS value of the voltage or current. If the peak value is meant it should be clearly stated, otherwise assume it is the RMS value. In everyday use AC voltages (and currents) are always given as RMS values because this allows a sensible comparison to be made with steady DC voltages (and currents), such as from a battery.
Comparing Frequencies
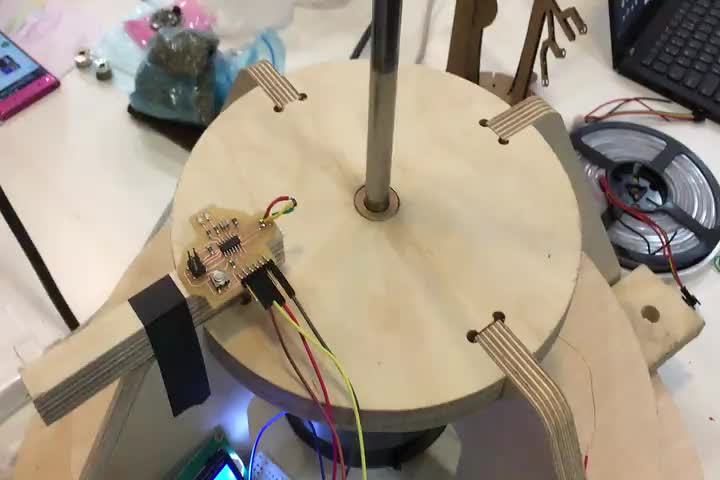
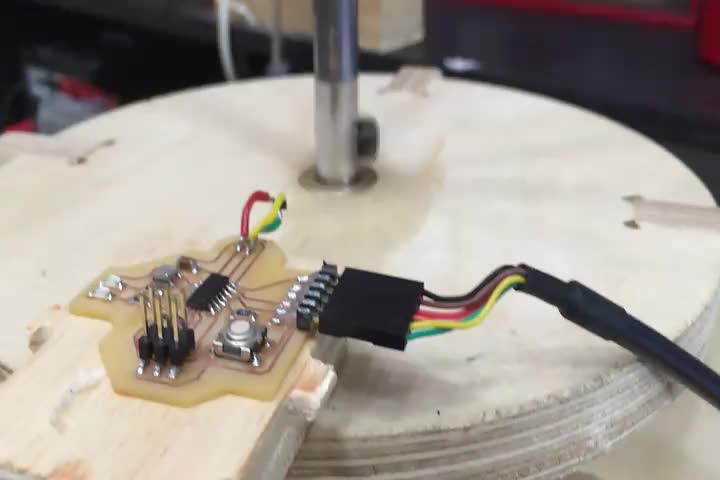
Since I have designed and programmed by own Hall sensor tachometer, I wanted to put this to the test and compare the RPM measurements with the frequency readings on the oscilloscope. As I will be using a power drill to spin my turbine, it is useful to know exactly what speed it is turning so that we can simulate the wind speed. Here is me setting up my RPM counter.
Why RPM?
Frequency in electronics is measured in Hertz (Hz). One Hertz is equal to one cycle (or one event) in a second. What this my RPM counter is doing is counting the number of times a magnet is passing a hall sensor each second. The RPM will allow me to gage the wind turbine efficiency.
Coil resistance
First off it is important to measure the internal resistance (ohms) of each coil phase with a multimeter. For 100 turns of 0.2 mm copper wire I was getting:
| Phase A | Phase B | Phase C |
|---|---|---|
| 16.2 | 16.3 | 16.5 |
Testing each individual phase
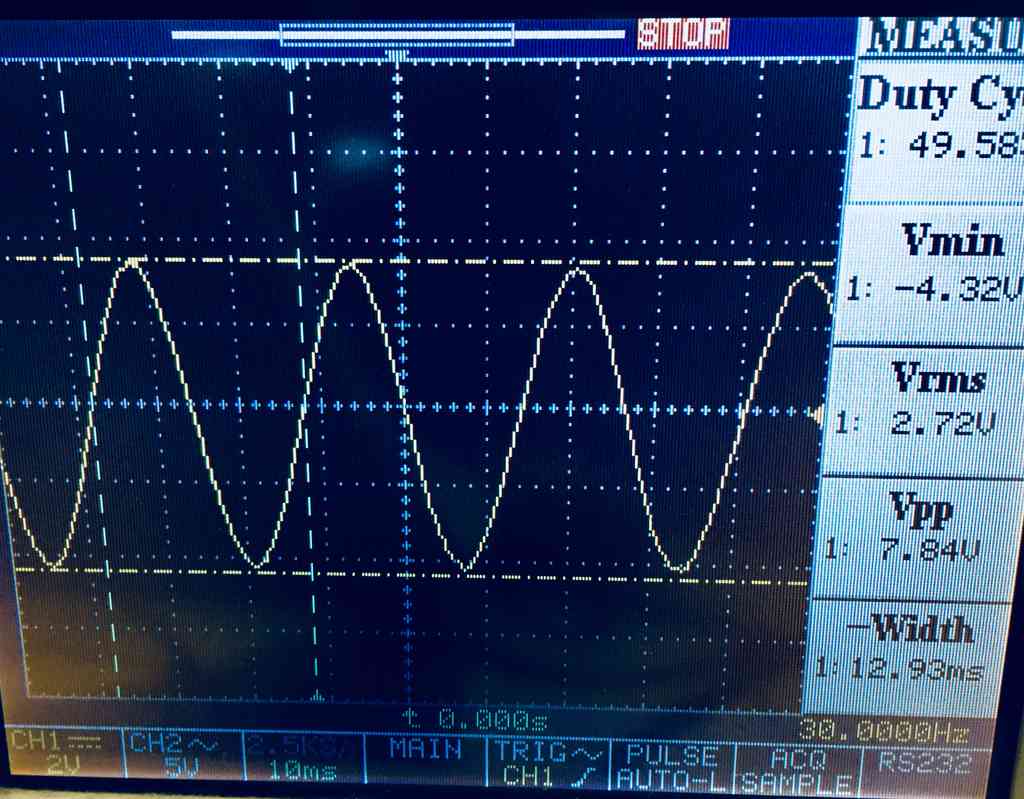
Here I first tested each of my 3 phases (coil windings) individually using my hand to spin the shaft, and used the oscilloscope to read the frequency (Hz) for one wave, VRMs, the Vmin and Vpp. I have added the Resistance (OHMS) that I measured separately using the multimeter. Here below are my findings:
| Readings | Phase A | Phase B | Phase C |
|---|---|---|---|
| Res (Ohms) | 16.20 | 16.30 | 16.50 |
| Freq (Hz) | 45.45 | 38.46 | 43.86 |
| Time (ms) | 22.00 | 26.00 | 22.80 |
| Vpp (v) | 9.04 | 7.84 | 9.20 |
| Vmin (v) | -4.96 | -4.32 | -4.96 |
| Vrms (v) | 3.15 | 2.72 | 3.19 |
| *RPM | 454.5 | 384.6 | 438.6 |
Here I was just measuring the period for one cycle. The period for six cycles (I have 12 magnets so 6 poles N/S) will be 6 times as long. So because frequency is the inverse of the period, the frequency would then be 1/6 that measured with the one cycle.
Therefore for RPM, I take the frequency (Hz) of one cycle and divide this by 6 and then multiply by 60. Using this method also tells me that my tachometer was more or less on point (I think I may need to double check the Attiny44 clock settings.)
Here below you can see a snapshot of Phase B in this test.
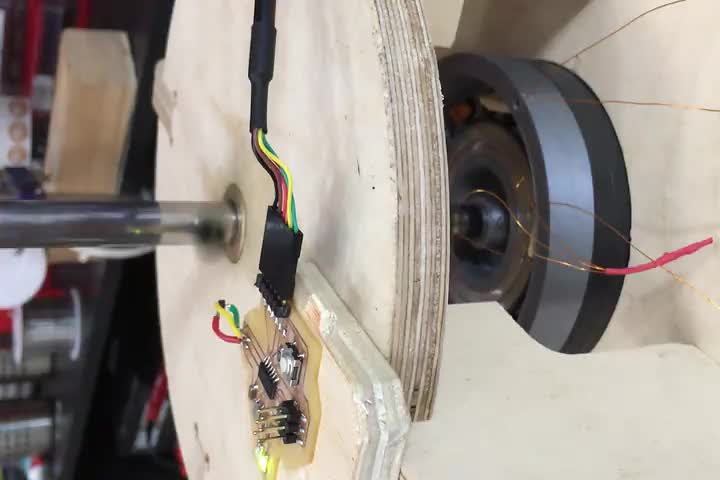
Power Drill testing
Here you can see my low-tech drill testing setup (again thanks Greg for the help here) with the oscilloscope reading one of my three phases and the tachometer measuring the RPM, which I will verify using the frequency readings.

With this setup I carried out the same test of each individual phase maintaining a constant 300 RPM. Obviously with this setup and using a plastic clamp on the drill trigger it was hard to maintain a constant speed, but monitoring my tachometer helped to make sure I was more or less on point when I stopped the oscilloscope to take a reading.
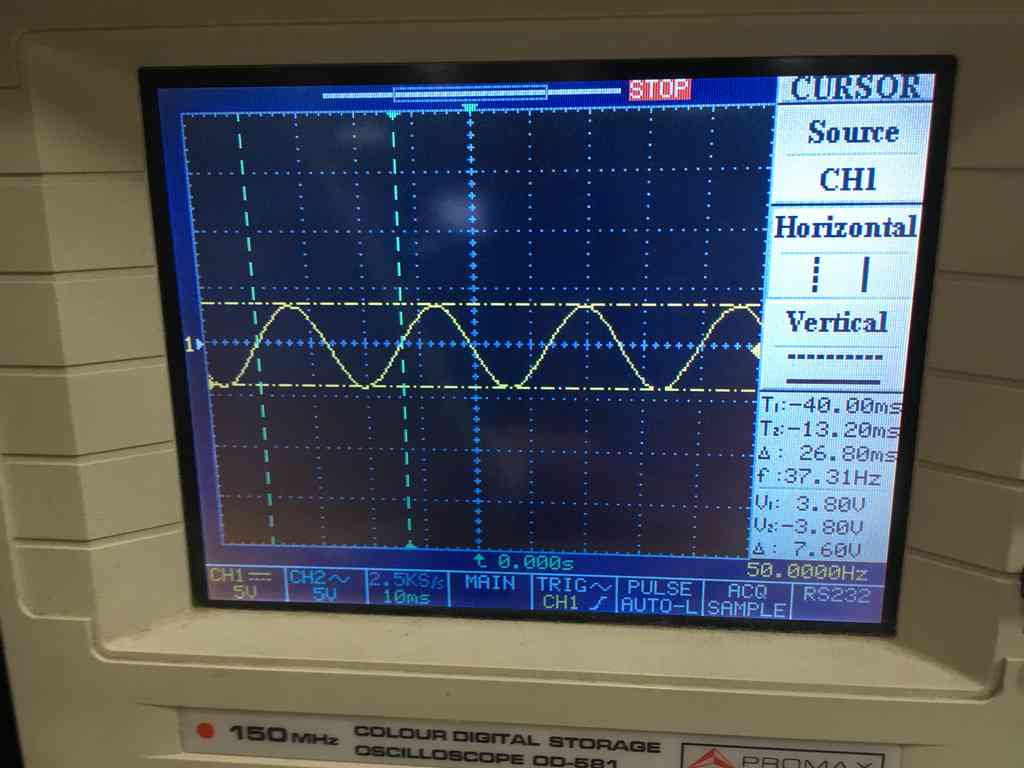
The pictures show Phase B:
 |
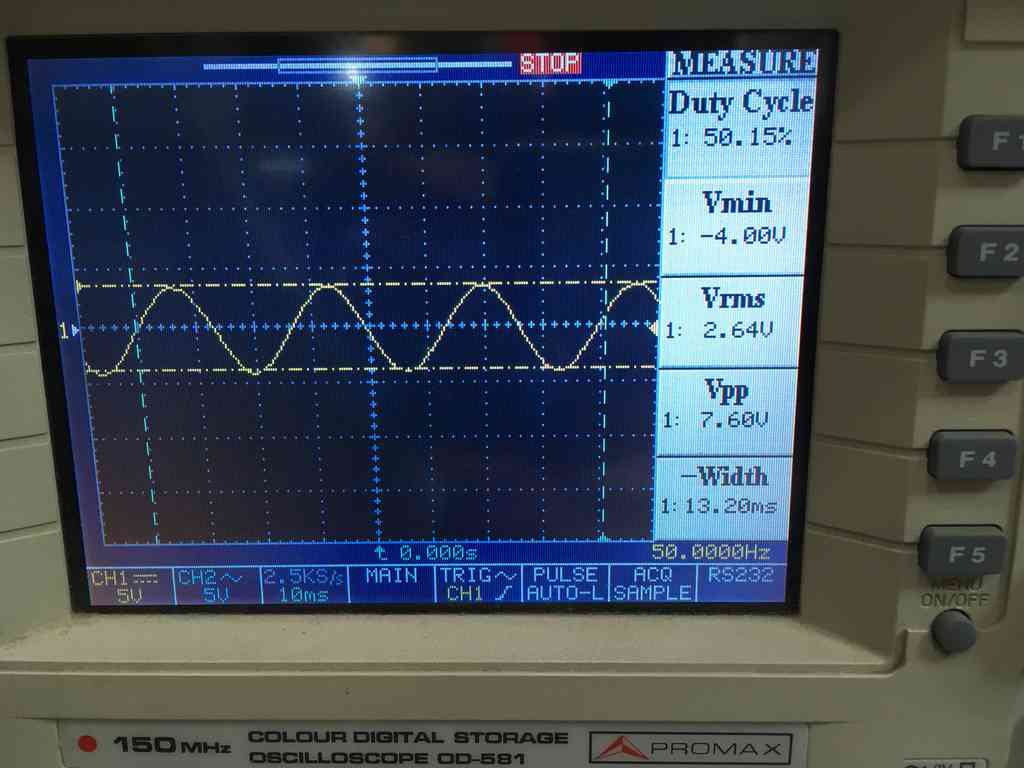 |
| Readings | Phase A | Phase B | Phase C |
|---|---|---|---|
| Res (Ohms) | 16.20 | 16.30 | 16.50 |
| Freq (Hz) | 36.76 | 37.31 | 36.23 |
| Time (ms) | 27.20 | 26.80 | 27.60 |
| Vpp (v) | 7.80 | 7.60 | 7.40 |
| Vmin (v) | -4.00 | -4.00 | -3.60 |
| Vrms (v) | 2.65 | 2.64 | 2.53 |
| *RPM | 367.6 | 373.1 | 362.3 |
We can see here that the three phases are more or less equal under similar frequencies. I also verified the voltage output using the multimeter (~) and it was giving me 2.3 volts. Not too far off my Vrms readings.
We can figure out the voltage to RPM curve by dividing the Vpp by RPM, and multiplying by 1000 to figure out how much I would get at 1000 RPM:
| V/RPM | Phase A | Phase B | Phase C |
|---|---|---|---|
| Vpp/RPM | 0.0212 | 0.0203 | 0.020 |
| Vpp@1000 RPM | 21.2 | 20.3 | 20.4 |
To convert that into RMS we use:
\[Vrms = \frac{Vpp}{2\sqrt{2}}\]So to use the average which is the Vpp @ 1000 RPM:
\[\frac{20.3}{2\sqrt{2}} = 7.17 Vrms\]Measuring power via resistance:
\[Power = \frac{V^2}{R}\]To figure out the Power Max to Load, we create a load that is the same resistance as the windings (16.3 Ohms).
Because half of the power would go to the load and half to the windings, we can calculate the Max Power of one phase at 1000 RPM by:
\[PowerMax = \frac{1}{2}\frac{7.17^2}{(16.3 + 16.3)}\] \[PowerMax/phase = 0.78 Watts\] \[PowerMax 3 phase = 2.36 Watts\]Connecting my 3 phases into a wye config
Now for a power spin
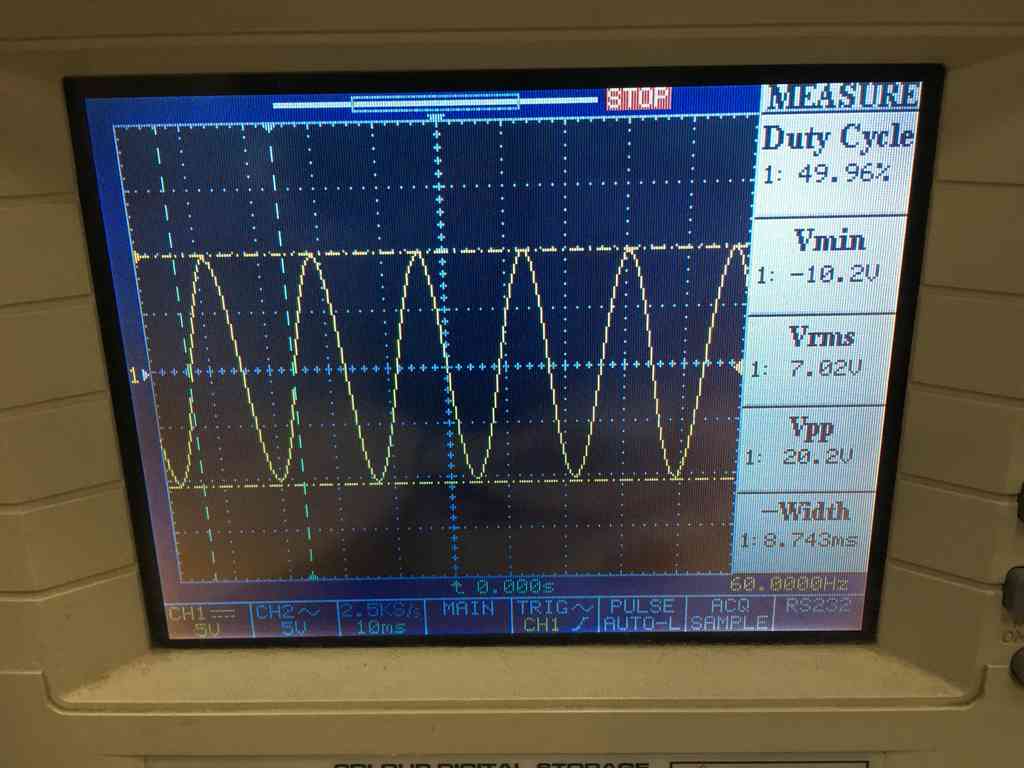
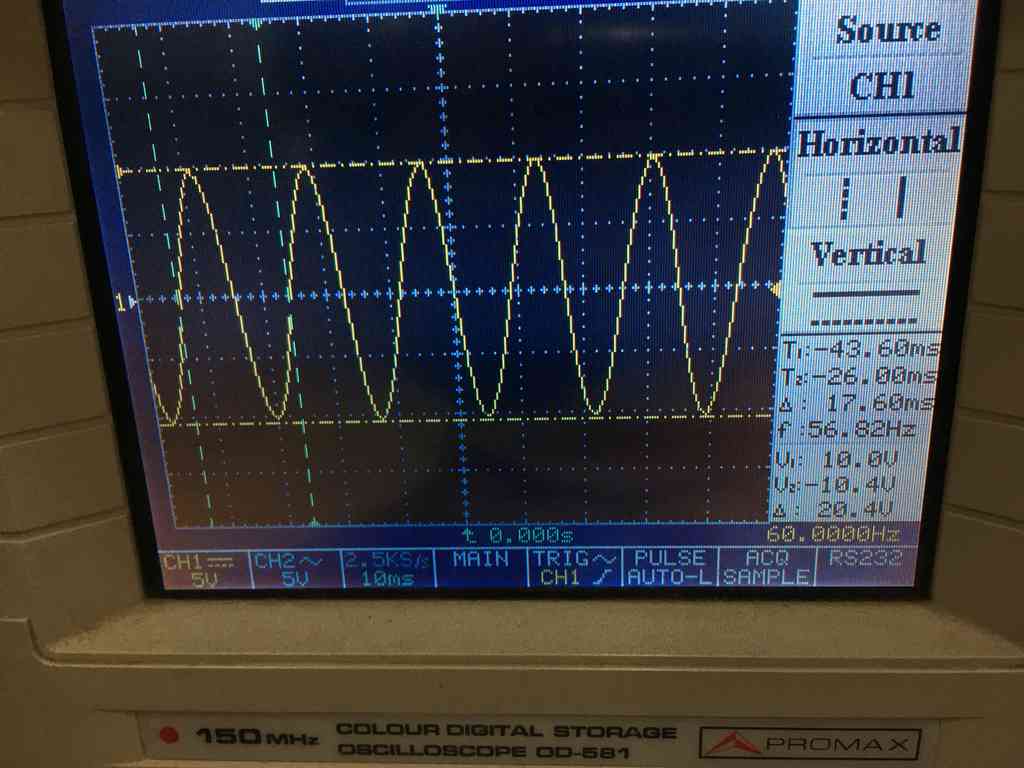
Now I wanted to take this on another spin test with the power drill, similar to how I was testing the individual phases above, now what I tested we each of three pairings each at circa 600 RPM. Here are my findings:
| Readings | Phase AB | Phase BC | Phase AC |
|---|---|---|---|
| Res (Ohms) | 33.5 | 33.1 | 33.1 |
| Freq (Hz) | 62.50 | 54.35 | 56.82 |
| Time (ms) | 16.0 | 18.40 | 17.60 |
| Vmin (v) | -10.4 | -10.0 | -10.2 |
| Vpp (v) | 20.6 | 19.8 | 20.2 |
| Vrms (v) | 7.12 | 6.84 | 7.02 |
| *RPM | 625 | 543.5 | 568.2 |
Below is a snapshot of Phase AC:
 |
 |
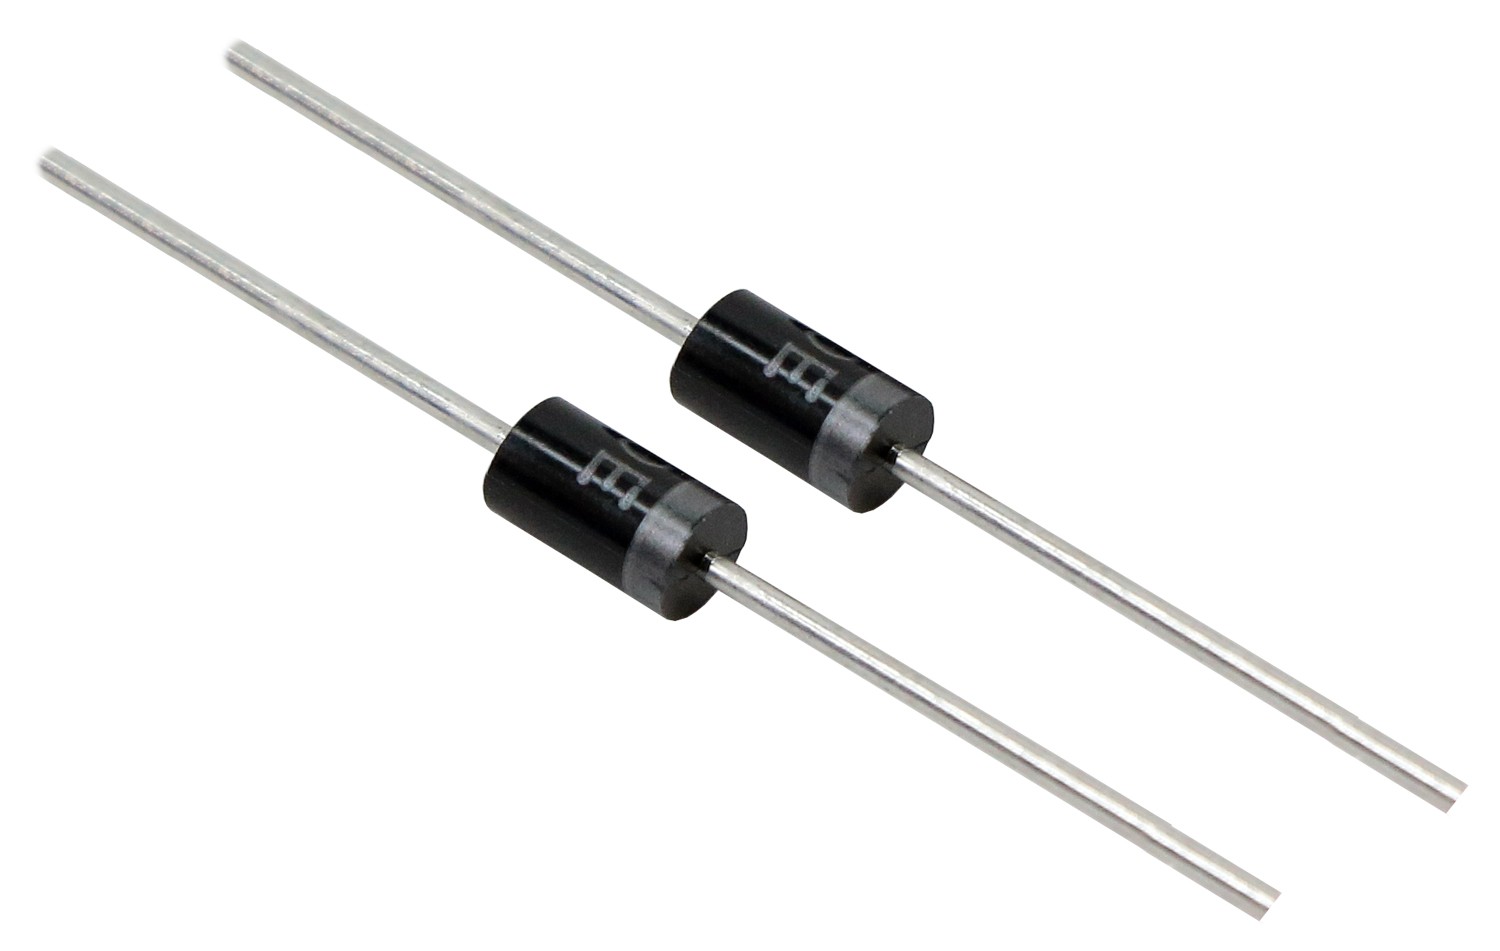
Rectifying AC to DC using some diodes
Using some simple diodes it is relatively simple to create a bridge rectifier. This is relatively straightforward and looks something like this:

For the diodes we had a bunch of these bad boys gathering dust in the electronics drawer:
Here they are hooked into a bread board and lighting a couple of LED with just aa few hand spins. Disregarding all the equations and meter calculations, seeing a flashing LED was a very happy moment!
Measuring power using current and voltage
This is known as the PIV triangle, which is used in the same way as Ohm’s law. Where P = power in milliwatts (mW) V = voltage in volts (V) and I = current in milliamps (mA).
\[Power = Current × Voltage\]* Note on your multimeter whether you are measuring Watts and Amps or milliwatts and milliamps!
Measuring current is different to measuring volts in that the ammeter has to be part of the circuit so that current flows through it. Whereas measuring volts all we are doing is measuring the potential different at two points of a circuit.
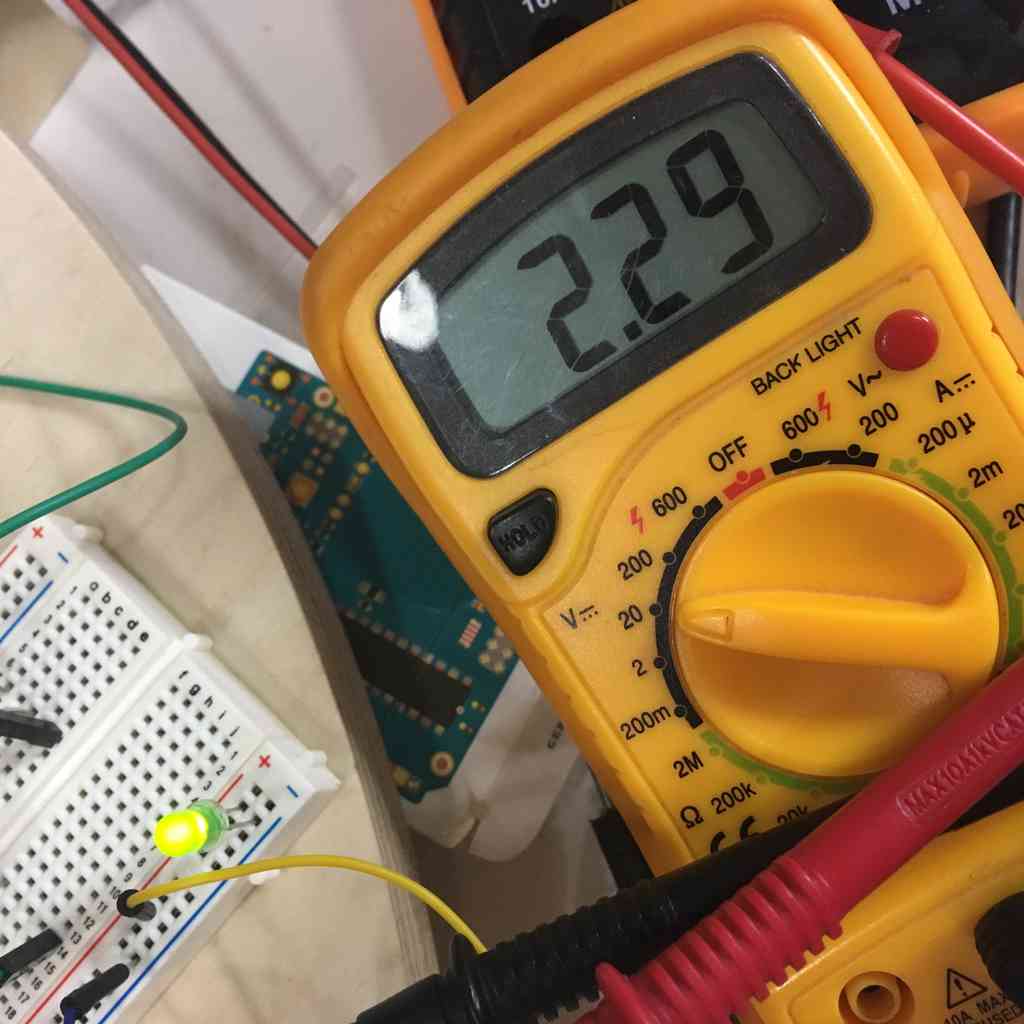
So here I introduced a multimeter/ammeter set to measure current (milliamps) into the circuit and used a one LED as a load.
So as you can see here I was getting 27 milliamps and reading 2 volts on the oscilloscope. So the generator is making 54 milliwatts of power at around 420 RPM.
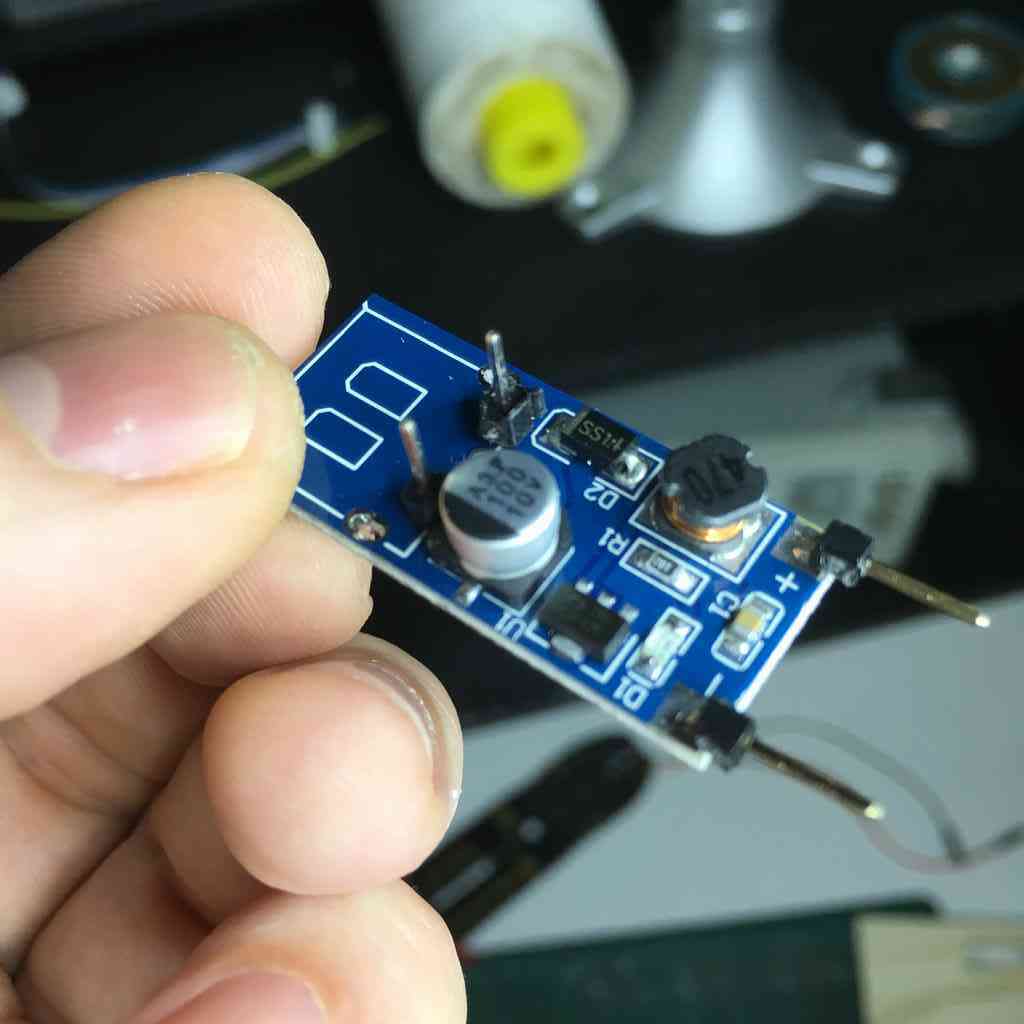
Step-up and supercaps
I’m guessing that my turbine will not be exceeding the 500 rpm mark on a good day and even in lower than that I wanted to make sure I could maintain a steady 5 volts output if I am to run my micro controller boards directly off this.
For this I decided to try out a DC to DC step up or boost converter. These would not be too hard to fabricate in the lab, here is the basic schematic, all you need is a voltage regulator and a 47 uH inductor, besides some caps and diodes:

I would have to make the inductor or buy one, and at this point I am also missing time. They also cost less than a dollar on ebay and I just wanted to try it out first as this is all new ground for me.
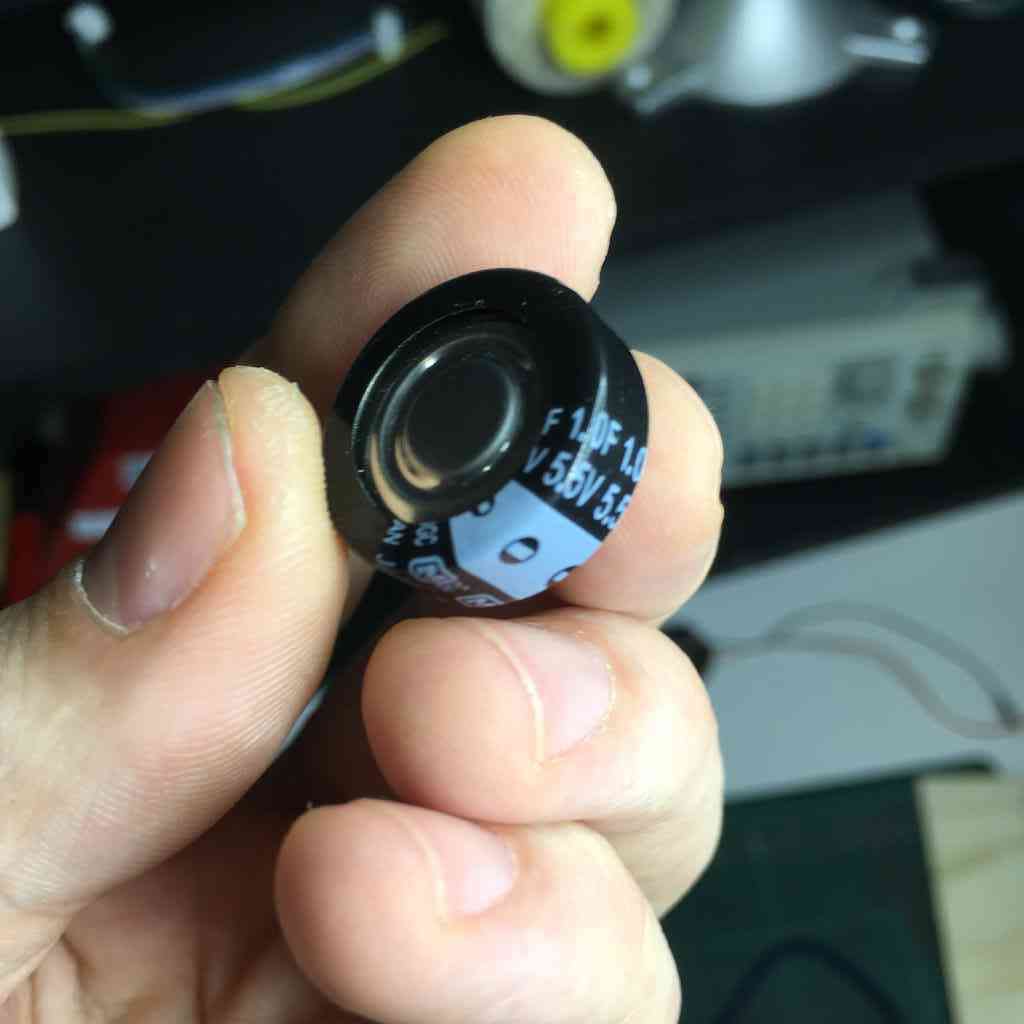
So anyway he is the module (desoldered the USB and soldered in some pin connectors) and some 1 Farad supercaps we had lying around the electronics room.
 |
 |
The charge controller
Here I must acknowledge again Christoph Laimer and his amazing MakeSea project making a 3d printed generator and simple charge controller. He is the reason I got so far. Here is his basic schematic that he uses and I will attempt to prototype, using the PFM module:
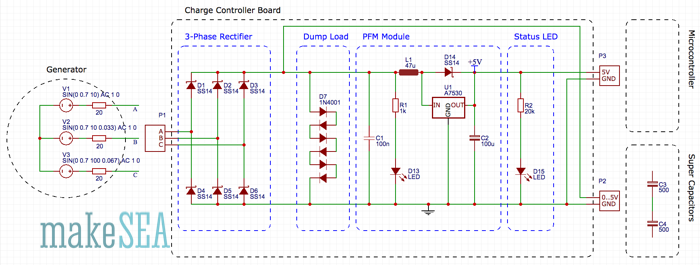
Note that the dump loads are also 7 simple diodes in series. Diodes limit the loading voltage to roughly 5V as the voltage drop of a single diode is roughly 0.7V. Below I have this prototyped using 2x 1farad supercaps in parallel. Though his schematic he shows them in series, not too sure why.
A note on parallel capacitors
With resistors, series connections result in additive values while parallel connections result in diminished values. With capacitors, its the reverse: parallel connections result in additive values while series connections result in diminished values. See here for more about that.
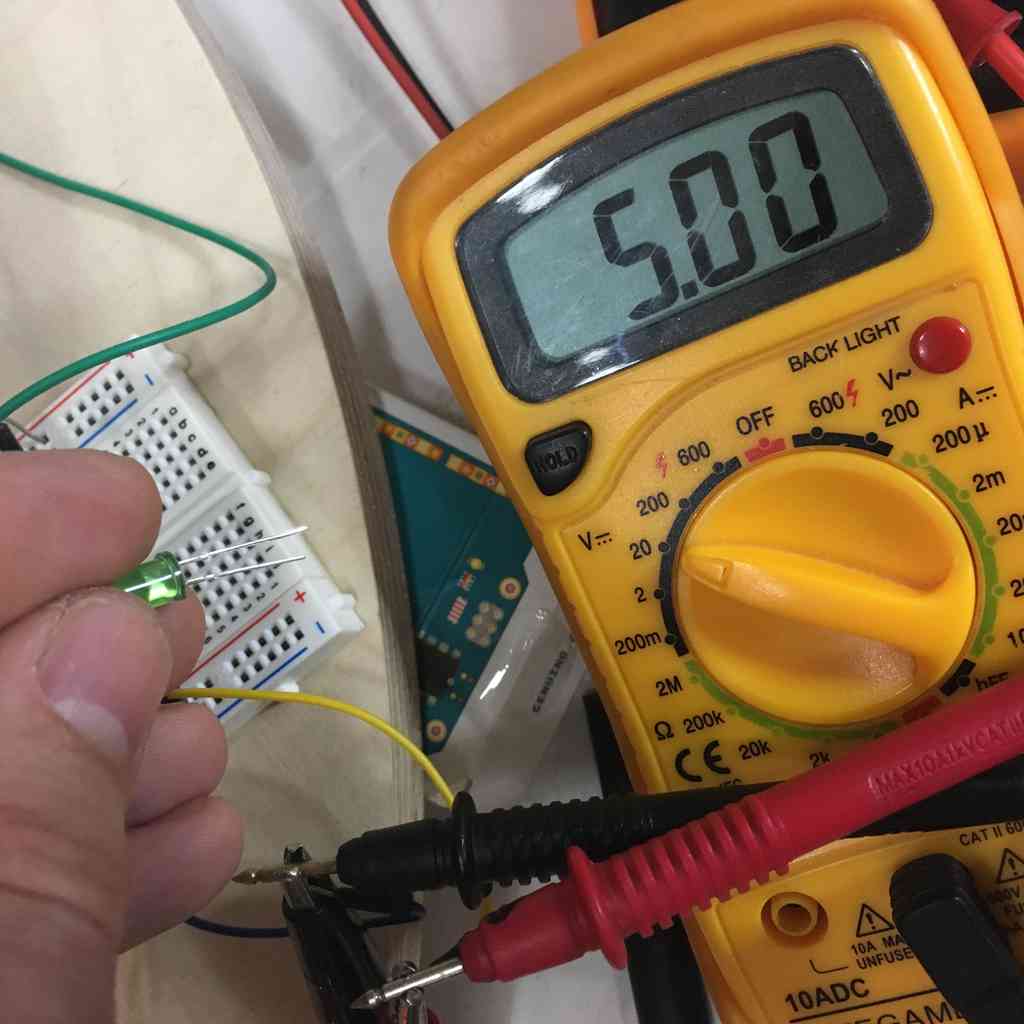
You can note that when I remove the last LED how the drill speeds up because the generator is not longer pushing any load. Also I may have blown that red LED! But below you can when I remove the LED/load the voltage bumps back up to 5 volts. The step up works!
 |
 |