
14. Interface and application programming
Overview
This week's assignment consisted of creating a visual interface, for this we had several options to choose from to create the interface, such as Qt, Processing, App Inventor and FlutterFlow. The option I chose was Qt, because I have worked with this tool before and it is easy to use. Besides, I can do all the programming in Python. However, the other tools are very good for creating visual interfaces. The features of these tools are in the group assignment. You can check it in the following link.
Qt
Qt is a software development framework that enables the creation of graphical user interfaces (GUIs) and cross-platform applications. It was initially developed by the Norwegian company Trolltech and is currently maintained by The Qt Company. Qt is used to develop both desktop and mobile applications and is known for its portability, as it allows applications to be compiled for various platforms without modifying the source code.
Main features of Qt:
Cross-platform
Compatible with Windows, macOS, Linux, iOS, and Android.
Object-oriented
Based on C++, with a strong emphasis on object-oriented programming.
Signal/Slot
A communication system between objects that facilitates the creation of interactive interfaces.
Extensible
Supports the creation of custom widgets and integration with third-party libraries.
Tools
Includes additional tools such as Qt Creator, a complete integrated development environment (IDE).
PyQt5
PyQt5 is a set of Python bindings for Qt5, developed by Riverbank Computing. It allows developers to write applications in Python that use the Qt framework to create robust and modern GUIs. PyQt5 is a popular choice for those who prefer the simplicity and readability of Python over C++.
Main features of PyQt5:
Full access to Qt5
Enables the use of all Qt5 functionalities from Python.
Ease of use
Python is known for its simple syntax and gentle learning curve, making PyQt5 accessible even for novice developers.
Licensing
Offers both a GPL license (for open-source projects) and a commercial license.
Documentation
Extensive documentation and community resources available for learning and troubleshooting.
Qt Designer
Qt Designer is a graphical tool that is part of the Qt toolset, used to design and build graphical user interfaces (GUIs) visually. Qt Designer allows developers to drag and drop widgets (such as buttons, labels, text boxes, etc.) to create the structure of the interface without writing code manually.
Main features of Qt Designer:
WYSIWYG (What You See Is What You Get)
Allows developers to see the final design as they build it.
Rapid design
Facilitates the creation of complex interfaces quickly using predefined widgets.
Integration with code
Generates .ui (XML) files that can be converted to Python or C++ code using tools like pyuic (for PyQt) or uic (for C++).
Customization
Allows the creation of custom designs and the integration of styles and themes.
How to install Qt?
Steps to Create a Virtual Environment in Windows
- Open the terminal and navigate to the folder where you want to create the project.
- Create the virtual environment with the following command:
python -m venv venv - Activate the virtual environment with this command:
call venv/Scripts/activate - Install the necessary libraries within the virtual environment:
- Install PyQt5 with the following command:
pip install PyQt5 - Install PyQt5 Tools to use QtDesigner with this command:
pip install pyqt5-tools - Verify the libraries were installed using:
pip list - For best practices, create a requirements file with:
pip freeze > requirements.txt
- Install PyQt5 with the following command:
- To use QtDesigner, open your file explorer and navigate to the folder where you created the project.
- Enter the folder named "venv".
- Follow these steps to find the "bin" folder:
- Navigate to "Lib".
- Then go to "site-packages".
- Next, open the "Qt" folder.
- Finally, go to the "bin" folder.
- Inside the "bin" folder, find the "designer" application file.
- To avoid repeating these steps, right-click on the "designer" file and send it to the Desktop as a shortcut.
Creating interface in Qtdesigner
The "Smart Garden" interface was designed to monitor soil moisture, temperature, and ambient humidity sensors, along with integrating a camera for visual supervision. The interface was built using Qt Designer, and various design aspects were worked on to ensure a visually appealing and functional presentation.
Interface Dimensions
- Width: 946 px
- Height: 713 px
Components Used
- Label: 27
- Push Button: 3
- LCD Number: 12
- Tab Widget: 1
- Widget: 13
How does the qtdesigner interface work?
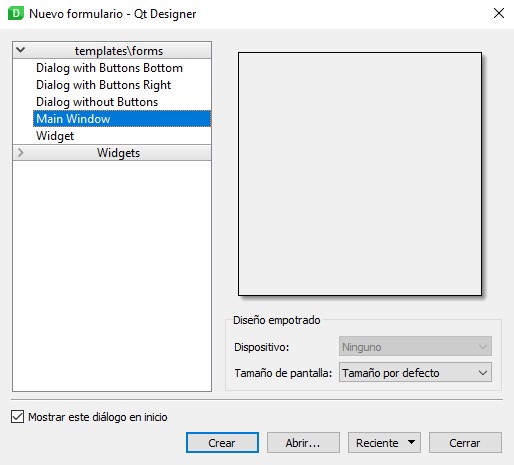
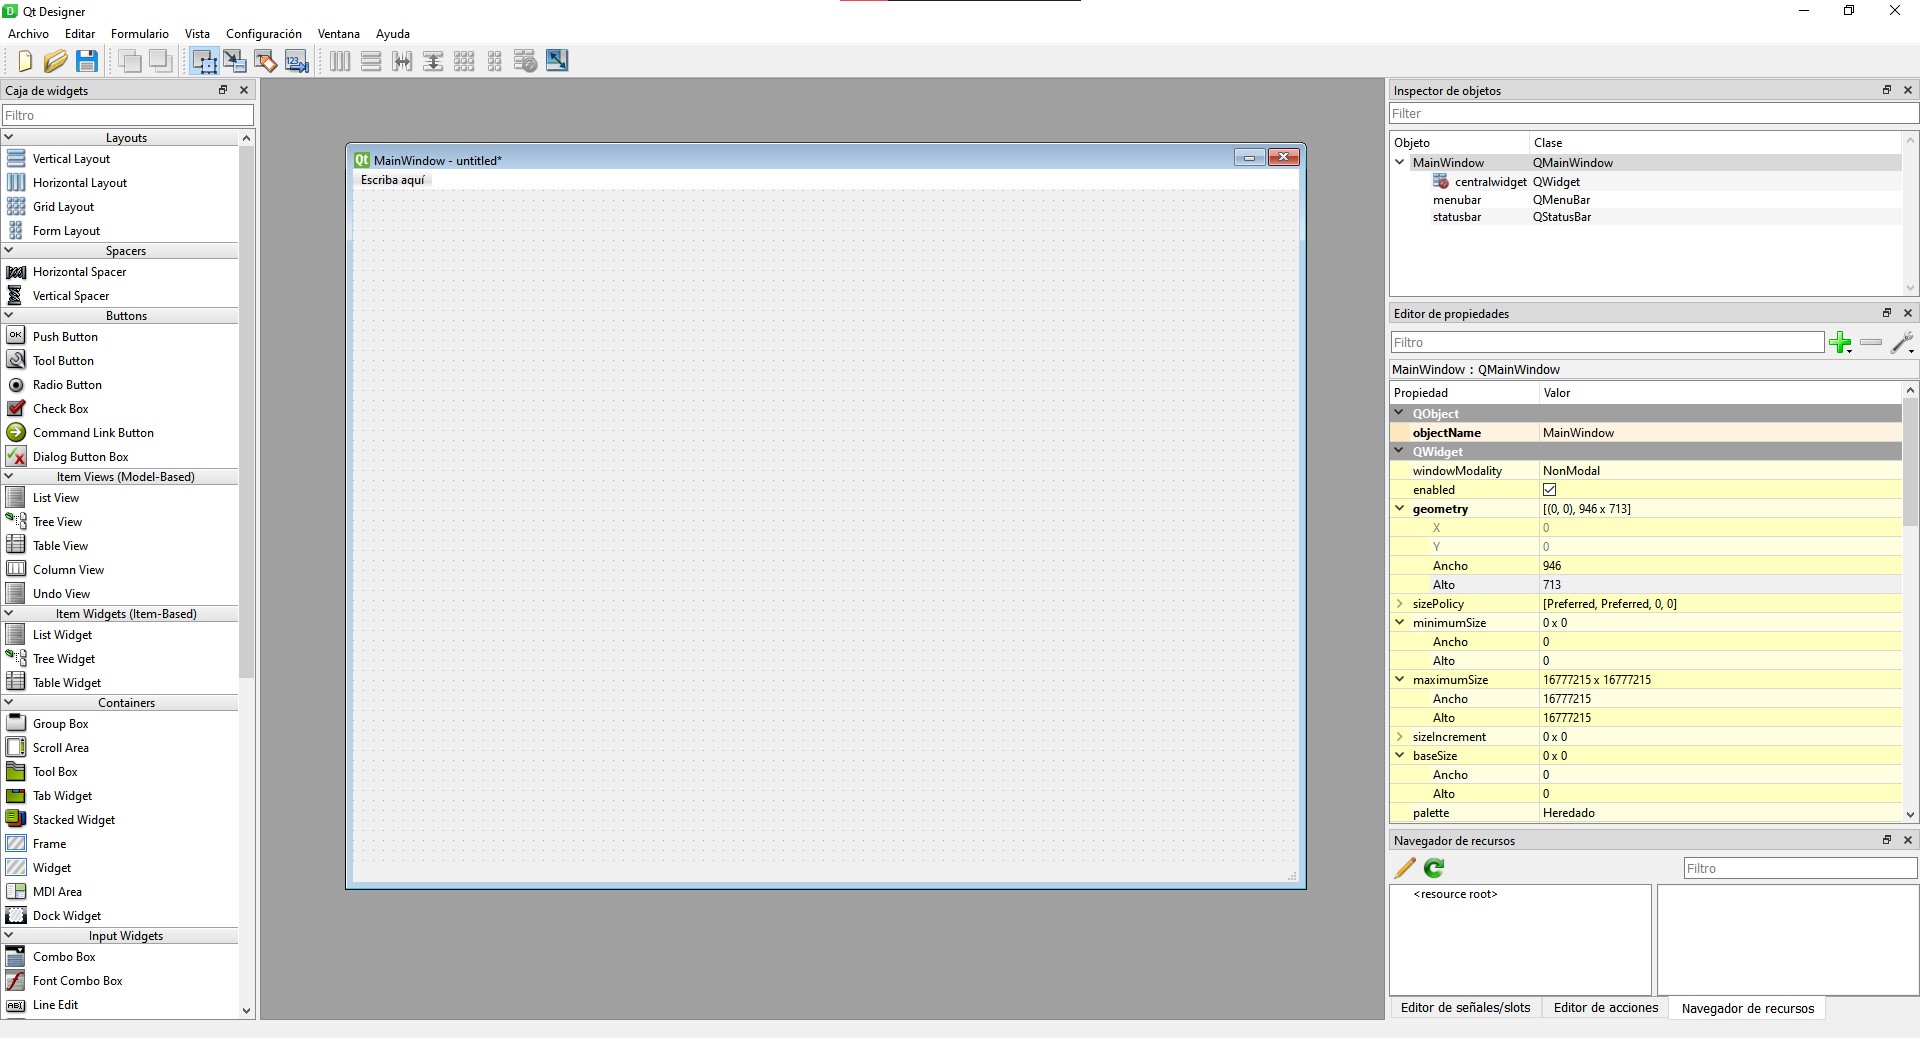
This is the initial window that appears when you open Qt Designer. Here you can choose from various types of base forms like a main window, a dialog with buttons, and other templates. You select a template based on the type of window you need to design, which provides a pre-configured structure that you can modify according to your needs.
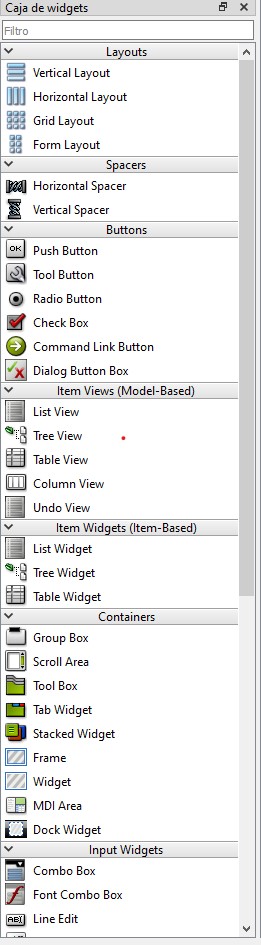
This part shows the widget box in Qt Designer, where all the GUI controls and elements that you can drag into your form are listed. This toolbox is essential for visual design, as it provides the components needed to build interactive user interfaces, such as buttons, labels, text boxes, among others.
This image it's the Object Inspector in Qt Designer, which displays the hierarchy of widgets in the current form. This inspector is useful for navigating between the interface components and adjusting their properties, events, and behaviors. It also allows you to easily select and modify the widgets in the interface.
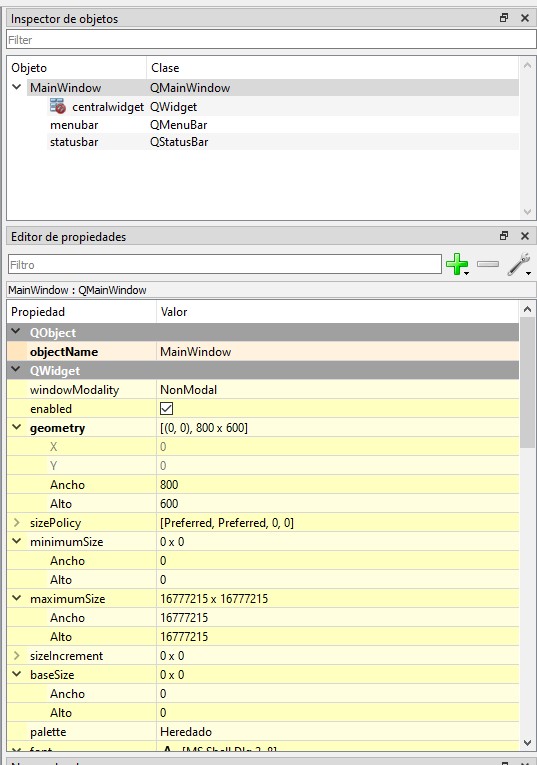
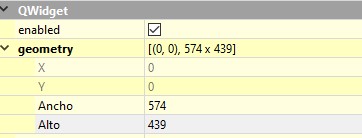
Finally this part displays the properties of a widget in Qt Designer. In this case, you can see the geometry of the widget which defines the position (X, Y) and dimensions (Width, Height) in the window. These properties are crucial for controlling how and where a widget is placed within the user interface of the application.
Creation Process
Initial Setup
The process began by creating a main window with the specified dimensions (946x713 px). A Tab Widget was added to organize information into different tabs: "Home", "Soil Moisture Sensors", "Temperature Sensor", and "Camera".
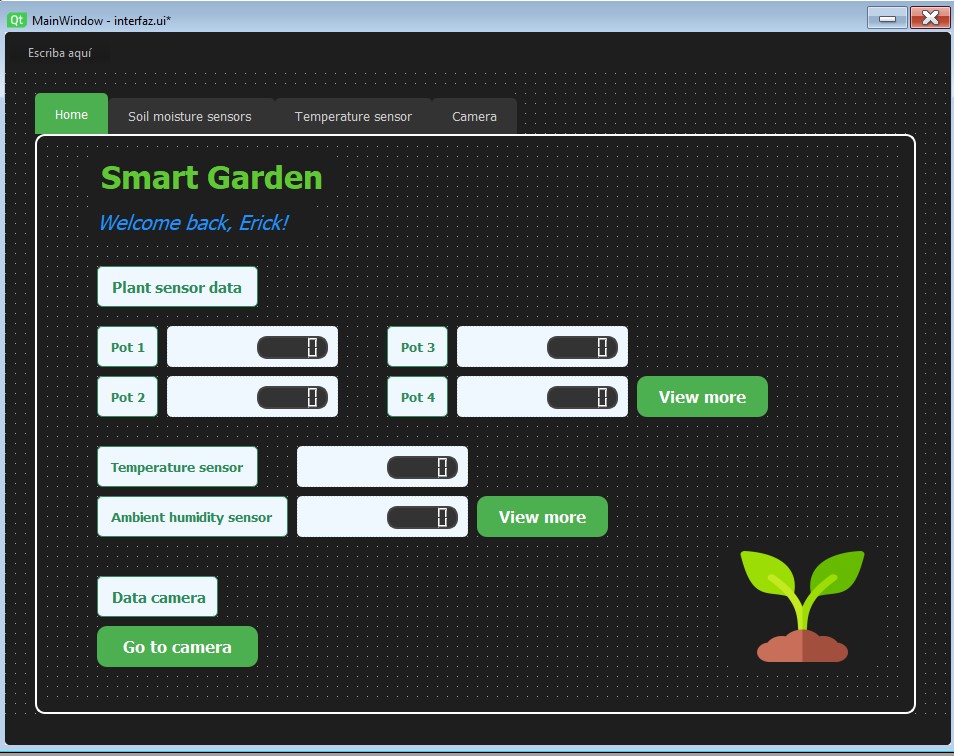
Home Tab
The Home tab serves as the main dashboard for the interface:
- Added
Labelelements for titles and subtitles. - Inserted
LCD Numberwidgets to display sensor data for the pots (Pot 1, Pot 2, Pot 3, Pot 4). - Added
Push Buttonelements that redirect to other tabs:- The first button redirects to the "Soil Moisture Sensors" tab.
- The second button redirects to the "Temperature Sensor" tab.
- The third button redirects to the "Camera" tab.
- Included decorative images to enhance visual appeal.
- Gradually adjusted colors, sizes, and shapes of components to make the interface more attractive.
Result:
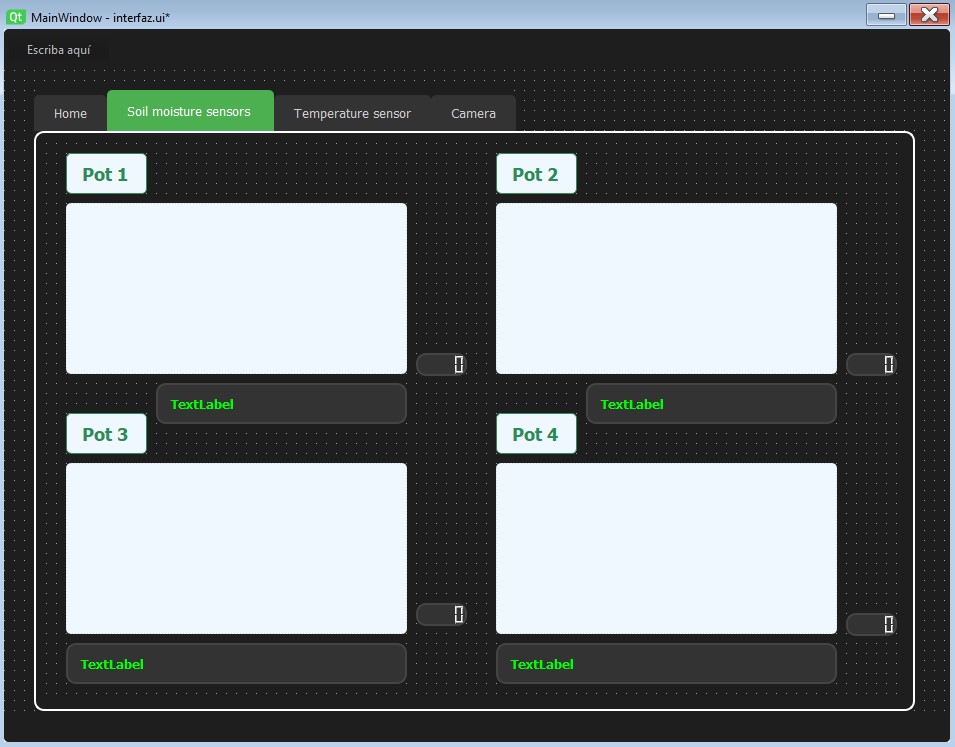
Soil Moisture Sensors Tab
This tab displays data from the soil moisture sensors placed in different pots:
- Divided the section into four areas, one for each pot.
- Used
TextLabelandLCD Numberto display and label data from each soil moisture sensor. - Added toggle switches to simulate sensor control.
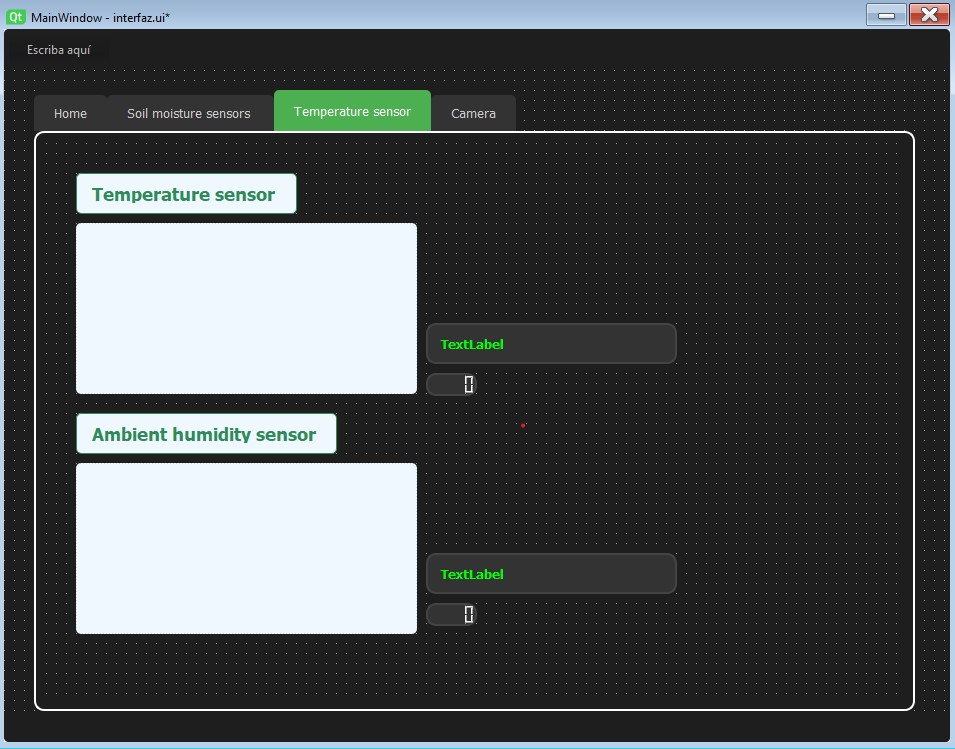
Temperature Sensor Tab
This tab provides data from the temperature and ambient humidity sensors:
- Included areas for displaying temperature sensor data and ambient humidity sensor data.
- Used
TextLabelandLCD Numberfor displaying the data. - Added toggle switches and labels for better organization.
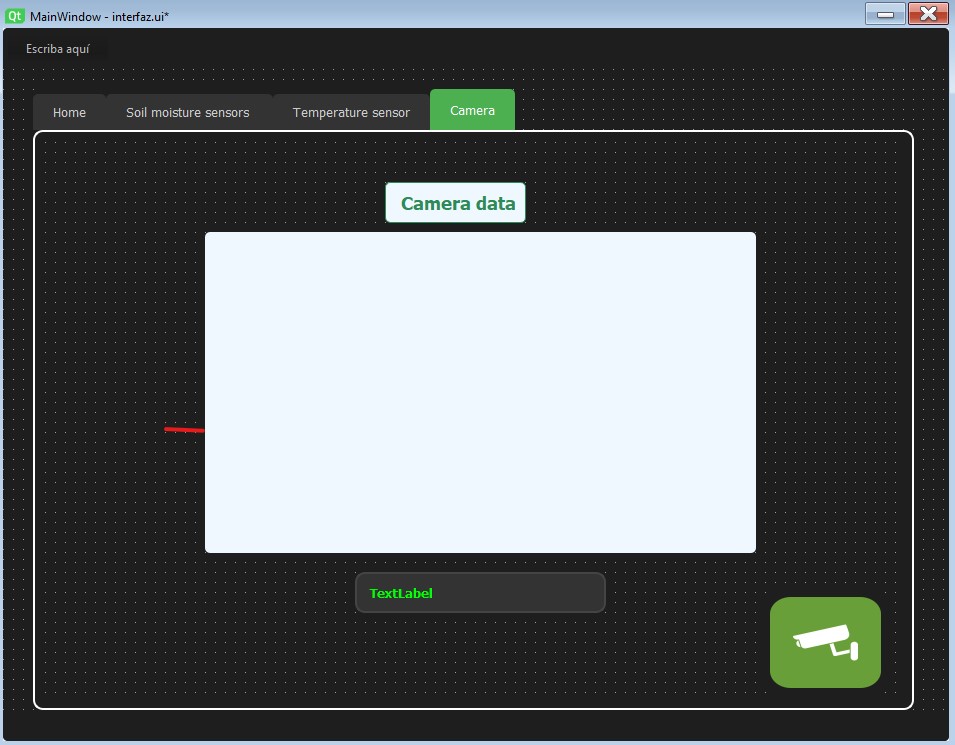
Camera Tab
The Camera tab integrates visual supervision into the interface:
- Configured a large area for displaying camera data.
- Added a
TextLabelto label this section. - Included a decorative image related to the camera for enhanced design.
Final Adjustments
Several adjustments were made to the background colors, borders, and texts for each component, ensuring a cohesive and professional aesthetic. The functionality and responsive layout of the interface were verified to ensure it displays well on different screen sizes.
Saving the Interface
After creating the interface in Qt Designer, the next step is to save it. The interface should be saved with a descriptive name to easily identify it later. In this case, we will name the interface file interfaz.ui. Follow these steps:
- Click on File in the Qt Designer menu.
- Select Save As.
- Choose a directory to save your file. It is recommended to create a dedicated folder for your project, for example,
SmartGardenProject. - Name the file
interfaz.uiand click Save.
Converting .ui to .py
To work with the interface in a Python script, you need to convert the .ui file to a .py file. This conversion is done using the pyuic5 tool, which is part of the PyQt5 package. Follow these steps:
- Open a terminal or command prompt.
- Navigate to the directory where your
interfaz.uifile is saved. For example:cd path/to/SmartGardenProject - Run the following command to convert the
.uifile to a.pyfile:pyuic5 -x interfaz.ui -o interfaz.py-xflag makes the generated Python file executable.-oflag specifies the output filename.
- After running the command, you will have a file named
interfaz.pyin your project directory.
Implementing the logic to the interface
To make my Python interface work with a XiaoESP32 board using the Arduino IDE, I need to establish effective communication between the program on the board and my Python application. This communication is carried out through the serial port.
First, I program the XiaoESP32 board with the Arduino IDE that I made in week 8 (you can check the page in the following link), uploading a sketch that manages tasks such as reading sensors or sending data to the serial port. I use commands like Serial.println() to send data from the board through my computer's USB port.
On the Python side, I use the PySerial library to handle communication with the serial port. Before I start, I install PySerial using pip, Python's package manager, with the command pip install pyserial. After installing it, in my Python script, I create an instance of serial.Serial() specifying the port and baud rate, which must match the settings in my Arduino sketch. This allows me to open the serial port to communicate with the board.
I use methods like serial.readline() to read the data sent by the XiaoESP32. I process these data as required by my application, for example, to update graphical interfaces, display real-time data, or store them for later analysis.
Here is my code in Arduino IDE:
    // Include necessary libraries and headers
    #include "esp_camera.h"
    #include "WiFi.h"
    #include "Arduino.h"
    #include "DHT.h"

    // Information about using PSRAM for high-resolution images
    // Define camera model for pin configuration
    #define CAMERA_MODEL_XIAO_ESP32S3 // Has PSRAM
    #include "camera_pins.h"

    // WiFi credentials
    const char *ssid = "**********";
    const char *password = "**********";

    // Configuration for soil moisture sensors
    const int sensorPins[4] = {D1, D2, D3, D9};
    const int sensorPowerPin = 23; // Pin to control power to the sensors

    // DHT sensor setup
    #define DHTPIN D8 // Data pin connected to DHT11
    #define DHTTYPE DHT11 // Specify the type of DHT sensor
    DHT dht(DHTPIN, DHTTYPE); // Initialize the DHT sensor

    int sensorValues[4];

    // Function declarations
    void startCameraServer();
    void setupLedFlash(int pin);

    // Main setup function
    void setup() {
        Serial.begin(115200);
        Serial.setDebugOutput(true);
        Serial.println();

        // Initialize pins for soil moisture sensors
        for (int i = 0; i < 4; i++) {
        pinMode(sensorPins[i], INPUT);
        }
        pinMode(sensorPowerPin, OUTPUT); // Control power to the sensors
        digitalWrite(sensorPowerPin, HIGH); // Turn on the sensors

        // Start the DHT sensor
        dht.begin();

        // Configure the camera settings
        camera_config_t config;
        config.ledc_channel = LEDC_CHANNEL_0;
        config.ledc_timer = LEDC_TIMER_0;
        config.pin_d0 = Y2_GPIO_NUM;
        // Additional pin configurations omitted for brevity

        // If PSRAM IC present, init with higher quality settings
        if (psramFound()) {
        config.jpeg_quality = 10;
        config.fb_count = 2;
        } else {
        // Limit frame size when no PSRAM
        config.frame_size = FRAMESIZE_SVGA;
        }

        // Initialize the camera
        esp_err_t err = esp_camera_init(&config);
        if (err != ESP_OK) {
        Serial.printf("Camera init failed with error 0x%x", err);
        return;
        }

        // Start the camera server
        startCameraServer();

        // Output the camera IP address
        Serial.print("Camera Ready! Use 'http://");
        Serial.print(WiFi.localIP());
        Serial.println("' to connect");
    }

    // Main loop function, updates sensor readings and camera view
    void loop() {
        // Update sensor readings
        for (int i = 0; i < 4; i++) {
        int rawValue = analogRead(sensorPins[i]);
        sensorValues[i] = map(rawValue, 0, 4095, 0, 100);
        }

        // Print sensor values
        Serial.print("Sensor1: ");
        Serial.print(sensorValues[0]);
        Serial.print(", Sensor2: ");
        Serial.print(sensorValues[1]);
        Serial.print(", Sensor3: ");
        Serial.print(sensorValues[2]);
        Serial.print(", Sensor4: ");
        Serial.print(sensorValues[3]);
        Serial.print(", Humidity: ");
        Serial.print(dht.readHumidity());
        Serial.print("%, Temperature: ");
        Serial.print(dht.readTemperature());
        Serial.println("C");

        // Delay between readings
        delay(2000); // Read every two seconds
    }
This code sets up a Xiao ESP32S3 camera and multiple soil moisture sensors along with a DHT11 sensor. It connects to a WiFi network and starts a camera server, allowing access to the camera stream via a URL. Additionally, the code reads soil moisture values from four sensors and air temperature and humidity readings from the DHT11 sensor, printing them to the serial monitor every two seconds. The camera configuration includes adjustments to enhance image quality and capture settings.
The following code is the python cod:
# Import necessary modules
import sys
import serial
import requests
from PyQt5 import QtWidgets, QtCore
from PyQt5.QtWidgets import QMainWindow, QVBoxLayout
from PyQt5.QtCore import QTimer, QThread, pyqtSignal
from PyQt5.QtGui import QImage, QPixmap
from matplotlib.figure import Figure
from matplotlib.backends.backend_qt5agg import FigureCanvasQTAgg as FigureCanvas
from interfaz import Ui_MainWindow

# Serial communication thread class
class SerialThread(QThread):
    data_received = pyqtSignal(str)

    def __init__(self, port, baudrate=115200, parent=None):
        super(SerialThread, self).__init__(parent)
        self.port = port
        self.baudrate = baudrate
        self.running = True

    def run(self):
        while self.running:
            try:
                ser = serial.Serial(self.port, self.baudrate)
                while self.running:
                    if ser.in_waiting:
                        data = ser.readline().decode('utf-8').strip()
                        self.data_received.emit(data)
            except serial.SerialException as e:
                print(f"Error opening serial port: {e}")
                self.sleep(5)  # Wait 5 seconds before retrying

    def stop(self):
        self.running = False
        self.wait()

# Matplotlib widget for displaying plots
class MatplotlibWidget(FigureCanvas):
    def __init__(self, parent=None):
        fig = Figure()
        self.axes = fig.add_subplot(111)
        fig.tight_layout(pad=2)  # Optimize layout of the plot
        super(MatplotlibWidget, self).__init__(fig)

# Thread for fetching camera images from ESP32
class ESP32CameraThread(QThread):
    image_update = pyqtSignal(QImage)

    def __init__(self, url, parent=None):
        super(ESP32CameraThread, self).__init__(parent)
        self.url = url
        self.running = True

    def run(self):
        while self.running:
            try:
                response = requests.get(self.url, stream=True)
                if response.status_code == 200:
                    bytes_data = b''
                    for chunk in response.iter_content(chunk_size=1024):
                        bytes_data += chunk
                        a = bytes_data.find(b'\xff\xd8')
                        b = bytes_data.find(b'\xff\xd9')
                        if a != -1 and b != -1:
                            jpg = bytes_data[a:b+2]
                            bytes_data = bytes_data[b+2:]
                            image = QImage()
                            image.loadFromData(jpg)
                            self.image_update.emit(image)
            except Exception as e:
                print(f"Error fetching image from ESP32: {e}")
                self.sleep(5)  # Wait 5 seconds before retrying

    def stop(self):
        self.running = False
        self.wait()

# Main application window setup
class MainWindow(QMainWindow, Ui_MainWindow):
    def __init__(self):
        super(MainWindow, self).__init__()
        self.setupUi(self)  # Set up the interface from the .ui file

        self.serial_thread = SerialThread('COM5')
        self.serial_thread.data_received.connect(self.update_sensors)
        self.serial_thread.start()

        self.data = {
            'Sensor1': [], 'Sensor2': [], 'Sensor3': [], 'Sensor4': [],
            'Humidity': [], 'Temperature': []
        }

        # Add Matplotlib widgets to the interface
        self.graph_widget1 = MatplotlibWidget(self)
        layout1 = QVBoxLayout(self.widget_pot1)
        layout1.addWidget(self.graph_widget1)

        self.graph_widget2 = MatplotlibWidget(self)
        layout2 = QVBoxLayout(self.widget_pot2)
        layout2.addWidget(self.graph_widget2)

        self.graph_widget3 = MatplotlibWidget(self)
        layout3 = QVBoxLayout(self.widget_pot3)
        layout3.addWidget(self.graph_widget3)

        self.graph_widget4 = MatplotlibWidget(self)
        layout4 = QVBoxLayout(self.widget_pot4)
        layout4.addWidget(self.graph_widget4)

        self.graph_humidity = MatplotlibWidget(self)
        layout_humidity = QVBoxLayout(self.widget_temp)
        layout_humidity.addWidget(self.graph_humidity)

        self.graph_temperature = MatplotlibWidget(self)
        layout_temperature = QVBoxLayout(self.widget_ambient)
        layout_temperature.addWidget(self.graph_temperature)

        self.timer = QTimer()
        self.timer.setInterval(1000)  # Update every second
        self.timer.timeout.connect(self.update_plots)
        self.timer.start()

        # Connect buttons to change tabs
        self.button1.clicked.connect(lambda: self.move_to_tab(1))
        self.button2.clicked.connect(lambda: self.move_to_tab(2))
        self.button3.clicked.connect(lambda: self.move_to_tab(3))

        # Initialize and connect the ESP32 camera
        self.camera_thread = ESP32CameraThread('http://172.20.10.5/')
        self.camera_thread.image_update.connect(self.update_camera_view)
        self.camera_thread.start()

    def update_sensors(self, data):
        try:
            parts = data.split(', ')
            for part in parts:
                key, value = part.split(': ')
                value = value.replace('%', '').replace('C', '')  # Remove percentage and Celsius symbols
                if len(self.data[key]) >= 20:
                    self.data[key].pop(0)
                self.data[key].append(float(value))

            # Update the LCDNumber in the Home tab
            self.lcdNumber1.display(self.data['Sensor1'][-1])
            self.lcdNumber2.display(self.data['Sensor2'][-1])
            self.lcdNumber3.display(self.data['Sensor3'][-1])
            self.lcdNumber4.display(self.data['Sensor4'][-1])
            self.lcdNumber5.display(self.data['Humidity'][-1])
            self.lcdNumber6.display(self.data['Temperature'][-1])

            # Update the LCDNumber in the Graphs tab
            self.lcdNumber_pot1.display(self.data['Sensor1'][-1])
            self.lcdNumber_pot2.display(self.data['Sensor2'][-1])
            self.lcdNumber_pot3.display(self.data['Sensor3'][-1])
            self.lcdNumber_pot4.display(self.data['Sensor4'][-1])
            self.lcdNumber_temp.display(self.data['Temperature'][-1])
            self.lcdNumber_ambient.display(self.data['Humidity'][-1])

            # Update the messages
            self.update_labels()

        except Exception as e:
            print(f"Error parsing data: {e}")

    def update_labels(self):
        sensor_labels = [self.label_pot1, self.label_pot2, self.label_pot3, self.label_pot4]
        sensors = ['Sensor1', 'Sensor2', 'Sensor3', 'Sensor4']

        for i, sensor in enumerate(sensors):
            if self.data[sensor]:
                if self.data[sensor][-1] < 50:
                    sensor_labels[i].setText("Please give me some water.")
                    sensor_labels[i].setStyleSheet("""
                        QLabel {
                            color: #FF0000; /* Red */
                            background-color: #333333; /* Dark gray */
                            border: 2px solid #FF0000; /* Red border */
                            border-radius: 10px; /* Rounded borders */
                            padding: 10px; /* Internal spacing */
                            font-size: 13px; /* Font size */
                            font-weight: bold; /* Bold font */
                        }
                    """)
                elif self.data[sensor][-1] > 70:
                    sensor_labels[i].setText("I am full, no more.")
                    sensor_labels[i].setStyleSheet("""
                        QLabel {
                            color: #FFFF00; /* Yellow */
                            background-color: #333333; /* Dark gray */
                            border: 2px solid #FFFF00; /* Yellow border */
                            border-radius: 10px; /* Rounded borders */
                            padding: 10px; /* Internal spacing */
                            font-size: 13px; /* Font size */
                            font-weight: bold; /* Bold font */
                        }
                    """)
                else:
                    sensor_labels[i].setText("I'm fine, don't worry.")
                    sensor_labels[i].setStyleSheet("""
                        QLabel {
                            color: #00FF00; /* Green */
                            background-color: #333333; /* Dark gray */
                            border: 2px solid #00FF00; /* Green border */
                            border-radius: 10px; /* Rounded borders */
                            padding: 10px; /* Internal spacing */
                            font-size: 13px; /* Font size */
                            font-weight: bold; /* Bold font */
                        }
                    """)

        # Messages for temperature
        if self.data['Temperature']:
            if self.data['Temperature'][-1] < 20:
                self.label_temp.setText("Brrr, it's cold! 🥶")
                self.label_temp.setStyleSheet("""
                    QLabel {
                        color: #0000FF; /* Blue */
                        background-color: #333333; /* Dark gray */
                        border: 2px solid #0000FF; /* Blue border */
                        border-radius: 10px; /* Rounded borders */
                        padding: 10px; /* Internal spacing */
                        font-size: 13px; /* Font size */
                        font-weight: bold; /* Bold font */
                    }
                """)
            elif self.data['Temperature'][-1] > 30:
                self.label_temp.setText("It's getting hot in here! 🌞")
                self.label_temp.setStyleSheet("""
                    QLabel {
                        color: #FF4500; /* Orange */
                        background-color: #333333; /* Dark gray */
                        border: 2px solid #FF4500; /* Orange border */
                        border-radius: 10px; /* Rounded borders */
                        padding: 10px; /* Internal spacing */
                        font-size: 13px; /* Font size */
                        font-weight: bold; /* Bold font */
                    }
                """)
            else:
                self.label_temp.setText("The temperature is perfect! 🌼")
                self.label_temp.setStyleSheet("""
                    QLabel {
                        color: #00FF00; /* Green */
                        background-color: #333333; /* Dark gray */
                        border: 2px solid #00FF00; /* Green border */
                        border-radius: 10px; /* Rounded borders */
                        padding: 10px; /* Internal spacing */
                        font-size: 13px; /* Font size */
                        font-weight: bold; /* Bold font */
                    }
                """)

        # Messages for ambient humidity
        if self.data['Humidity']:
            if self.data['Humidity'][-1] < 30:
                self.label_ambient.setText("It's so dry! 💧")
                self.label_ambient.setStyleSheet("""
                    QLabel {
                        color: #FFA500; /* Orange */
                        background-color: #333333; /* Dark gray */
                        border: 2px solid #FFA500; /* Orange border */
                        border-radius: 10px; /* Rounded borders */
                        padding: 10px; /* Internal spacing */
                        font-size: 13px; /* Font size */
                        font-weight: bold; /* Bold font */
                    }
                """)
            elif self.data['Humidity'][-1] > 70:
                self.label_ambient.setText("It's a bit too humid. 🌧️")
                self.label_ambient.setStyleSheet("""
                    QLabel {
                        color: #1E90FF; /* Blue */
                        background-color: #333333; /* Dark gray */
                        border: 2px solid #1E90FF; /* Blue border */
                        border-radius: 10px; /* Rounded borders */
                        padding: 10px; /* Internal spacing */
                        font-size: 13px; /* Font size */
                        font-weight: bold; /* Bold font */
                    }
                """)
            else:
                self.label_ambient.setText("Humidity is just right! 😊")
                self.label_ambient.setStyleSheet("""
                    QLabel {
                        color: #00FF00; /* Green */
                        background-color: #333333; /* Dark gray */
                        border: 2px solid #00FF00; /* Green border */
                        border-radius: 10px; /* Rounded borders */
                        padding: 10px; /* Internal spacing */
                        font-size: 13px; /* Font size */
                        font-weight: bold; /* Bold font */
                    }
                """)

        # Messages for the camera
        if self.check_for_anomaly():
            self.label_camera.setText("Anomaly detected! Help me!")
            self.label_camera.setStyleSheet("""
                QLabel {
                    color: #FF0000; /* Red */
                    background-color: #333333; /* Dark gray */
                    border: 2px solid #FF0000; /* Red border */
                    border-radius: 10px; /* Rounded borders */
                    padding: 10px; /* Internal spacing */
                    font-size: 13px; /* Font size */
                    font-weight: bold; /* Bold font */
                }
            """)
        else:
            self.label_camera.setText("All clear, I'm happy!")
            self.label_camera.setStyleSheet("""
                QLabel {
                    color: #00FF00; /* Green */
                    background-color: #333333; /* Dark gray */
                    border: 2px solid #00FF00; /* Green border */
                    border-radius: 10px; /* Rounded borders */
                    padding: 10px; /* Internal spacing */
                    font-size: 13px; /* Font size */
                    font-weight: bold; /* Bold font */
                }
            """)

    def update_plots(self):
        self.graph_widget1.axes.clear()
        self.graph_widget1.axes.plot(self.data['Sensor1'], 'r-')
        self.graph_widget1.axes.set_title("Sensor 1")
        self.graph_widget1.axes.set_xlabel("Tiempo")
        self.graph_widget1.axes.set_ylabel("Humedad (%)")
        self.graph_widget1.figure.tight_layout(pad=2)
        self.graph_widget1.draw()

        self.graph_widget2.axes.clear()
        self.graph_widget2.axes.plot(self.data['Sensor2'], 'g-')
        self.graph_widget2.axes.set_title("Sensor 2")
        self.graph_widget2.axes.set_xlabel("Tiempo")
        self.graph_widget2.axes.set_ylabel("Humedad (%)")
        self.graph_widget2.figure.tight_layout(pad=2)
        self.graph_widget2.draw()

        self.graph_widget3.axes.clear()
        self.graph_widget3.axes.plot(self.data['Sensor3'], 'b-')
        self.graph_widget3.axes.set_title("Sensor 3")
        self.graph_widget3.axes.set_xlabel("Tiempo")
        self.graph_widget3.axes.set_ylabel("Humedad (%)")
        self.graph_widget3.figure.tight_layout(pad=2)
        self.graph_widget3.draw()

        self.graph_widget4.axes.clear()
        self.graph_widget4.axes.plot(self.data['Sensor4'], 'm-')
        self.graph_widget4.axes.set_title("Sensor 4")
        self.graph_widget4.axes.set_xlabel("Tiempo")
        self.graph_widget4.axes.set_ylabel("Humedad (%)")
        self.graph_widget4.figure.tight_layout(pad=2)
        self.graph_widget4.draw()

        self.graph_humidity.axes.clear()
        self.graph_humidity.axes.plot(self.data['Humidity'], 'c-')
        self.graph_humidity.axes.set_title("Humidity")
        self.graph_humidity.axes.set_xlabel("Tiempo")
        self.graph_humidity.axes.set_ylabel("Humidity (%)")
        self.graph_humidity.figure.tight_layout(pad=2)
        self.graph_humidity.draw()

        self.graph_temperature.axes.clear()
        self.graph_temperature.axes.plot(self.data['Temperature'], 'y-')
        self.graph_temperature.axes.set_title("Temperature")
        self.graph_temperature.axes.set_xlabel("Tiempo")
        self.graph_temperature.axes.set_ylabel("Temperature (°C)")
        self.graph_temperature.figure.tight_layout(pad=2)
        self.graph_temperature.draw()

    def update_camera_view(self, image):
        self.camara.setPixmap(QPixmap.fromImage(image))

    def move_to_tab(self, index):
        self.tabWidget.setCurrentIndex(index)

    def closeEvent(self, event):
        self.serial_thread.stop()
        self.camera_thread.stop()
        event.accept()

# Start the Qt application
if __name__ == '__main__':
    app = QtWidgets.QApplication(sys.argv)
    main = MainWindow()
    main.show()
    sys.exit(app.exec_())
The provided code sets up a graphical user interface (GUI) using PyQt5 to display real-time data from sensors and cameras. It employs two threads: one for reading sensor data via a serial port and another for capturing images from an ESP32 camera through HTTP requests. Both images and sensor data are continuously updated on the GUI, with Matplotlib charts displaying trends of sensor data. Additionally, GUI events are handled for interactions such as tab switching or application closure, ensuring that all processes and resources are managed and released properly. This setup facilitates precise and real-time monitoring in applications that require constant supervision of environmental variables.
Result
I separated the videos to better see the results.
What problems did I encounter and how did I solve them?
Some problems I had was the connection of the 4 sensors, but that was a problem of the board, I had to reboot it to let me load the code correctly. Also, I had some problems in the communication between my board and the sensors data and how it was shown in my interface, to make sure I had to show random values from python and then I solved that problem. The serial monitor was a great help for these problems, as here I could see if my sensors were working correctly.