15. Interface and Application Programming
Group assignment
- compare as many tool options as possible
Documentation at: Fablab Taipei
Individual assignment
- write an application that interfaces a user with an input &/or output device that you made
This week Professor Neil covered so many stuff in lecture. I’m interesting in AR/VR, wondering to try Javascript, and also Processing seems like a good choice. But I decided to start from basic, Python is the language I have a bit basic and also recommended.
Live plotting with Pyserial
My goal is to create a live plotting diagram sensing some input device. At first I tried to modify Professor Neil’s python code (.py file) in Input Devices week, but later gave up since it’s hard for me to understand the code. (To understand .py file, you still need to know what data comes out from .c file)
So later I turned into using one of the simplest input device “Potentiometer”, and using my Attiny45 board to measure it. Here are steps to achieve my goal.
- Connect potentiometer with board ,and read data in serial (Arduino code)
- Convert serial data to pyserial (Python code)
Here’s my work!
Connect potentiometer with board (Arduino code)
To be honest, this should be simple. I just found a website Use Arduino read data from potentiometer(CH) and make sure the potentiometer works fine.
Next I connect potentiometer to my board, and refer to previous project I know Attiny45 requires librariy to use serial communication. Below is a example to start serial communication.
#include <SoftwareSerial.h>

#define tx 1
#define rx 2

SoftwareSerial mySerial(rx, tx);

void setup()
{
  mySerial.begin(9600);   // 9600 bauds
}
Note: here I define rx to use pin”1”, but actually it refers to “Arduino Pin1” or “PB1”. Vice versa. (In this case we only need one wiring) See Attiny45 pinout for more.
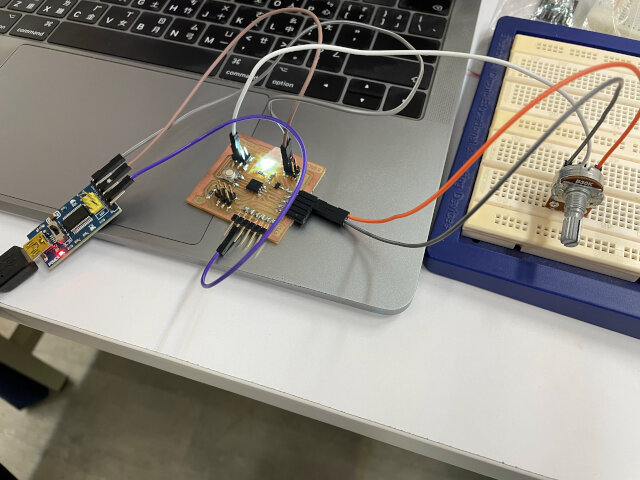
Also make sure you have your tx pin on board (PB1) connect to rx of the USB-FTDI converter board. Which means board transmit(tx) to USB receive(rx).
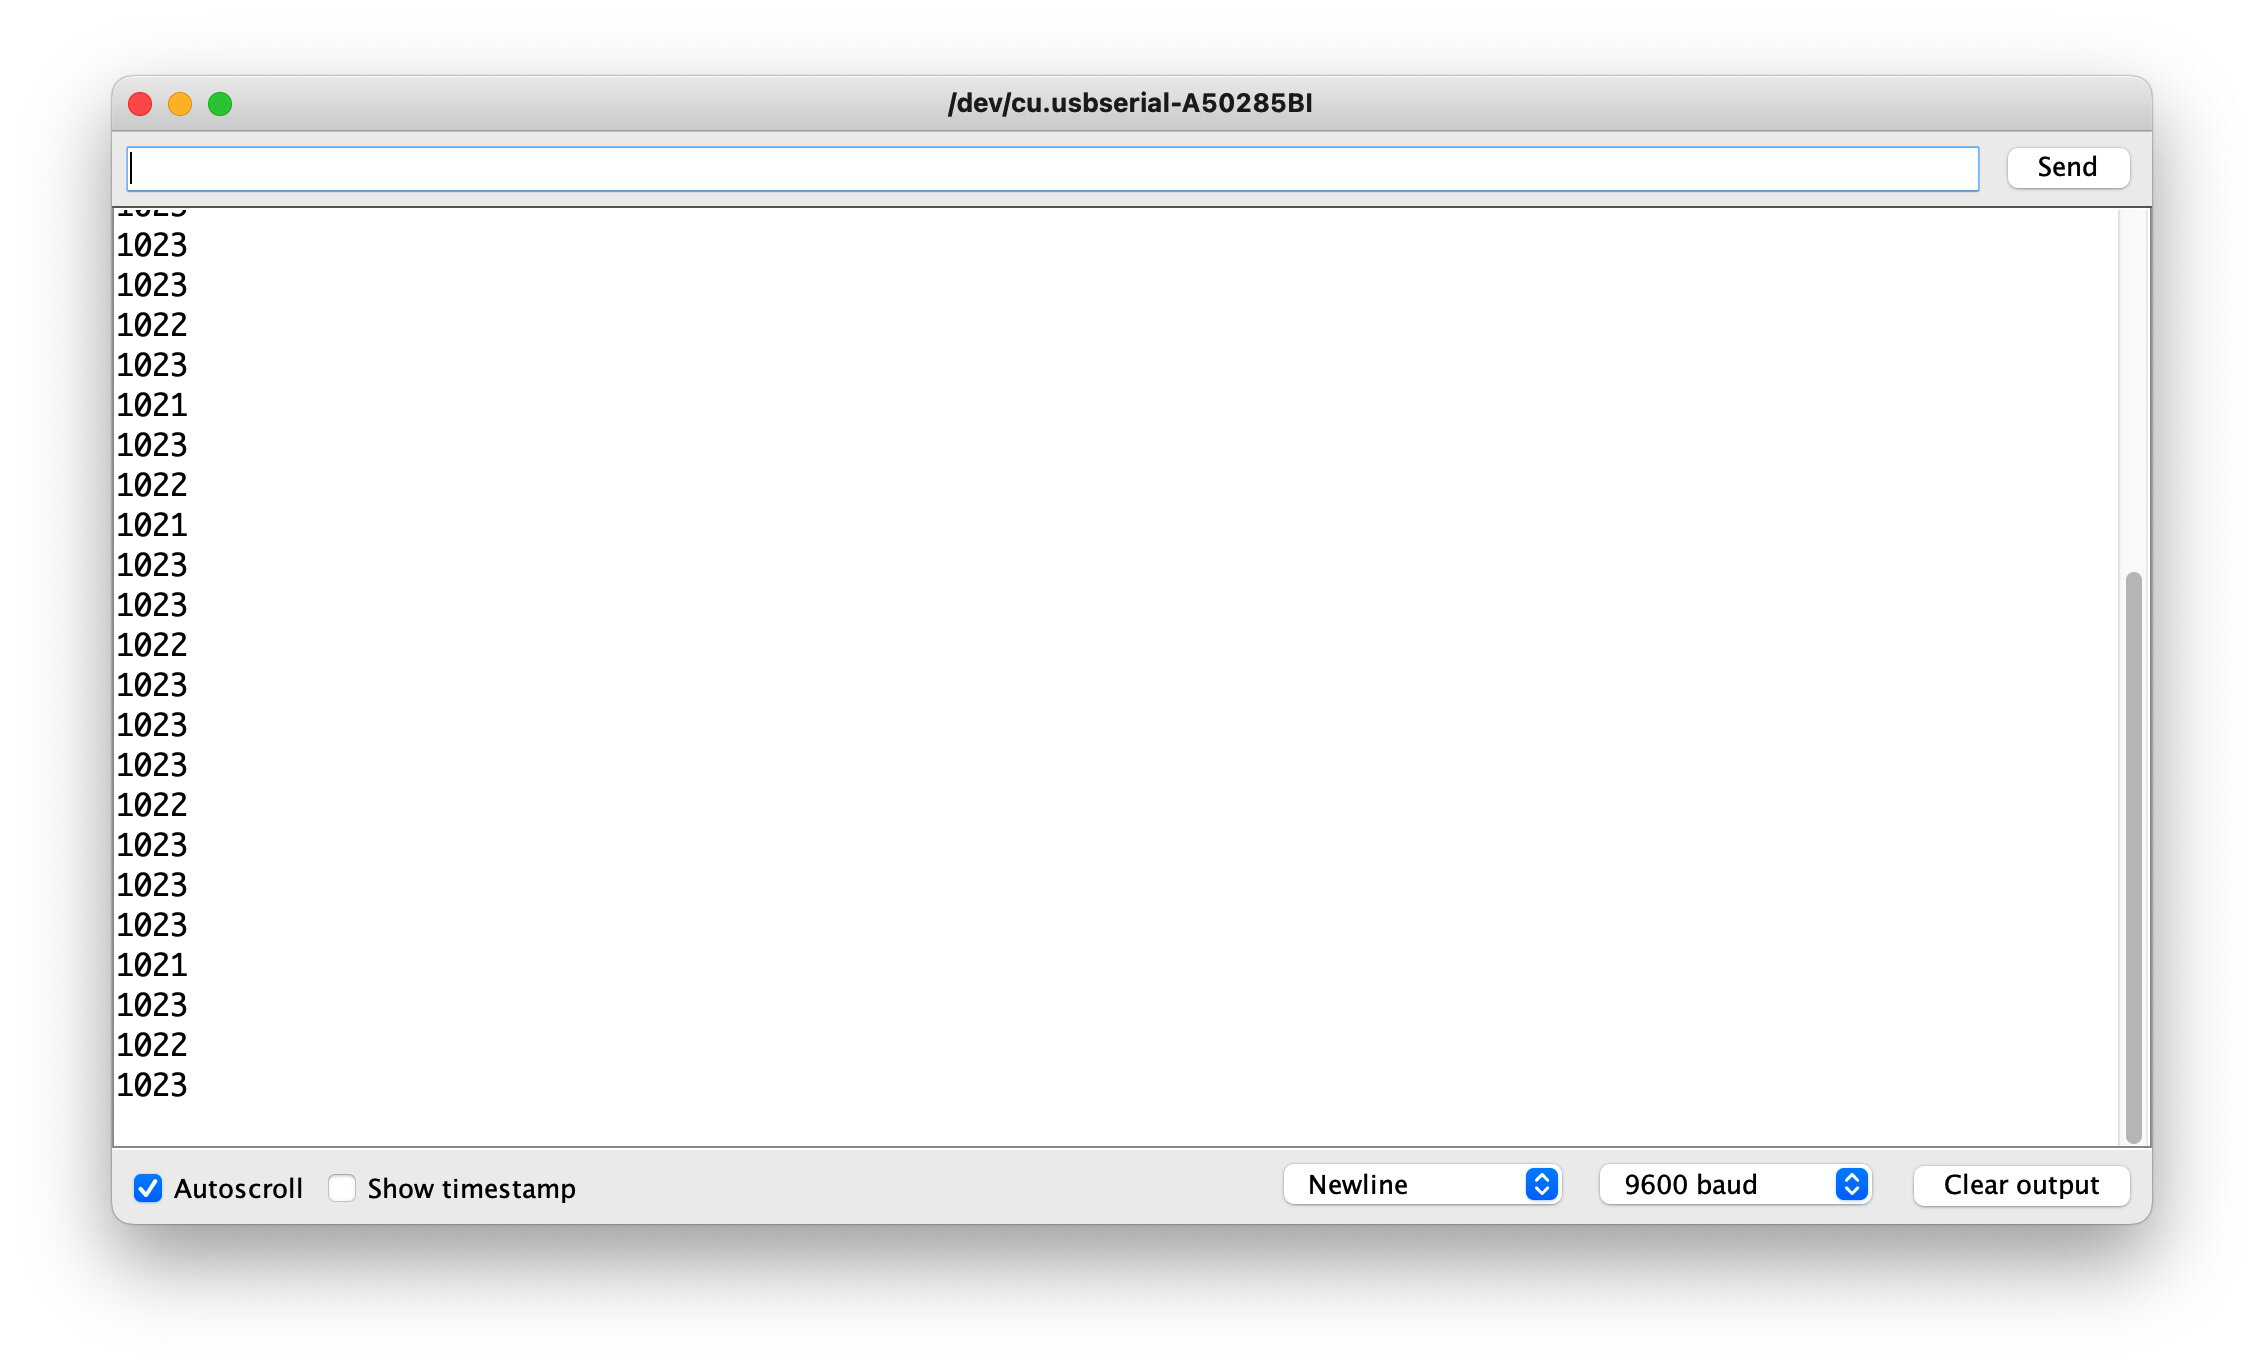
Next even I have numbers show on serial, somehow it’s always 1023 and not changing. Or even data on serial not showing clearly (diappear sometimes, or not appear in a new line but comes together).
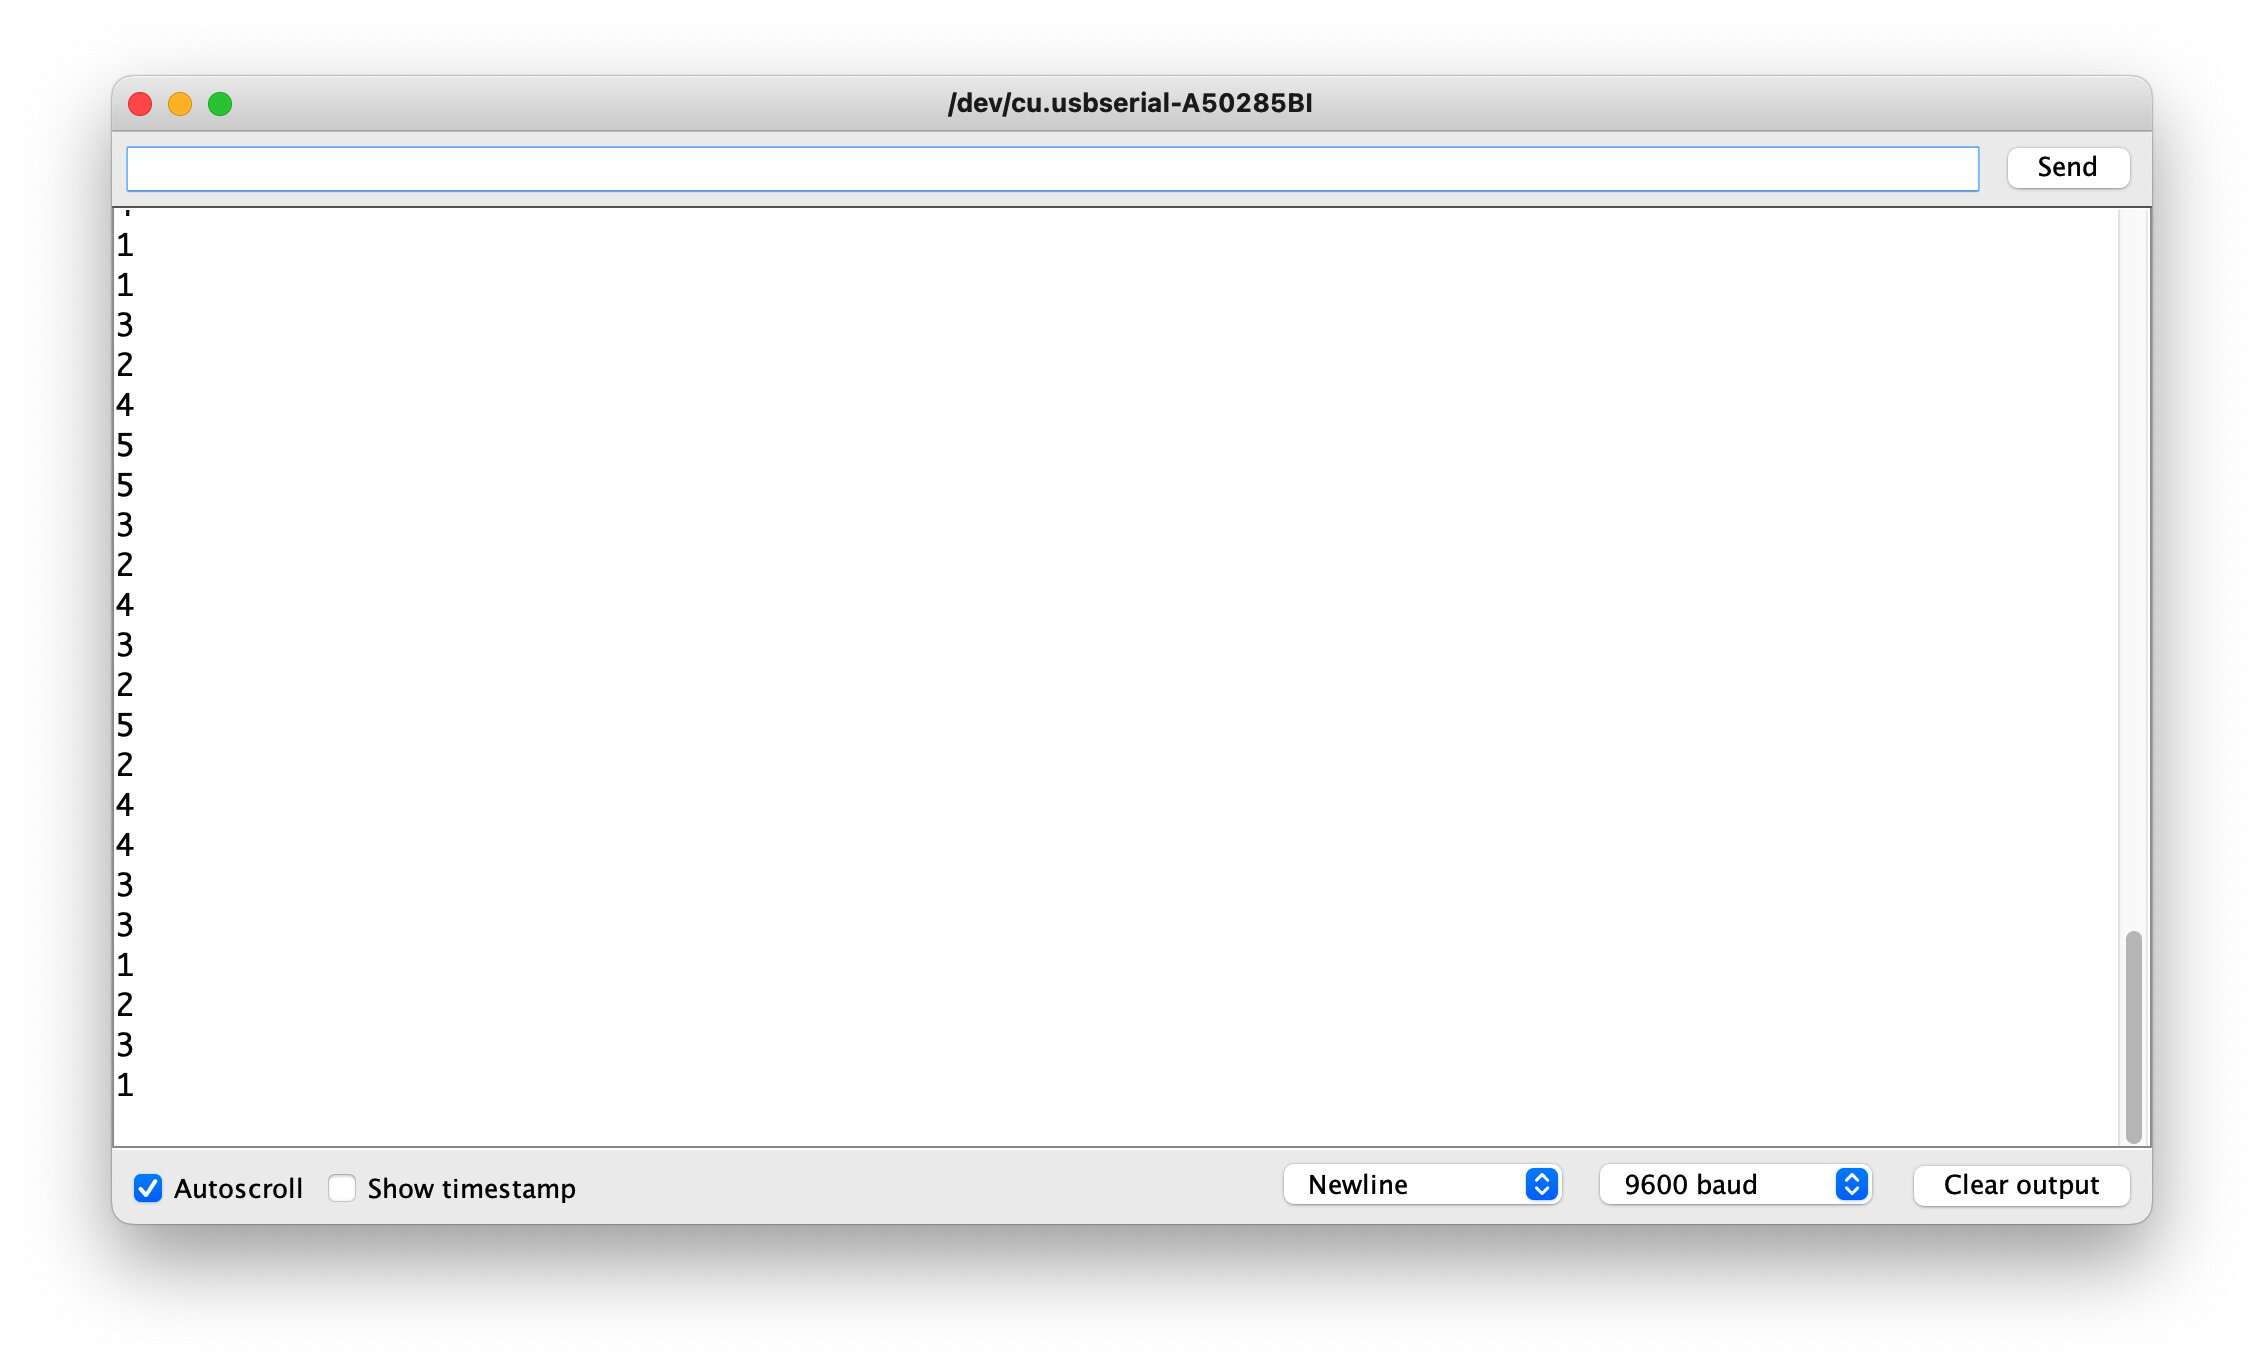
Later with some tests, I change “PB0” to “PB4” and finally go to “PB3” and numbers works fine!
void loop() {

  value = analogRead(PB3);
  mySerial.println(value);
  delay(500);

}
The reason suppose to be this pin also used as ISP networking port, and even cause some weird error when programming… (but after switching to another board then comes back, I can program it again.)
Convert serial data to pyserial (Python code)
I first found this Using pySerial to Read Serial Data Output from Arduino looks promising, and code really works. (just need to replace “/dev/ttyACM0” to yours. Using ls /Dev/tty.* in terminal to fnd).
import serial
ser = serial.Serial('/dev/ttyACM0')
ser.flushInput()

while True:
    try:
        ser_bytes = ser.readline()
        decoded_bytes = float(ser_bytes[0:len(ser_bytes)-2].decode("utf-8"))
        print(decoded_bytes)
    except:
        print("Keyboard Interrupt")
        break
I can get serial data on my terminal now! (run python3 your_code_file in terminal) Althought has now way to quit loop unless disconnect board ot close terminal.
Optional: wrire data to CSV
But the next step write csv file the code doesn’t work. And I found another website through video Arduino Data Logger (CSV) with Sensors and Python with more detail and useful tutorial.
In “step.4 Create an Arduino Data Logger: Send Serial Data into a CSV File” I found the code I need to write data in CSV file automatically.
samples = 30 #how many samples to collect
line = 0 #start at 0 because our header is 0 (not real data)
while line <= samples:
    getData=str(ser.readline())
    data=getData[0:][:-2]
    print(data)

    file = open(fileName, "a")
    file.write(data + "\\n") #write data with a newline
    line = line+1

print("Data collection complete!")
file.close()
It works that I found CSV file and some data inside, but it’s not pure numbers. I went back to pevious website and found this line decoded_bytes = float(ser_bytes[0:len(ser_bytes)-2].decode("utf-8")) which implys data need to be “decode”, so I modify code above and happily see it works!
file = open(fileName, "a")the “a” refers to the append mode; while “w” refers to write mode. reference
# Loops after modify
while line <= samples:
    getData=ser.readline()
    data = str(int(getData[0:len(getData)-2].decode("utf-8")))
    print(data)

    file = open(fileName, "a")
    file.write(data + ",")
    line = line+1
Final step to finish code
Finally I could use live plotting code below.
# Add in start of code
import time
import csv
import matplotlib
matplotlib.use("tkAgg")
import matplotlib.pyplot as plt
import numpy as np

plot_window = 20
y_var = np.array(np.zeros([plot_window]))

plt.ion()
fig, ax = plt.subplots()
line1, = ax.plot(y_var)
Just be aware you need to convert “data” back to int.
# Add these in while loop
y_var = np.append(y_var, int(data))
y_var = y_var[1:plot_window+1]
line1.set_ydata(y_var)
ax.relim()
ax.autoscale_view()
fig.canvas.draw()
fig.canvas.flush_events()
Version 2: add time, titles and label
Code Example
import serial
import matplotlib
matplotlib.use("tkAgg")
import matplotlib.pyplot as plt
import numpy as np

my_port = "/Dev/tty.usbserial-A50285BI" #serial port
baud = 9600 #9600 baud

ser = serial.Serial(my_port, baud)
print("Connected to My port:" + my_port)

plot_window = 20
y_var = np.array(np.zeros([plot_window]))
x_var = np.array(np.zeros([plot_window]))

plt.ion()
fig, ax = plt.subplots()

mngr = plt.get_current_fig_manager() # set FigureManagerBase
mngr.set_window_title('Live Plotting') # use "FigureManagerBase" to set window title
ax.set_title('Potentiometer Test') # figure title
ax.set_xlabel('Time') # X title
ax.set_ylabel('Value') # Y title
line1, = ax.plot(y_var, x_var)

samples = 20 #how many samples to collect
line = 0 #start at 0 because our header is 0 (not real data)

while line <= samples:
    getData=ser.readline()
    data = str(int(getData[0:len(getData)-2].decode("utf-8")))
    print(data)

    y_var = np.append(y_var, int(data))
    y_var = y_var[1:plot_window+1]
    line1.set_ydata(y_var)
    x_var = np.append(x_var, int(line))
    x_var = x_var[1:plot_window+1]
    line1.set_xdata(x_var)

    ax.relim()
    ax.autoscale_view()
    fig.canvas.draw()
    fig.canvas.flush_events()

    line = line+1

print("Data collection complete!")