Week 15 - Interface and Application Programming
Group Assignment
- compare as many tool options as possible
This week, we tried differet visulisation tools with Analog input.
- Arduino Serial plotter
- Processing
- Python (matplotlib)
Refer to an example “Create a Graph with Processing” from Fab tutorial, we tried different ways to visulize analog input from potentiometer with Arduino Uno.
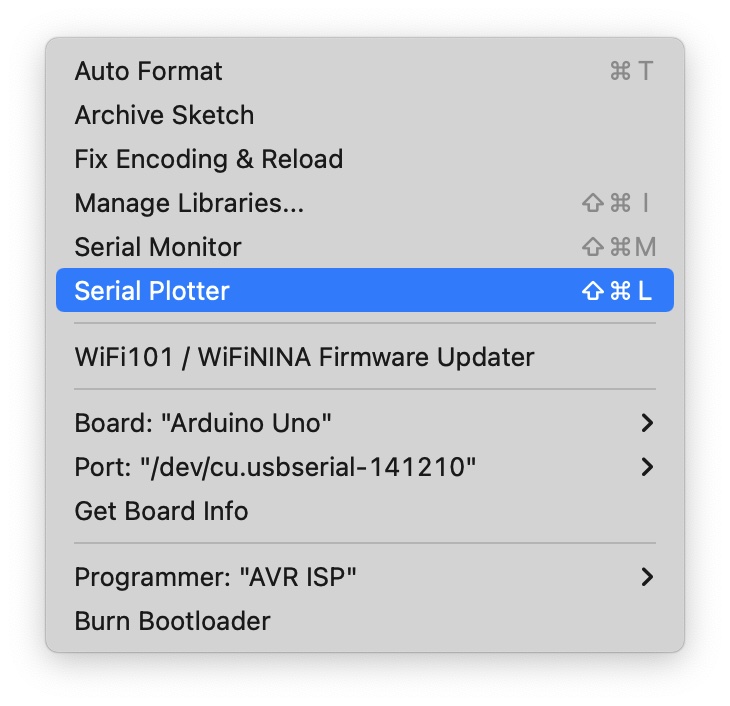
Arduino Serial plotter
This is a build-in funtion in Arduino IDE, and probably the simplest way to visualize sensor input. We usually use Serial Monitor to see values come in, but the one next to (Tools > Serial Plotter) it make these values into simple graph.
void setup() {
  // initialize the serial communication:
  Serial.begin(9600);
}

void loop() {
  // send the value of analog input 0:
  Serial.println(analogRead(A0));
  // wait a bit for the analog-to-digital converter to stabilize after the last
  // reading:
  delay(2);
}
Processing
This is another development platform similar to Arduino, and as Neil said “if you love Arduino, you will love processing too”, I can see lots of commons between them. And the advantage is that it support lots of visualisation effect.
First I downloaded Processing software, be aware that there are 2 versions of MacOS and 2 versions of Linux. And since it requires Java environment to run, you may also need to download Java.
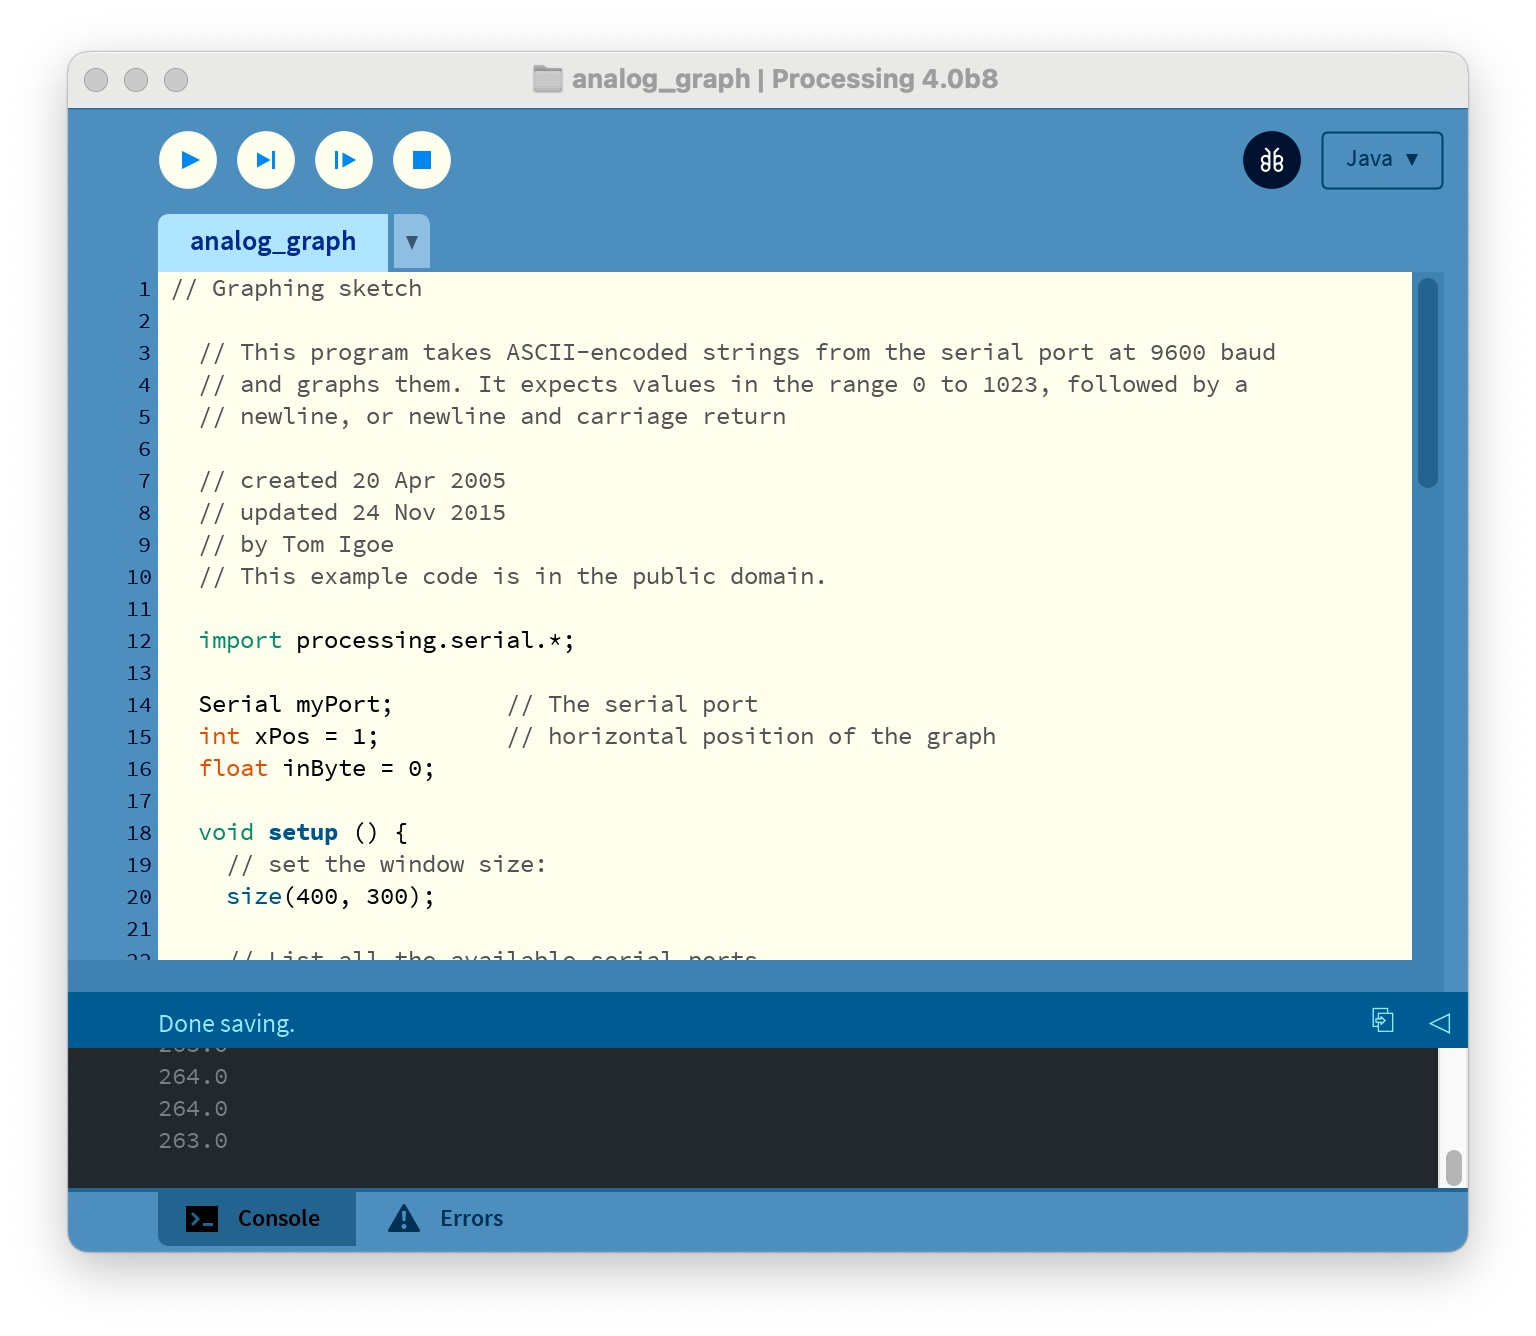
Next, when I copy paste sample code to Processing, I wonder how to set port I want to receive data. Well it turns out you don’t need to set port here, but instead need to modify some parts in the code.
println(Serial.list()); # error
println((Object[])Serial.list()); # right
myPort = new Serial(this, Serial.list()[0], 9600); # the number [0] may be wrong, see message print out
myPort = new Serial(this, Serial.list()[2], 9600); # works for me

For example, my serial port is the third one print out, so I need to set it to [2] (start from 0,1,2…).
Finally can see the graph shows!
Python (Matplotlib)
Python is the most welcome programming language nowaday and it also support visualization function. With matplotlib we also create simple graph from potentiometer analog input.
Detail documentation see: Hanson’s site