7b. Group Assignment
For the group assignment, we used the requirements from Nueval as a guideline:
Group Assignment Progress
-
Use the test equipment in your lab to observe the operation of a microcontroller circuit board
Minimum:
- Check operating voltage on the board with multimeter
- Use oscilloscope to check noise of operating voltage
- Use oscilloscope to interpret a data signal
Checking Operating Voltage Using a Multimeter
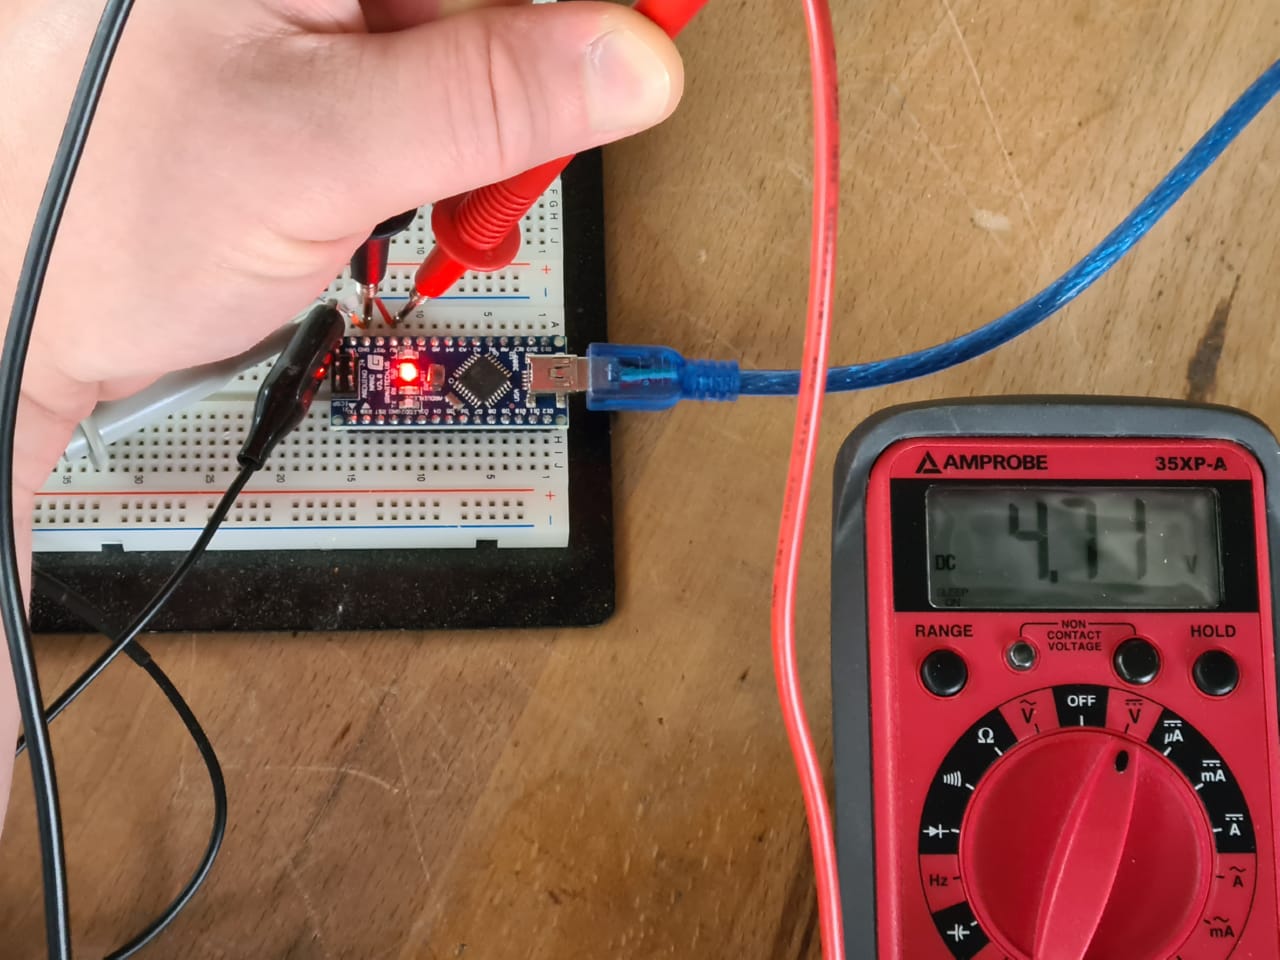
For this first test, we connected an Arduino Nano on a breadboard to a Laptop, which was not plugged into the wall and merely running on battery power. Using a multimeter, we measured the voltage between the GND and 5V pins. The 5V pin on the Nano carries the USB supply voltage (which was supposed to be 5V). In our case, it measured a little lower at just 4.71 V:
Group Assignment Progress
-
Use the test equipment in your lab to observe the operation of a microcontroller circuit board
Minimum:
- Check operating voltage on the board with multimeter
- Use oscilloscope to check noise of operating voltage
- Use oscilloscope to interpret a data signal
Using an oscilloscope to check noise of operating voltage.
We then connected the GND and 5V pins to an Agilent Technologies DSO1052B Digital Storage Oscilloscope using 10:1 passive probes:
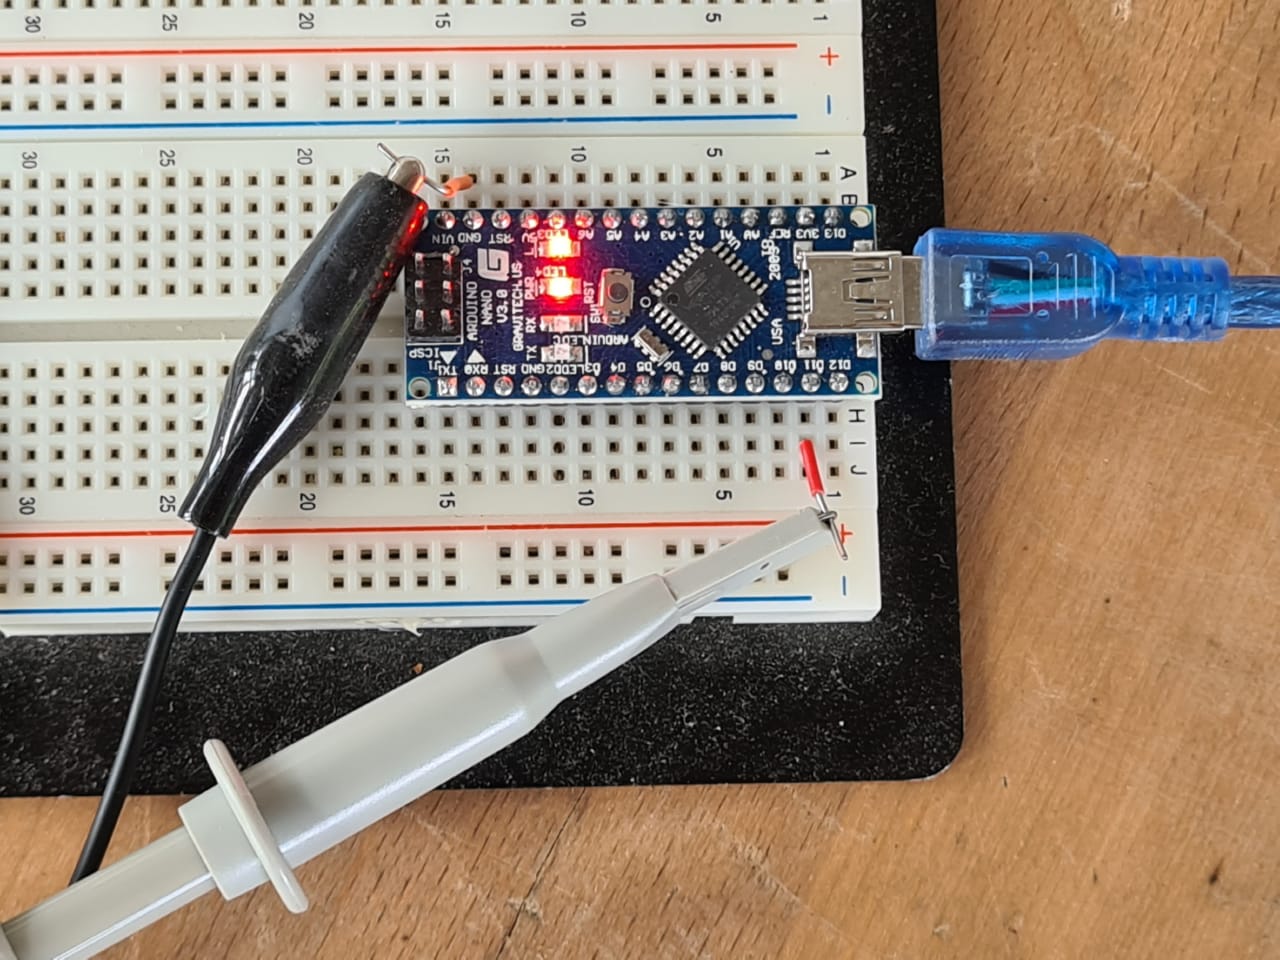
The probe connected to GND was set up as as ground coupled probe in the DSO, the other one was set up as a DC coupled probe. Using this setup, we measured the operating voltage to be even a little lower, at 4.53 V:
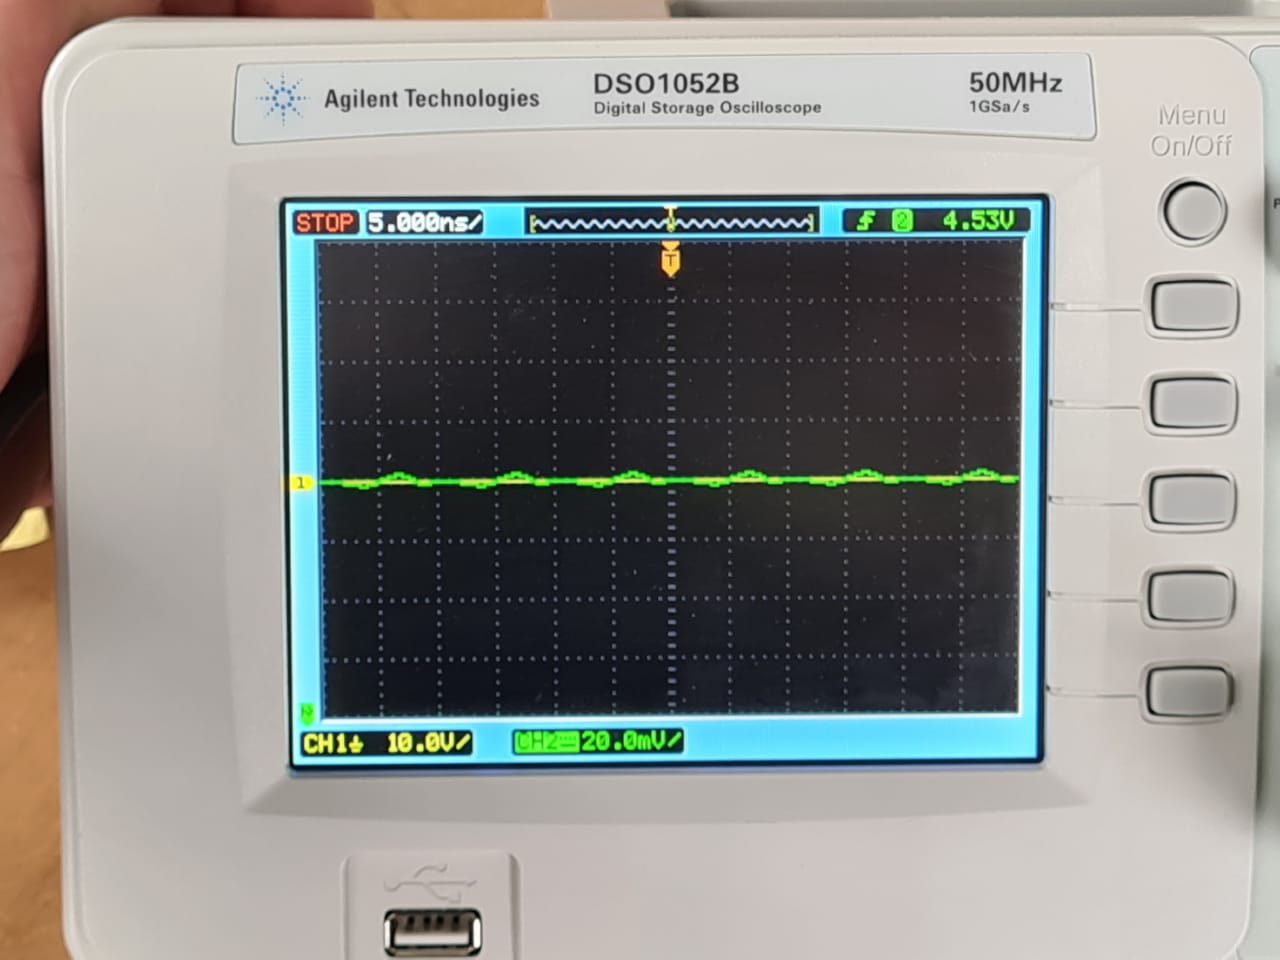
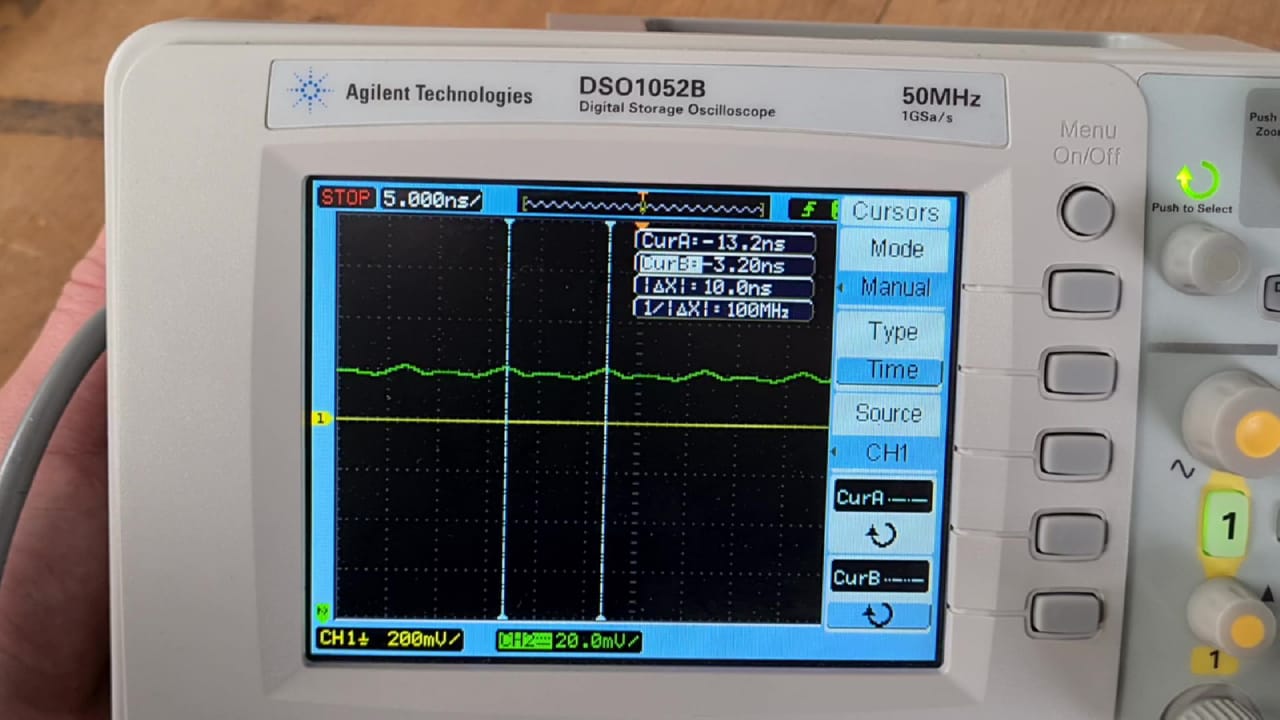
Using the cursors in the DSO, we measured the operating voltage ripple to be about 40 mV in amplitude…
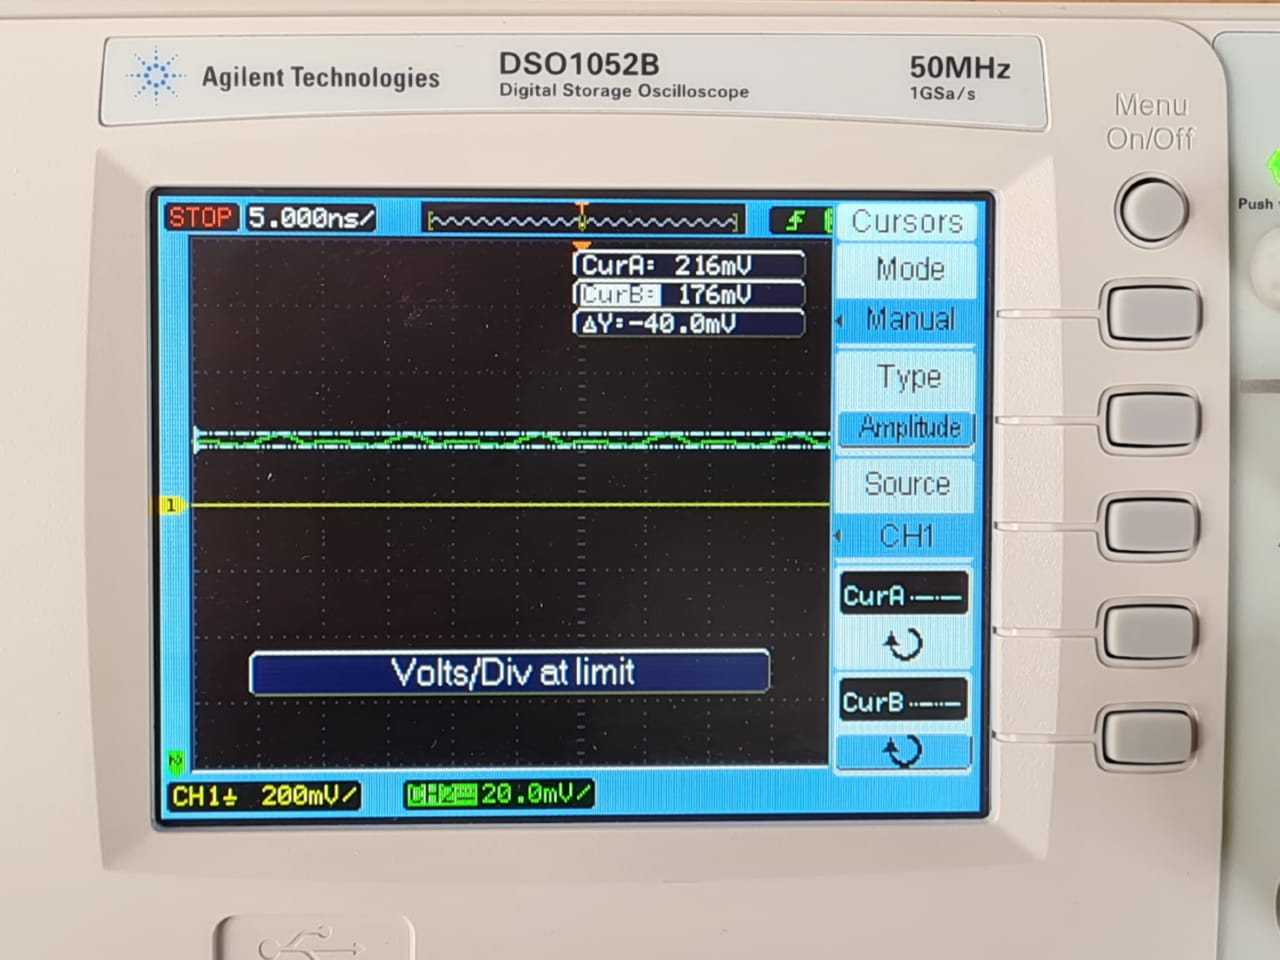
and occurring at a (interestingly high) frequency of 100 MHz (which is far beyond the CPU frequency on the Arduino Nano):
Group Assignment Progress
-
Use the test equipment in your lab to observe the operation of a microcontroller circuit board
Minimum:
- Check operating voltage on the board with multimeter
- Use oscilloscope to check noise of operating voltage
- Use oscilloscope to interpret a data signal
Using an Oscilloscope to interpret a data signal
We then programmed the Arduino Nano to output a PWM signal on one of its PWM-capable (not all of them are!) output pins, pin 11, using a very simple sketch:
#define PWMPIN 11

void setup() {
  pinMode(PWMPIN, OUTPUT);
}

void loop() {
  analogWrite(PWMPIN, map(25, 0, 100, 0, 255));
}
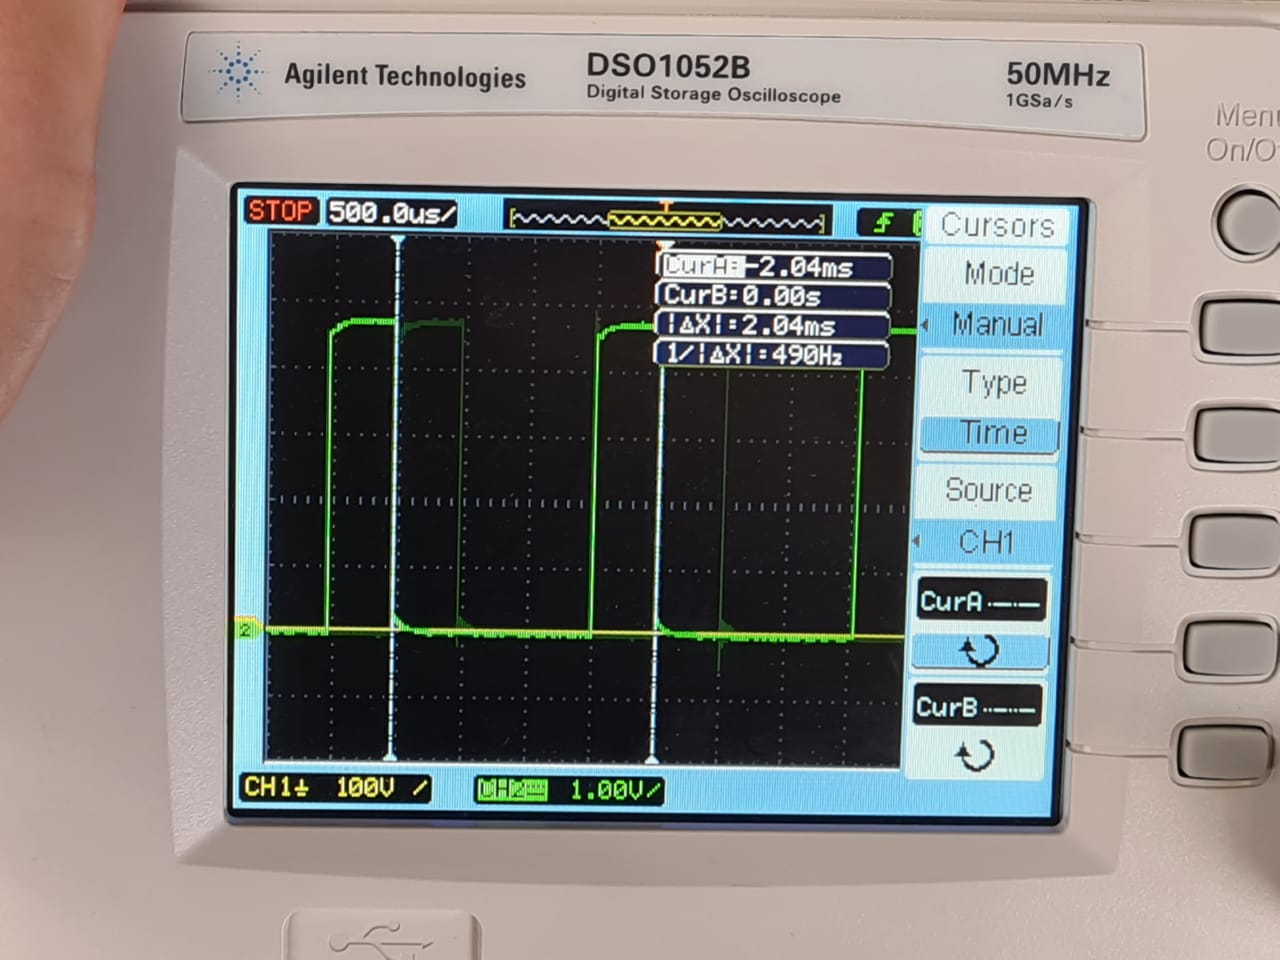
The map function takes a value and maps it from one value range to another one - in our example case it would map 25 from a range of 0 - 100 (percentual range) to the corresponding value in a range of 0 - 255 (analog output range). After connecting the DC coupled probe to pin 11 on the Arduino Nano, here is what the PWM signal looked like (at 25%, 50% and 75% output, respectively):
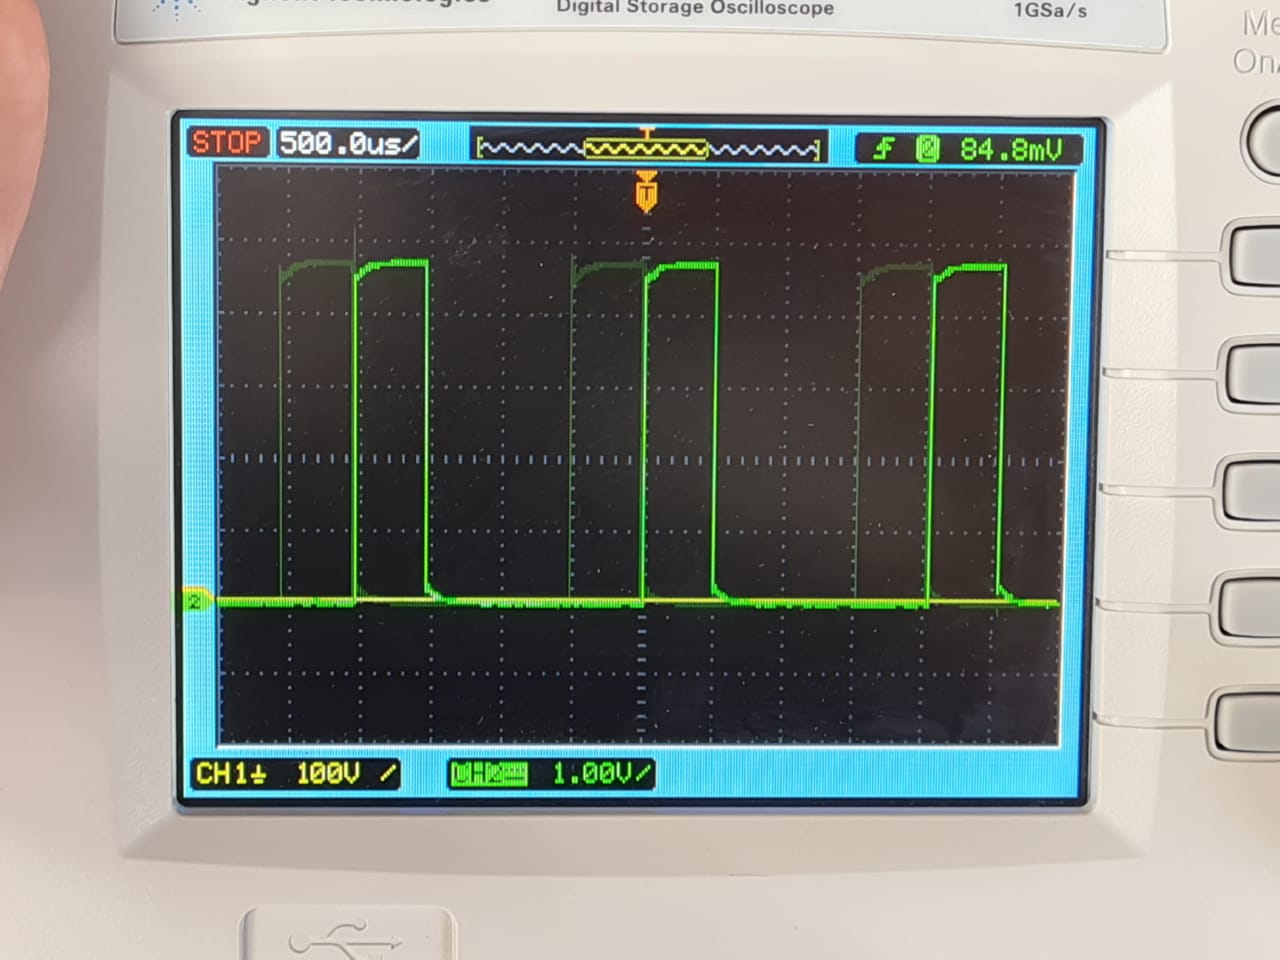
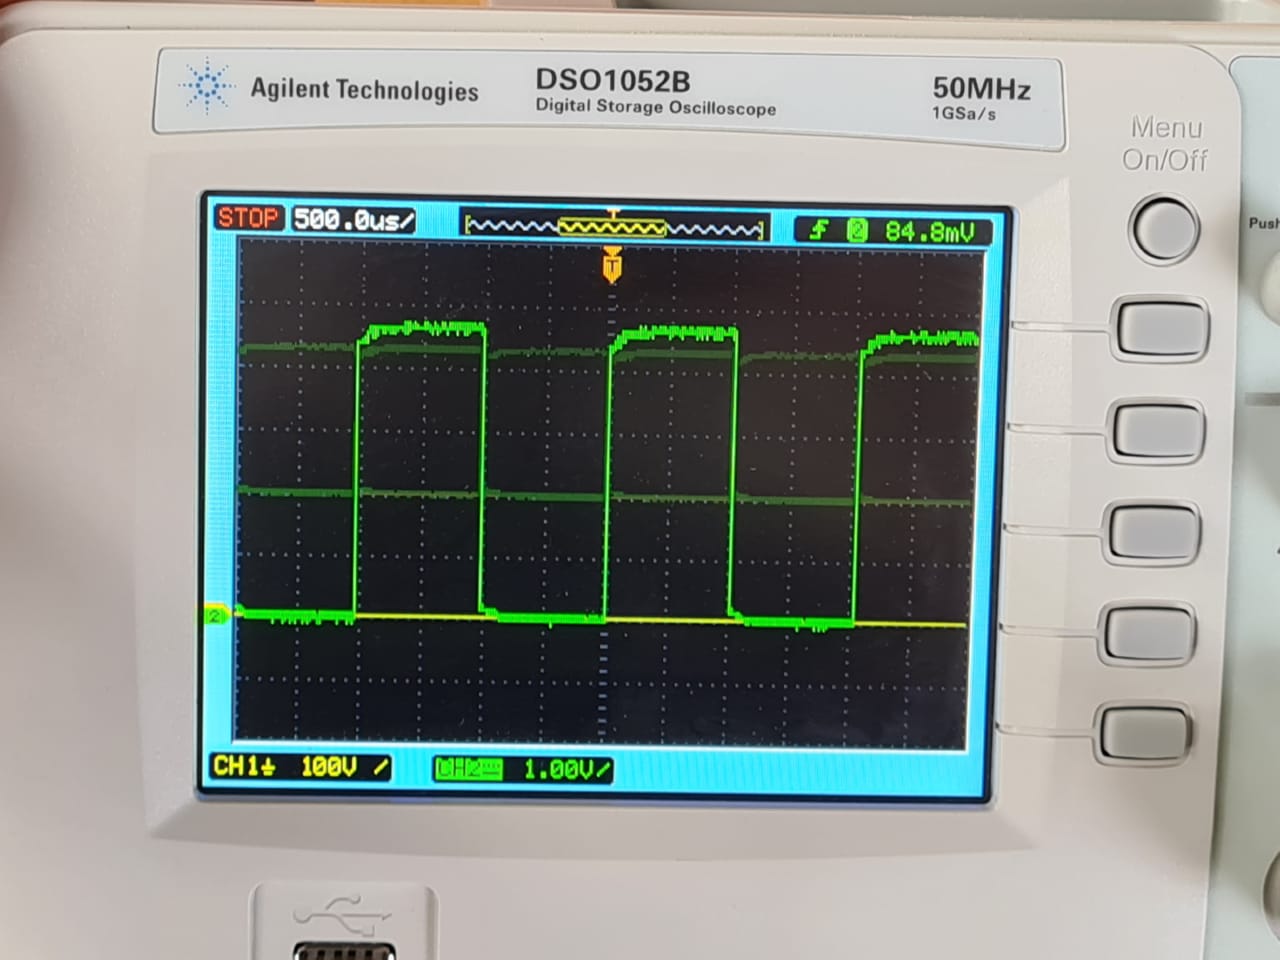
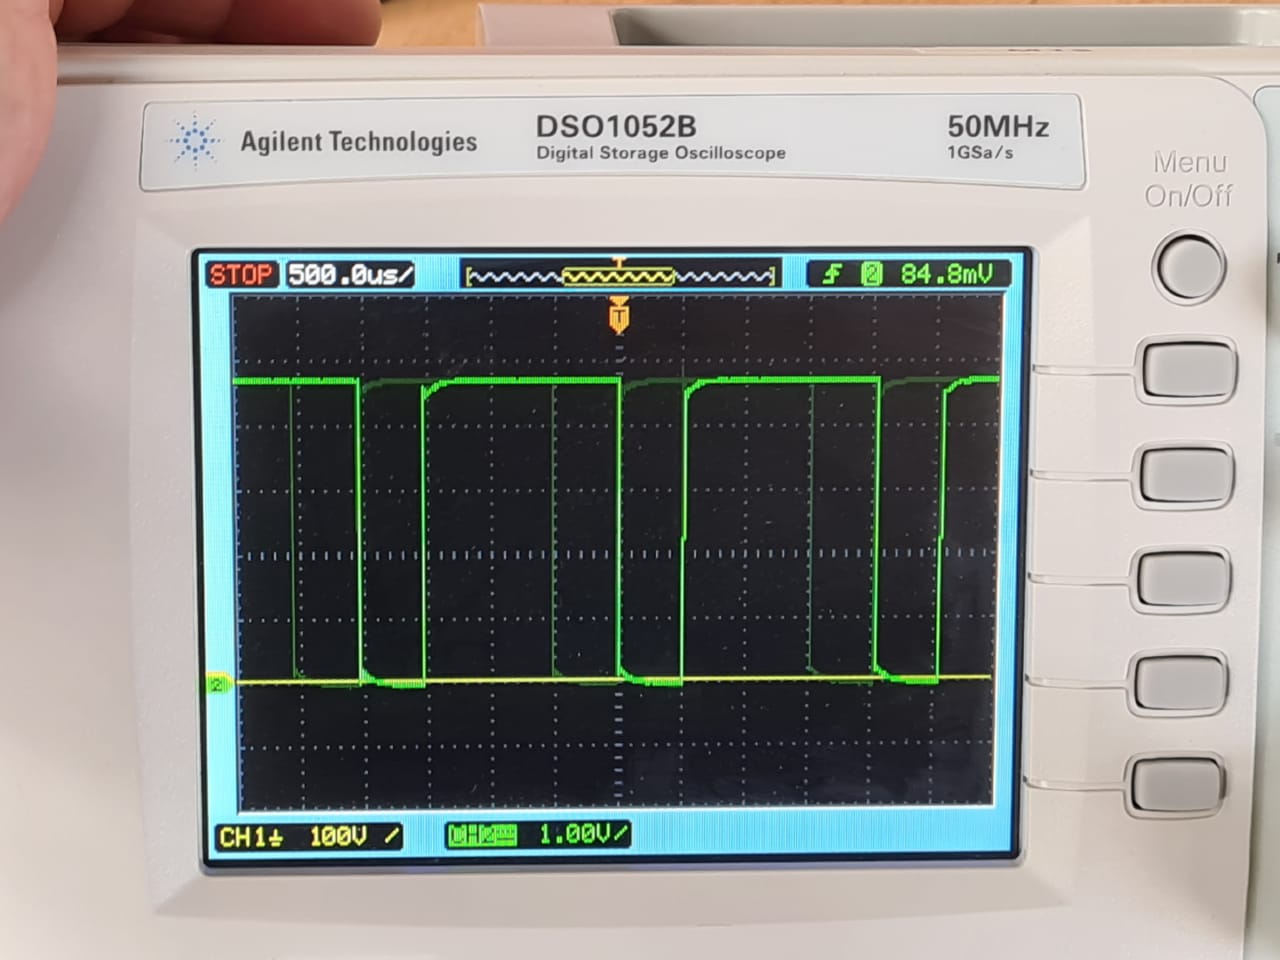
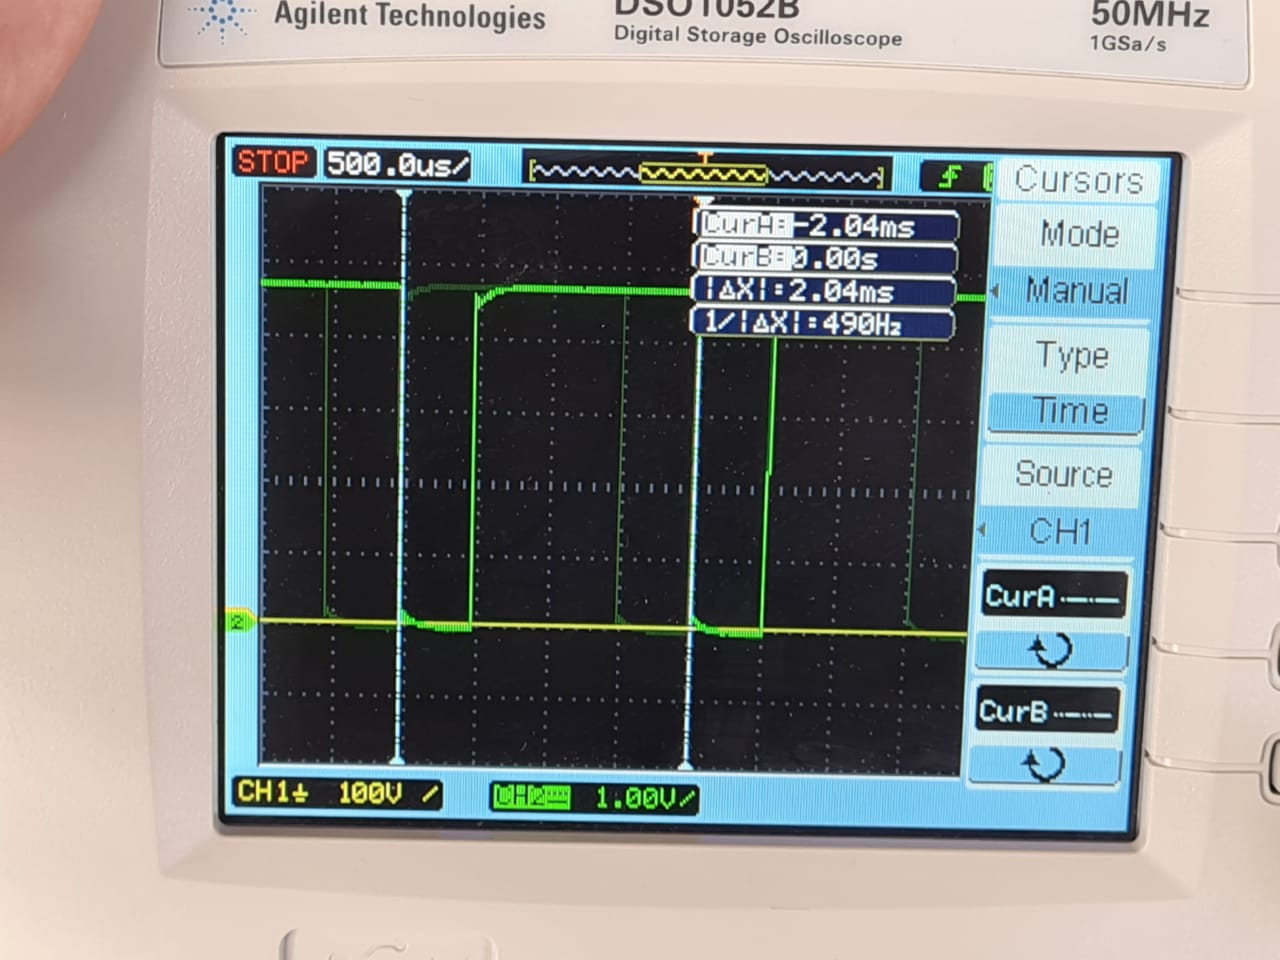
As can be noticed, the higher the output value chosen, the more ON time there is in the signal (longer high voltage plateaus). At 50% output strength, ON and OFF time of the signal are exactly in balance. This is exactly how a PWM signal works. Since a digital pin can only be on or off (i.e. 5V or GND), analog voltages in between maximum voltage and ground cannot directly be output. Instead, they are approximated by switching the signal on and off very quickly, shifting the signal towards longer ON times for higher voltages and longer OFF times for lower voltages. The frequency of the underlying signal stays constant. We measured the total cycle to be 2.04 ms long, ending up at a frequency of 490 Hz (we measured at both 25% and 75% output):
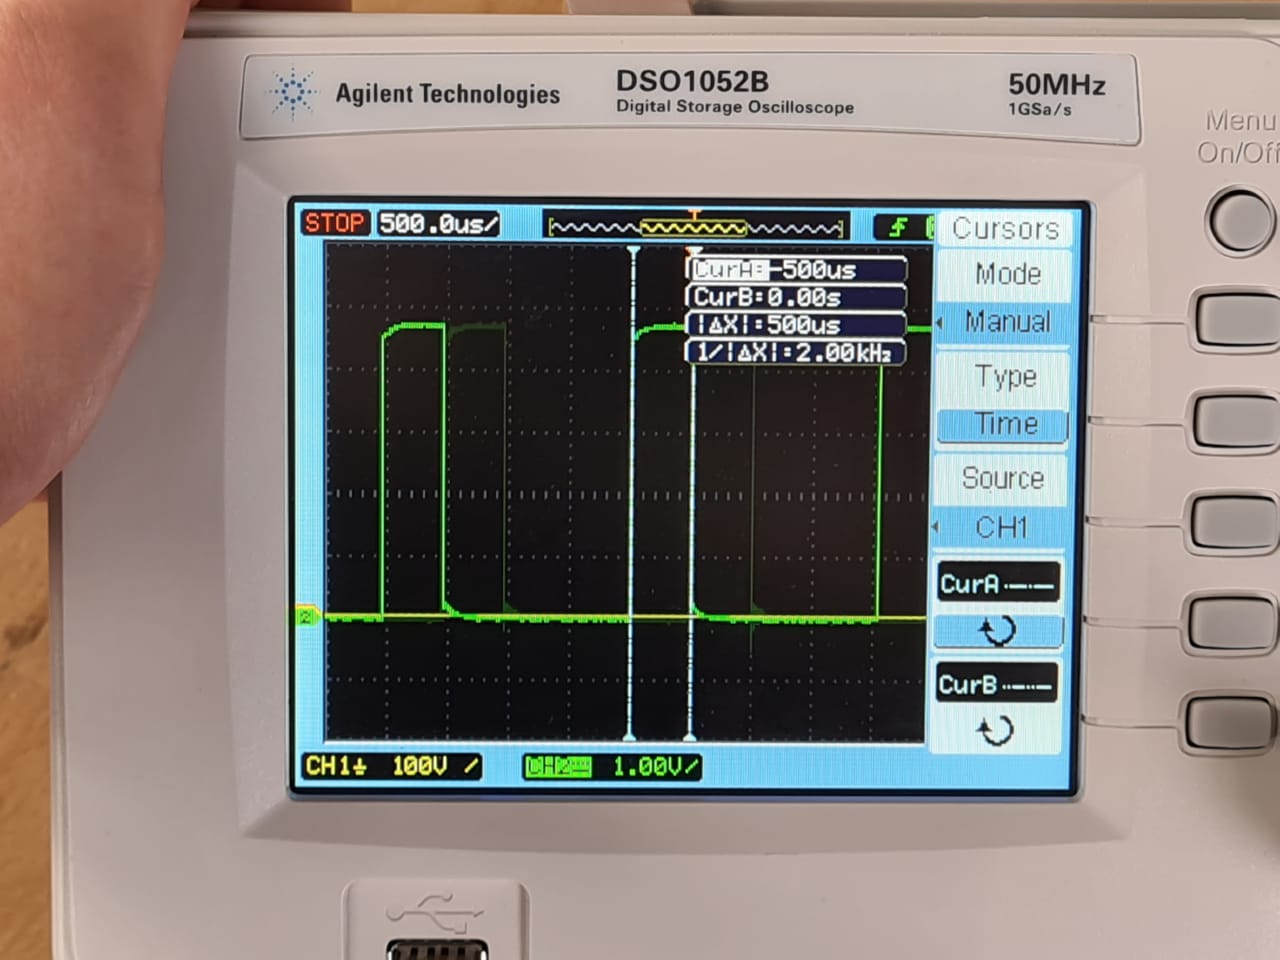
The ON times of the signal do differ according to the output power. The ON time at 25% is only 500 µs…
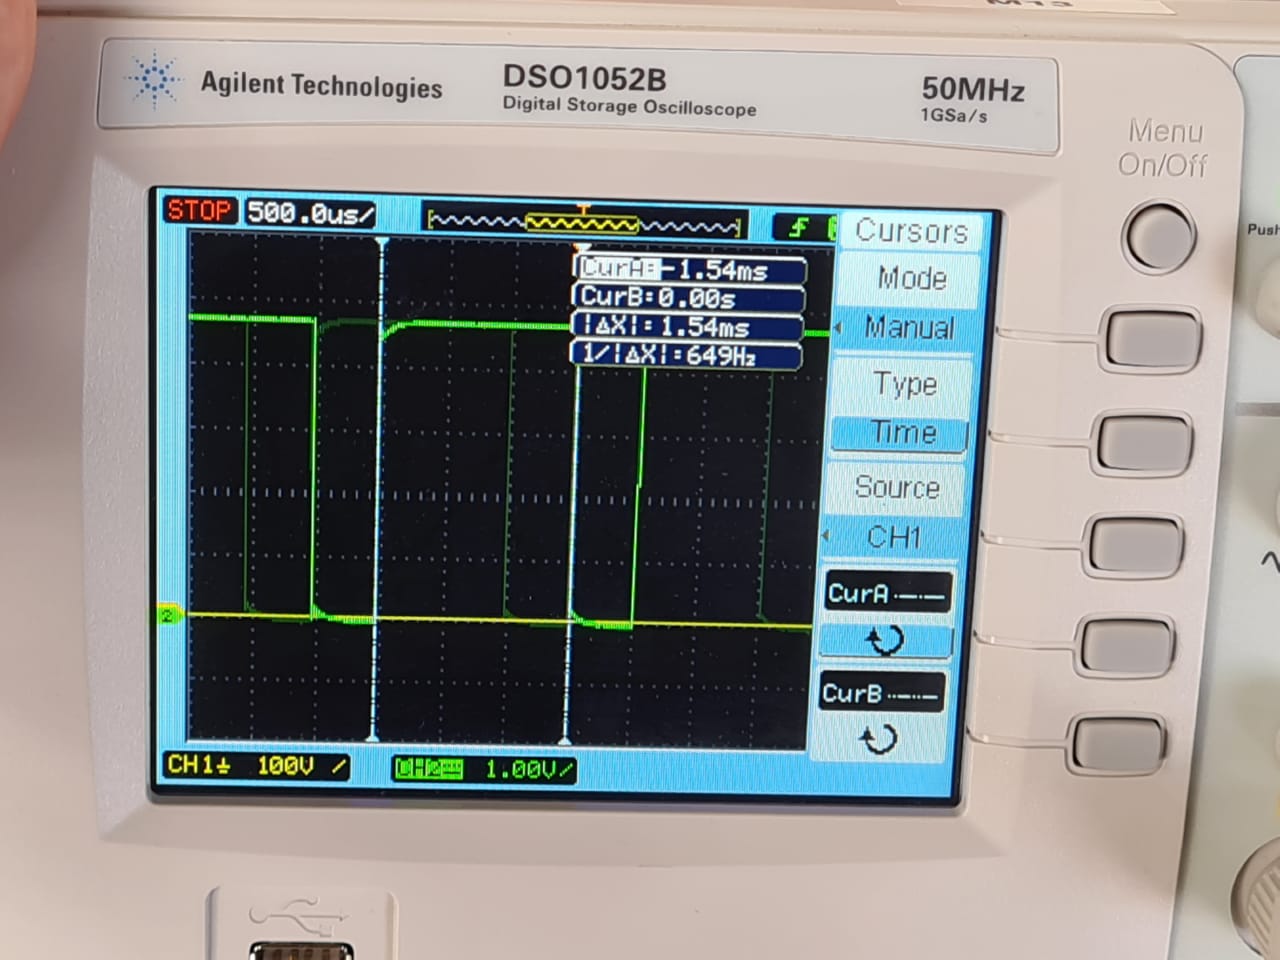
whereas at 75% it is 1.54 ms (1540 µs):
Group Assignment Progress
-
Use the test equipment in your lab to observe the operation of a microcontroller circuit board
Minimum:
- Check operating voltage on the board with multimeter
- Use oscilloscope to check noise of operating voltage
- Use oscilloscope to interpret a data signal