15. Interface and application programming
This week effort was intimidating to me after all the coding challenges I encountered last week in the networking assignment. So I decided to try Processing as it is closest to Arduino IDE which is a platform I am most comfortable with. You can see the group work here once it is completed
Goals:
Write an application that interfaces a user with an input &/or output device that you made
Accomplishments
-
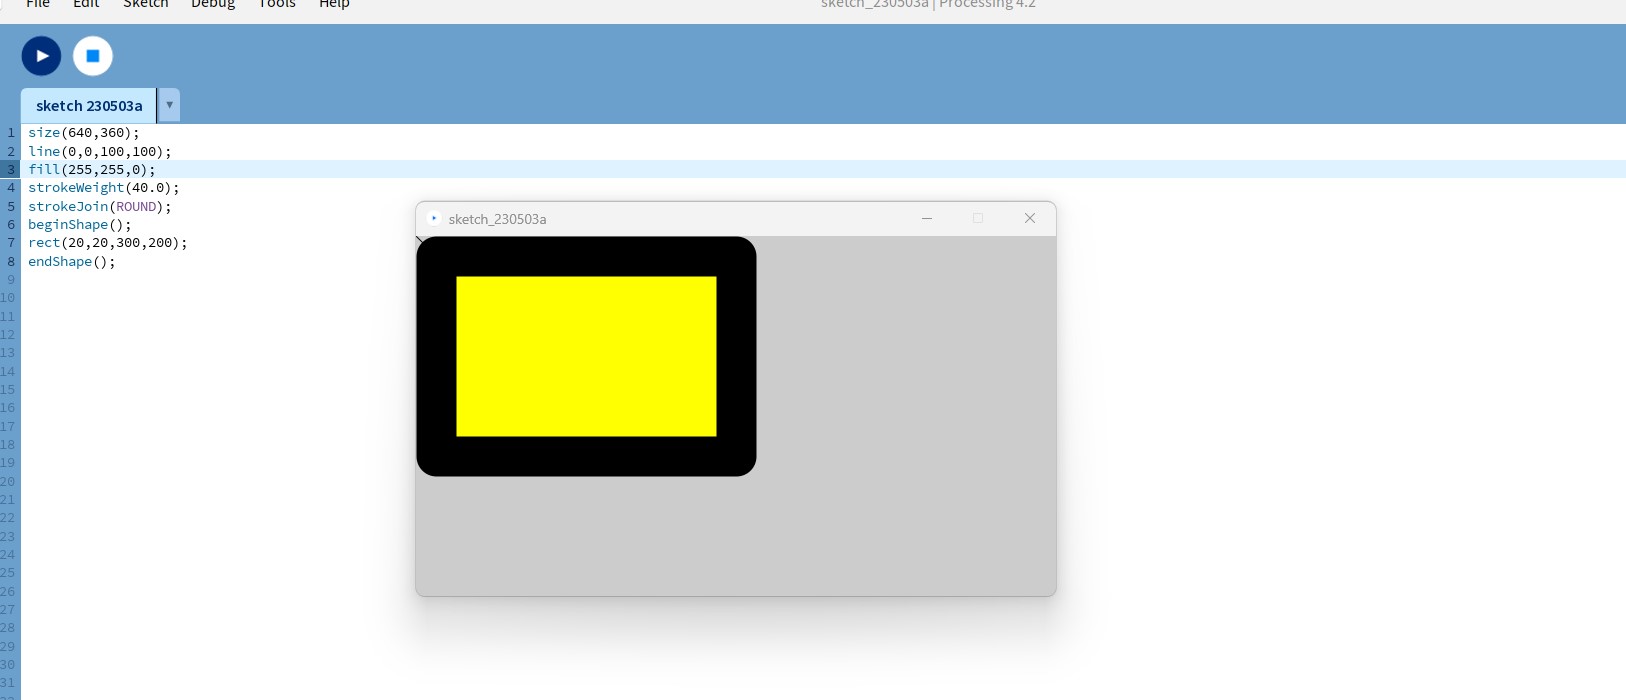
Set up Processing IDE and finished basic tutorials
-
Graphically displayed a potentiometers values connected to RP2040 board displaying on the PC following an example
-
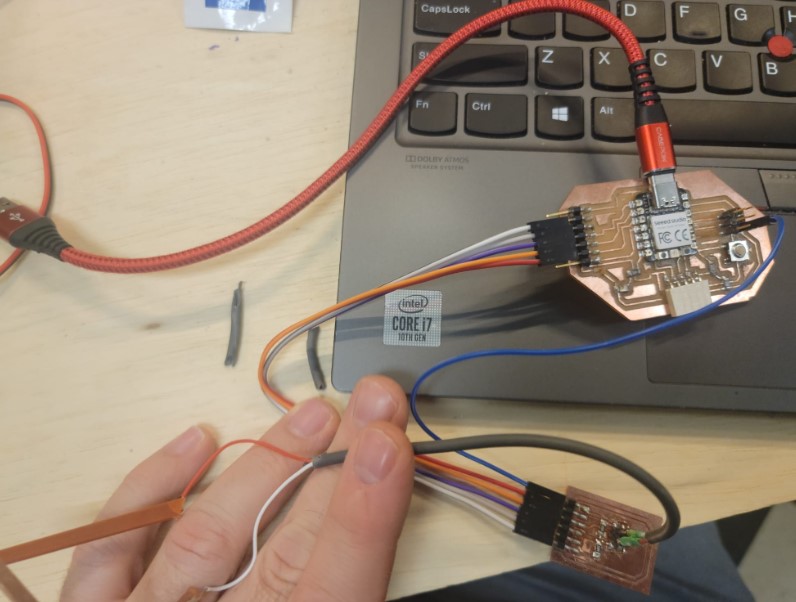
Created my own set up using a step response sensor I built in input week and a 2D graphically display example from the Processing website
Potentiometer graphing
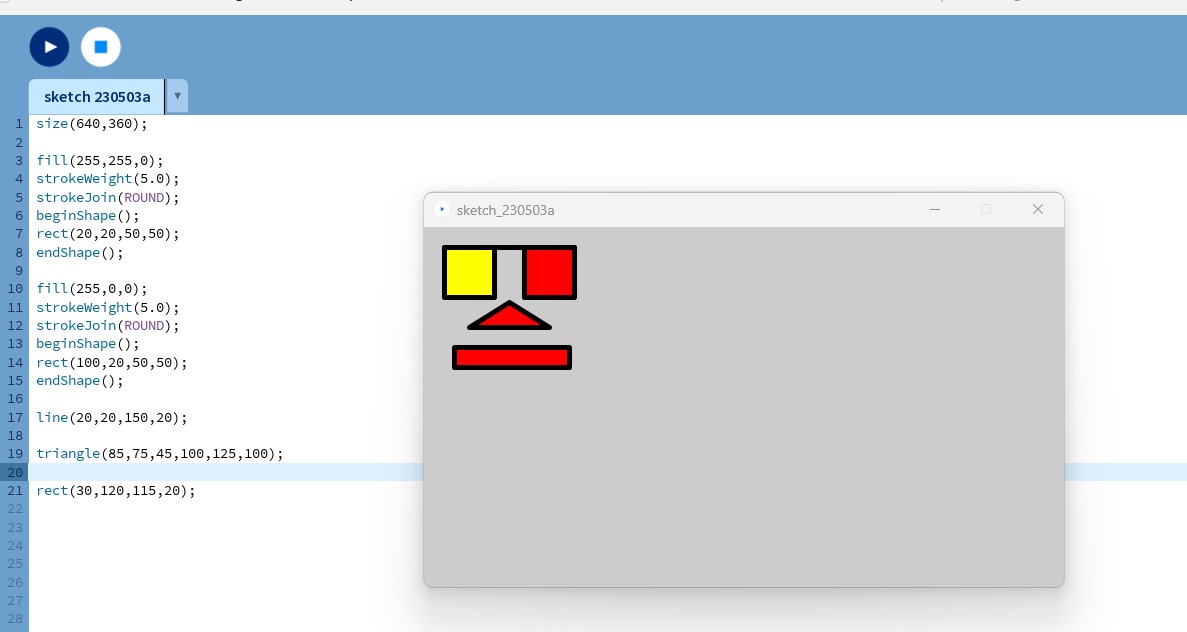
I started this week by looking back at the work 2 of last years students Barbara Morrow and [CharlieHorvath G The both have a great set of processing tutorials from Tom Dubick that I reviewed to learn the basics. Here are some examples of getting basic commands working.
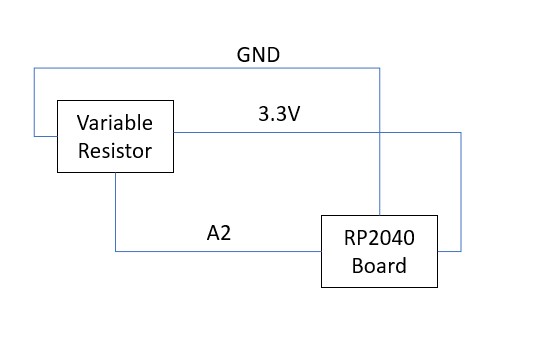
I then decided to try my hand at the reading a potentiometer with the RP2040 Xiao and graphing the results.
I found the following code for the RP2040:
void setup() {
  // initialize the serial communication:
  Serial.begin(9600);
}

void loop() {
  // send the value of analog input 0:
  Serial.println(analogRead(A1));
  // wait a bit for the analog-to-digital converter to stabilize after the last
  // reading:
  delay(2);
}
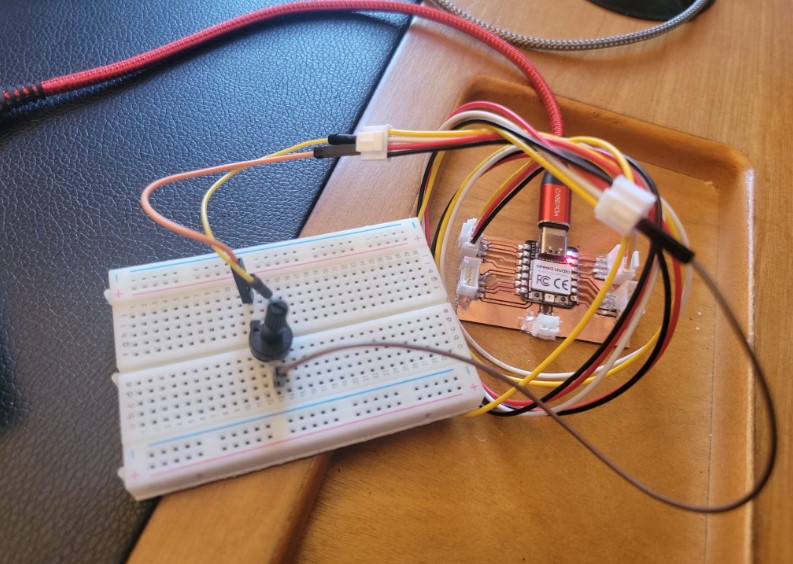
The only change I had to make is calling the input PIN "A1" I kept trying to use pin '2' and that did not work.
Here is the set up and reading
Now I found the following code for the Porcessing graphing part:
// Graphing sketch

// This program takes ASCII-encoded strings from the serial port at 9600 baud
// and graphs them. It expects values in the range 0 to 1023, followed by a
// newline, or newline and carriage return

// created 20 Apr 2005
// updated 24 Nov 2015
// by Tom Igoe
// This example code is in the public domain.
// Some minor changes were made in May 2023 informed by ChatGPT

import processing.serial.*;

Serial myPort;        // The serial port
int xPos = 1;         // horizontal position of the graph
float inByte = 0;

void setup () {
  // set the window size:
  size(1400, 1300);

  // List all the available serial ports
  // if using Processing 2.1 or later, use Serial.printArray()
  println(Serial.list());


myPort = new Serial(this, "COM23", 9600); // set port 23

  // don't generate a serialEvent() unless you get a newline character:
  myPort.bufferUntil('\n');

  // set initial background:
  background(0);
}

void draw () {
  // draw the line:
  stroke(127, 34, 255);
  line(xPos, height, xPos, height - inByte);

  // at the edge of the screen, go back to the beginning:
  if (xPos >= width) {
    xPos = 0;
    background(0);
  } else {
    // increment the horizontal position:
    xPos++;
  }
}

void serialEvent (Serial myPort) {
  // get the ASCII string:
  String inString = myPort.readStringUntil('\n');

  if (inString != null) {
    // trim off any whitespace:
    inString = trim(inString);
    // convert to an int and map to the screen height:
    inByte = float(inString);
    println(inByte);
    inByte = map(inByte, 0, 1023, 0, height);
  }
} // <-- missing closing brace here
I had to adjust the original line designating the serial port for communication with ChatGPTs help to be preset to port 23.
Going from
myPort = new Serial(this, Serial.list()[0], 9600);
to
myPort = new Serial(this, "COM23", 9600);
Here is the set up
and here is the working results
Step response visualization
In order to push a little deeper I decided to set up a similar interation but using a diffferent sensor and visulaization effect
I pulled out the step response sensor I built during "input week" and found a different visulaization effect.
I used the following code for the step sensor straight of input week:
#include <Adafruit_NeoPixel.h>

int Power = 11;
int PIN = 12;
#define NUMPIXELS 1

long result;   //variable for the result of the tx_rx measurement.
int analog_pin = 27; //  GPIO 27 of the XIA0 RP2040
int tx_pin = 28;  //     GPIO 28 of the XIAO RP2040
Adafruit_NeoPixel pixels(NUMPIXELS, PIN, NEO_GRB + NEO_KHZ800);


void setup() {
pinMode(tx_pin,OUTPUT);      //Pin 2 provides the voltage step
Serial.begin(115200);
pixels.begin();
  pinMode(Power,OUTPUT);
  digitalWrite(Power, HIGH);

}


long tx_rx(){         //Function to execute rx_tx algorithm and return a value
                      //that depends on coupling of two electrodes.
                      //Value returned is a long integer.
  int read_high;
  int read_low;
  int diff;
  long int sum;
  int N_samples = 100;    //Number of samples to take.  Larger number slows it down, but reduces scatter.

  sum = 0;

  for (int i = 0; i < N_samples; i++){
   digitalWrite(tx_pin,HIGH);              //Step the voltage high on conductor 1.
   read_high = analogRead(analog_pin);        //Measure response of conductor 2.
   delayMicroseconds(100);            //Delay to reach steady state.
   digitalWrite(tx_pin,LOW);               //Step the voltage to zero on conductor 1.
   read_low = analogRead(analog_pin);         //Measure response of conductor 2.
   diff = read_high - read_low;       //desired answer is the difference between high and low.
 sum += diff;                       //Sums up N_samples of these measurements.
 }
  return sum;
}                         //End of tx_rx function.


void loop() {

result = tx_rx();
result = map(result, 17000, 23000, 0, 1024);  //I recommend mapping the values of the two copper plates, it will depend on their size
Serial.println(result);

  if (result < 3000) {
  pixels.setPixelColor(0, pixels.Color(15, 25, 205));
  } else if (result >= 5000) {
  pixels.setPixelColor(0, pixels.Color(233, 242, 205));
  } else {
  pixels.setPixelColor(0, pixels.Color(233, 23, 23));

  }
  pixels.show();

delay(100);
}
and the following in Proecssing
// Graphing sketch

// This program takes ASCII-encoded strings from the serial port at 9600 baud
// and graphs them. It expects values in the range 0 to 1023, followed by a
// newline, or newline and carriage return

// created 20 Apr 2005
// updated 24 Nov 2015
// by Tom Igoe
// This example code is in the public domain.
// Some minor changes were made in May 2023 informed by ChatGPT

import processing.serial.*;

Serial myPort;        // The serial port
int xPos = 1;         // horizontal position of the graph
float inByte = 0;

void setup () {
  // set the window size:
  size(1400, 1300);

  // List all the available serial ports
  // if using Processing 2.1 or later, use Serial.printArray()
  println(Serial.list());

  // I know that the first port in the serial list on my Mac is always my
  // Arduino, so I open Serial.list()[0].
  // Open whatever port is the one you're using.
myPort = new Serial(this, "COM13", 9600); // for Windows

  // don't generate a serialEvent() unless you get a newline character:
  myPort.bufferUntil('\n');

  // set initial background:
  background(0);
}

void draw () {
  // draw the line:
  loadPixels();
  float n = (inByte * 10.0) / width;
  float w = 16.0;         // 2D space width
  float h = 16.0;         // 2D space height
  float dx = w / width;    // Increment x this amount per pixel
  float dy = h / height;   // Increment y this amount per pixel
  float x = -w/2;          // Start x at -1 * width / 2
  for (int i = 0; i < width; i++) {
    float y = -h/2;        // Start y at -1 * height / 2
    for (int j = 0; j < height; j++) {
      float r = sqrt((x*x) + (y*y));    // Convert cartesian to polar
      float theta = atan2(y,x);         // Convert cartesian to polar
      // Compute 2D polar coordinate function
      float val = sin(n*cos(r) + 5 * theta);           // Results in a value between -1 and 1
      //float val = cos(r);                            // Another simple function
      //float val = sin(theta);                        // Another simple function
      // Map resulting vale to grayscale value
      pixels[i+j*width] = color((val + 1.0) * 255.0/2.0);     // Scale to between 0 and 255
      y += dy;                // Increment y
    }
    x += dx;                  // Increment x
  }
  updatePixels();
}


void serialEvent (Serial myPort) {
  // get the ASCII string:
  String inString = myPort.readStringUntil('\n');

  if (inString != null) {
    // trim off any whitespace:
    inString = trim(inString);
    // convert to an int and map to the screen height:
    inByte = float(inString);
    println(inByte);
    inByte = map(inByte, 0, 1023, 0, height);
  }
}
I used 2 scrap pieces of PCB as electrodes
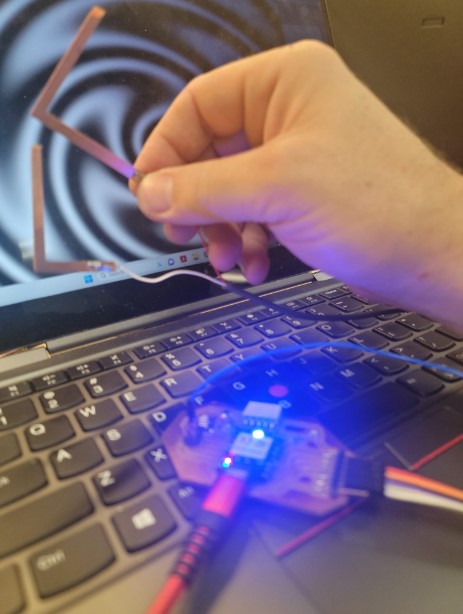
This was pretty straight forward and using the inByte to replace the variable in the 2D graphing example code I found on the Processing websiteexamples
And you can see the results here in action:
You can find this week files here