I downloaded the Iván Sánchez Milara's Tkinter Hello World Sensor and sensor data random generator for Arduino. I had already installed pySerial library. I converted the example to use ser.readline() and changed the baud rate to 115200. I had MicroPython flashed on my board, board design and MicroPython flashing are in the previous week. Code running on the ESP8266:
#ESP program
import utime, machine, dht

d = dht.DHT11(machine.Pin(13))

while True:
    d.measure()
    print(d.humidity()) # prints to serial as ASCII with default baud 115200
    utime.sleep_ms(1000)
The board is connected to UART to USB converter and the USB side is connected to the PC.
# Snippet from the PC program
def idle (self):
        self.value = ser.readline()
        print(self.value)
        self.label_text.set(self.LABEL_TEXT.format(str(self.value)))
        self.update() # updates everything, draws widgets etc.
        self.master.update_idletasks()
        self.master.after(50, self.idle)
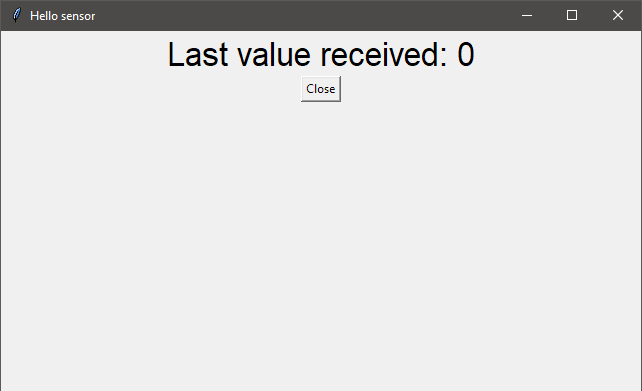
Tkinter window
I had to convert the read line to int with int(ser.readline()) to get the PC program working. Tkinter display was showing the value correctly but was really unresponsive. I thought that the reason is either the readline() or the slow serial writing on the MicroPython side. The maximum poll rate of DHT11 is 1 Hz. I decided to test it with Iván's original code and just increased the delay in the Arduino data generator. Tkinter window became unresponsive so I knew that the ser.read() and ser.readline() were blocking the operation. I remember that Arduino has some kind of if (Serial.avaible()) so I googled if python had something similar and this came up. So I modified the idle function.
# Snippet from the PC program
def idle (self):
    #
    # idle routine
    #
    ser.flush()
    if ser.inWaiting():
        self.value = int(ser.readline())
        print(self.value)
        self.label_text.set(self.LABEL_TEXT.format(str(self.value)))
        self.update()
    self.master.update_idletasks()
    self.master.after(50, self.idle)
I don't really know what all the updates in the Iván's code do. Now the Tkinter window was responsive again. I haven't done a lot of object-oriented programming, so I have to say that I get easily confused when there starts to be over five dots in one line or when I need self or not.
Next I wanted to send a message to OLED display that I had on my board. Because the MicroPython REPL uses the UART to communicate, I knew that I might have some problems with that. So I checked the documentation and it told me that I could detach the REPL with the following commands:
Now I made the previous program again but with uart.write() instead of print() because print() is a REPL function and after disabling it it won't work.
import utime, machine, dht, ssd1306
import uos

uos.dupterm(None, 1) # https://docs.micropython.org/en/latest/esp8266/quickref.html?highlight=dht#uart-serial-bus

uart = machine.UART(0, 115200)
uart.init(115200, bits=8, parity=None, stop=1)
d = dht.DHT11(machine.Pin(13))

while True:
    d.measure()
	h = d.humidity()
    uart.write(str(h))
    uart.write("\r\n") # had to add carriage return
    utime.sleep_ms(1000)
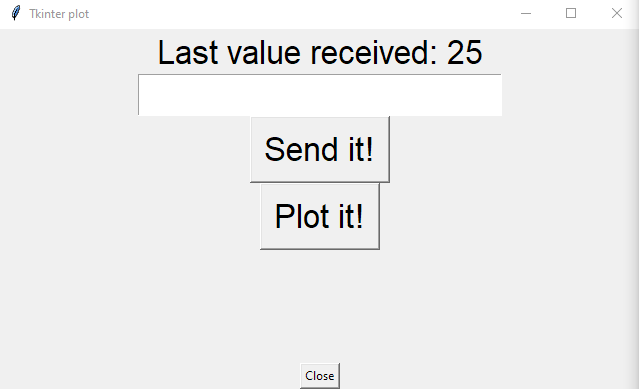
I had to add the newline and carriage return symbols to get it working. Windows or PuTTY want's both the newline character and carriage return, so I added those to get the ser.readline() working. Now that I could write with uart I could start working on the writing with Tkinter. I learned quit a lot from Tampere university's graphical user interface basics (in finnish), alternative link. I used info gained from that to make a entry box and a button that would send the message over serial.
self.send_string = Entry(font=("Arial", 25)) # makes entry box
self.send_string.pack() # pack is a simple geometry manager and it places the widget to the parent so it can be displayed
self.send_button = Button(master, text="Send it!", command=self.send, font=("Arial", 25)) # makes a button with text "Send it!"
self.send_button.pack()

def send (self):
    s = self.send_string.get()
    ser.write(s.encode('utf-8'))
    self.send_string.delete(0, "end") # clear the entry box
I had to use encoding and decoding on both ends. On the board, I also checked that the uart.readline() didn't return None so I wouldn't display that when the Tkinter wasn't sending anything.
import utime, machine, dht, ssd1306
import uos

uos.dupterm(None, 1) # https://docs.micropython.org/en/latest/esp8266/quickref.html?highlight=dht#uart-serial-bus

uart = machine.UART(0, 115200)
uart.init(115200, bits=8, parity=None, stop=1)

d = dht.DHT11(machine.Pin(13))
i2c = machine.I2C(machine.Pin(14), machine.Pin(2)) # SCL, SDA
oled = ssd1306.SSD1306_I2C(128, 64, i2c)
s = ""

while True:
    oled.fill(0)
    a = uart.readline()

    if a is not None:
        s = a.decode('utf-8')

    oled.text(s, 0, 0, 1)
    oled.show()

    d.measure()
    h = d.humidity()

    uart.write(str(h))
    uart.write("\r\n") # had to add carriage return and newline
    utime.sleep_ms(1000)
I wanted to plot the values so I just started saving them in the PC side to a list. I used matplotlib to do this. It is a library that tries to bring the plotting functions from MATLAB to python. First I added
...
import matplotlib.pyplot as plt
...
value = []
...
def send(self):
    ...
    plt.plot(self.value)
    plt.show()
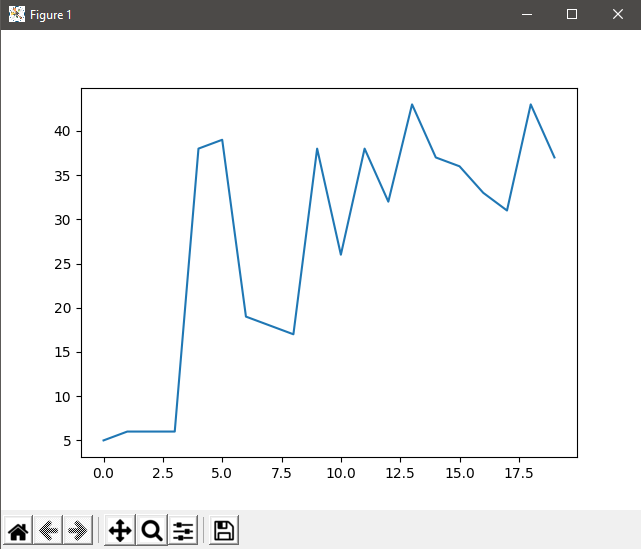
to the send function so I could see that I was storing some plottable values. Value is not the bast variable name for values but since I was just super gluing stuff together anyway, so I didn't bother with good naming. The plot opened in the new window. I wanted to try to plot in the Tkinter window. I added a button for plotting and searched a lot about matplotlib and Tkinter. I got a solution that would plot in the Tkinter window but when I pressed the plot button again it would create a new graph and plot to that and so on. I think the reason was that I was always creating a new object in the plot function. I think I knew what the problem was but I just couldn't fix it. Here is the code for the buggy plotting:
Tkinter windowPyplot window with its built in controls
I added plt.clf() so the plotting didn't draw over the old plot. I wanted to change the plot button to tick box and always plot when the tick box was ticked, but I run out of time. Here is the video of sending message and plotting:
The close button becames unresponsive after plotting and I don't have a good reason for it.
I have to say that I thought that I was better with objects and python but this week really proved me otherwise. If I would do this again I would start with much simpler programs and do it from the start from myself so I would have better understanding of whats happening and where.
Let's start with the easiest user interface first, Arduino Serial Plotter. If you are using Arduino IDE for the programming of your board, you can just start the serial plotter from the tools menu. For this demo I used the board that I had made in the input and output weeks with the DHT11 temperature and humidity sensor from the same weeks. I used the Adafruits DHT Sensor Library which also needs Adafruit Unified Sensor Lib. I installed these libraries using Arduinos built in Library Manager (Tools → Manage Libraries...). I used the DHT_Unified_Sensor example for the base of the demo. I removed all the unnecessary serial prints but I left some of the error prints in. I modified it to just print the temperature and humidity separated by a tab and newline after humidity. So the serial print format looked like this:
tmpValue\thmdValue\n
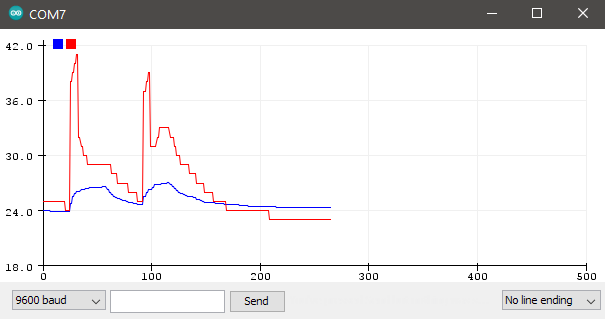
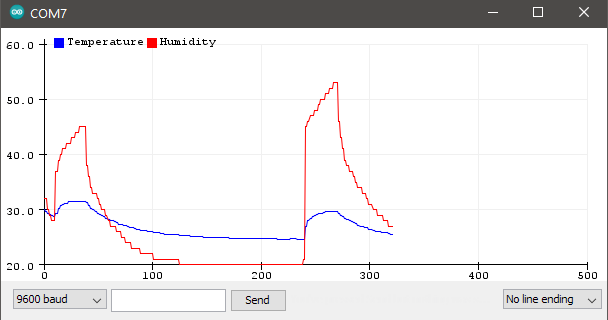
Now I just opened the serial plotter from the tools and got this:
Simple Serial Plotter demo
The two peaks are from when I touched the sensor with my fingers. I was running the sensor without it's case so it would react faster. I also still had the delay that the example uses. It is defined by the sensor and should be one second. That is also the reason why I didn't have the patience to wait the whole graph to fill. I could figure out that the red line was the humidity reading because it always has responded faster to changes. I was thinking if there would be a way to add labels to the graph and found this descriping exactly that. So now my print format was:
Temperature:tmpValue\tHumidity:hmdValue\n
And the whole void loop looked like this:
void loop() {
    // Delay between measurements.
    delay(delayMS);
    // Get temperature event and print its value.
    sensors_event_t event;
    dht.temperature().getEvent(&event);
    if (isnan(event.temperature)) {
        Serial.println(F("Error reading temperature!"));
    }
    else {
        Serial.print("Temperature:");
        Serial.print(event.temperature);
        Serial.print("\t");
    }
    // Get humidity event and print its value.
    dht.humidity().getEvent(&event);
    if (isnan(event.relative_humidity)) {
        Serial.println(F("Error reading humidity!"));
    }
    else {
        Serial.print("Humidity:");
        Serial.println(event.relative_humidity);

    }
}
Now I got a nice, labeled graph without doing any actual UI coding or plotting.
Labeled Serial Plotter demo
It's good that you can still send data to serial port but it's bad that you can't see the raw feed of the serial while using the serial plotter. Atleast I didn't find a way to adjust axis yourself. The Y-axis scales automatically and the X-axis is just lines and starts to scroll after 500 lines are completed.
For testing out if you get sensible data out of your sensor/sensors, this is the best option, if
you are already using Arduino IDE.
Download DHT_Unified_Sensor.ino
For Blynk I started following the Iván Sánchez Milara's HelloLed guide in our Moodle.
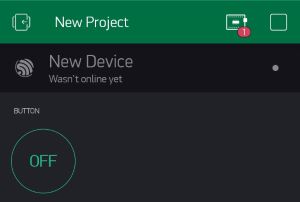
I downloaded the blynk library to Arduino IDE, installed the app to my android phone and made an account for it. I got the Blynk Blink example from their example site. I made a new project in the app and got the authorization token for it. I filled the authorization token and my WiFi credentials to the example and uploaded them to my board. In the app I added a button controlling the GPIO 2 pin which is connected to built in LED.
I got a error that "New Device Wasn't online yet" so I double checked the authorization and it was correct.
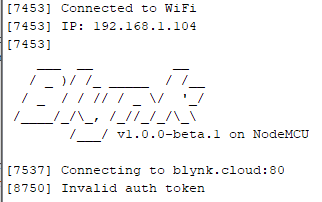
I opened the serial monitor on Arduino IDE and it claimed that I had "Invalid auth token". I logged out of the app and made a new project with new authorization token and uploaded the code with the new token but that didn't help.
I started following the advice in this thread. I pinged the blynk-cloud.com from command line and got a response. So based on the advice on the thread I changed the Blynk.begin(auth, ssid, pass) to Blynk.begin(auth, ssid, pass, IPAddress(139,59,206,133)) where the IP address is the address that I got from pinging the blynk-cloud.com. Now I got the Blynk Blink working and could control the led with the phone app.
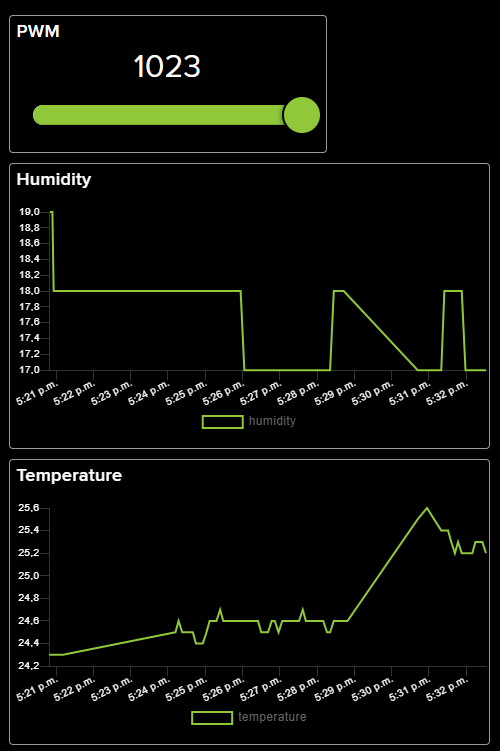
I wanted to explore the interactivity a bit more so I downloaded the DHT11 example. It used different libraries that I had so I changed it to use the same method I used in the serial plotter example. In the app, I had bit off difficulties using the labeled value displays because at first I didn't understand their formatting. The label had to be for example for humidity /pin/% where the /pin/ is the value that it gets from the pin (in this case a virtual pin) and % is just a percent sign added in the end for the humidity value. I tried to do just % and thought that the display would always show the value of the pin. I also changed the button to slider which controlled PWM signal to the LED.
With the example in the video I had already used half of my in app currency energy. I think you can buy more energy but I didn't check the pricing. You get 2000 energy free but even the basic button costs 200 energy. I think the limitations with the free version comes rather quickly. I didn't like that almost every menu on the app looks like same, so it was bit hard to tell on what menu you were at times. I also had some trouble with the authorization as I explained. I don't know if the "problem" with the DHT example was because I had old libraries or because the example used old libraries.
Download blynk_blink.ino Download blynk_dht.ino
I also started to loosely following Iván's guide. I installed the Adafruit IO library to Arduino IDE which automatically installed other library dependencies. Then I started to follow the Quick Guide from the Adafruit, unfortunately it doesn't have a direct link. I chose the adafruitio_00_publish example and added correct IO credentials and WiFi credentials to config.h. Then I uploaded the example to my board. In Adafruit IO Feeds I could see the counter feed that was created in the example.
I opened the adafruitio_15_temp_humidity example, removed the Fahrenheit calculations and added a handleMessage() function. This function was based on the Iván's example. I tried to do analogWrite(2, value) but the value was string so I had to cast it analogWrite(2, value.toInt()). I also changed the delay to one second. This caused throttle warning because I was pushing data too fast to the feeds. After fixing these problems I got the code uploaded and could make the slider for the pwm feed to control the LED and the temperature and humidity charts in the Adafruit IO dashboard. I left the delay in the void loop() so controlling the LED was really delayed. This could be easily fixed but I was too lazy to do that.
For free in Adafruit IO you get:
- 30 data points per minute (this is why I got the throttling warning)
- 30 days data storage
- Triggers every 15 minutes
- 5 feed limit
To me Adafruit IO seems like a better choice than blynk. Free accounts possibilities are easier to understand right from the start. I also prefer a desktop/browser interface over an phone app. I didn't delve that deep to either of them but to me it seems like Adafruit IO allows more and maybe easier customization than blynk.
Adafruit IO dashboardDownload adafruitio_15_temp_humidity_pwm.ino Download config.h
Program/Method
Lines of code
Price
Ease of use in my case
Additional info
Arduino Serial Plotter
67
0
☆ ☆ ☆ ☆ ☆
Already built in the Arduino IDE
Blynk
110
Free for limited use, 1000 energy = 0.99$
☆ ☆
Easy to make phone apps to controll your stuff, but IMO a bit sketchy
After I had made FTDI to RS-232 board it was time to test it. I used a jumper wire to connect the DB9 connectors pins 2 and 3 together. I plugged the board to FTDI programmer and opened PuTTY with serial and 9600 baud. I could see what I typed so I knew that the board was working
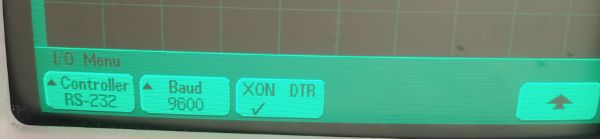
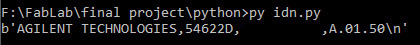
Hammond Pearce had documented how to communicate with the oscilloscope with a real RS-232 cable and a python script. I was using three-wire interface described in the Programmer's Guide so I needed to use the XON/OFF handshaking and 9600 baudrate on COM6. So the python script to get the device ID ended up like this:
import serial

ser = serial.Serial('COM6', 9600, xonxoff=True, timeout=1)

ser.write(b'*IDN?\n')
ser.flush()

idn = ser.readline()
print(idn)
Oscilloscope I/O settings
I set the correct settings on the oscilloscope and run the script.
Oscilloscope's response to the python script. Serial number is hidden.
So now I knew that this was project would be possible to execute.
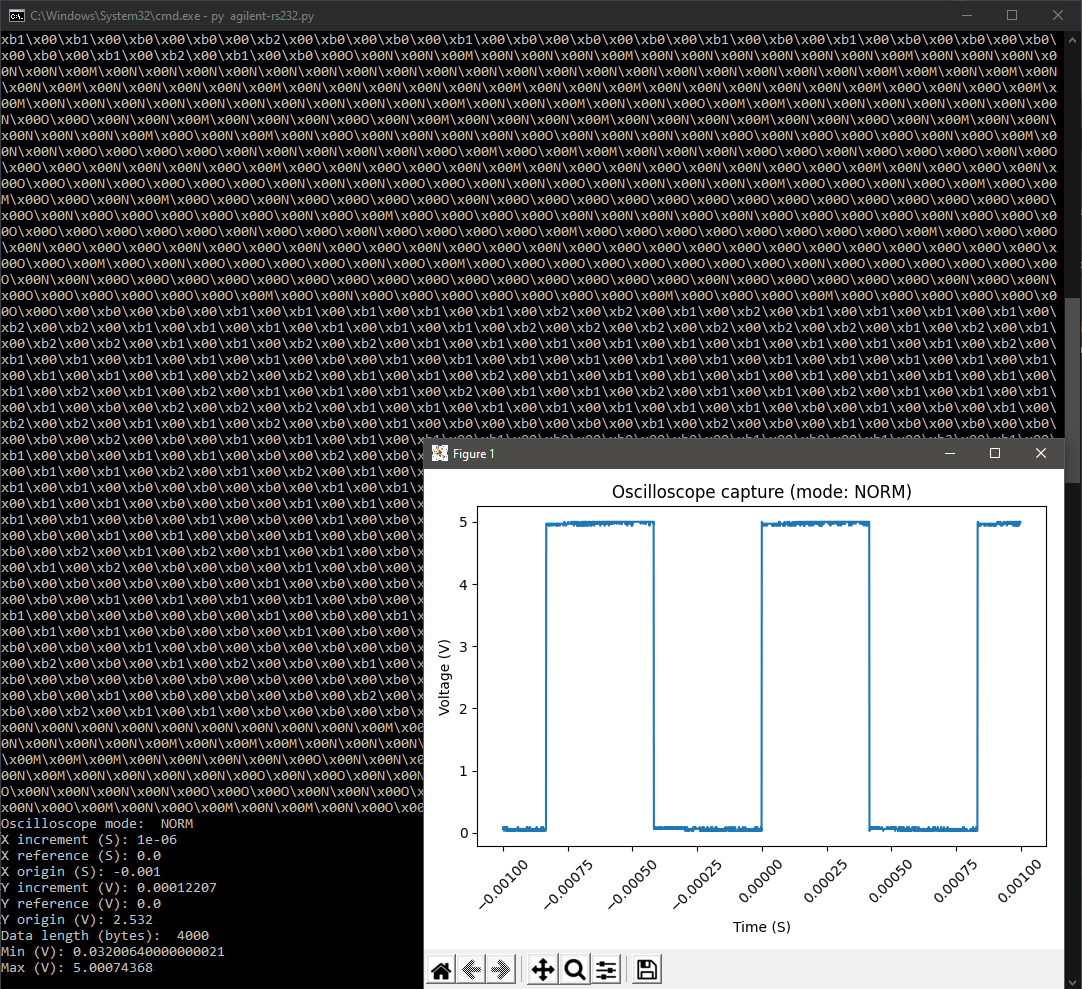
So at this point the hardware still is PC ↔ FTDI programmer ↔ FTDI to RS-232 board ↔ Oscilloscope. I took the Hammond Pearce's code and modified the defaults and the serial handshaking to fit my specific purposes. The original code is really well commented and easy to understand, so all thanks to Hammond Pearce. The default length is the number of points, it can be 100, 250, 500, 1000, 2000 or MAXimum. I would like to use the maximum points if it is possible.
Results after running the script
The code took a second or two to execute because of the pretty slow baud rate but it gave me a good result. There were 4000 bytes so the maximum points was 2000 because the oscilloscope was configured to send words (two bytes per word).
 For Blynk I started following the Iván Sánchez Milara's HelloLed guide in our Moodle.
I downloaded the blynk library to Arduino IDE, installed the app to my android phone and made an account for it. I got the Blynk Blink example from their example site. I made a new project in the app and got the authorization token for it. I filled the authorization token and my WiFi credentials to the example and uploaded them to my board. In the app I added a button controlling the GPIO 2 pin which is connected to built in LED.
I got a error that "New Device Wasn't online yet" so I double checked the authorization and it was correct.
For Blynk I started following the Iván Sánchez Milara's HelloLed guide in our Moodle.
I downloaded the blynk library to Arduino IDE, installed the app to my android phone and made an account for it. I got the Blynk Blink example from their example site. I made a new project in the app and got the authorization token for it. I filled the authorization token and my WiFi credentials to the example and uploaded them to my board. In the app I added a button controlling the GPIO 2 pin which is connected to built in LED.
I got a error that "New Device Wasn't online yet" so I double checked the authorization and it was correct.
 I opened the serial monitor on Arduino IDE and it claimed that I had "Invalid auth token". I logged out of the app and made a new project with new authorization token and uploaded the code with the new token but that didn't help.