This week’s assignment is to measure something: Probe an input device’s analog and digital signals and add a sensor to a microcontroller board that you have designed and read it.
I’ll work on the primary input device for my final project, a pulse sensor to read stress levels.
MAX 30102 High-Sensitivity Pulse Oximeter and Heart-Rate Sensor
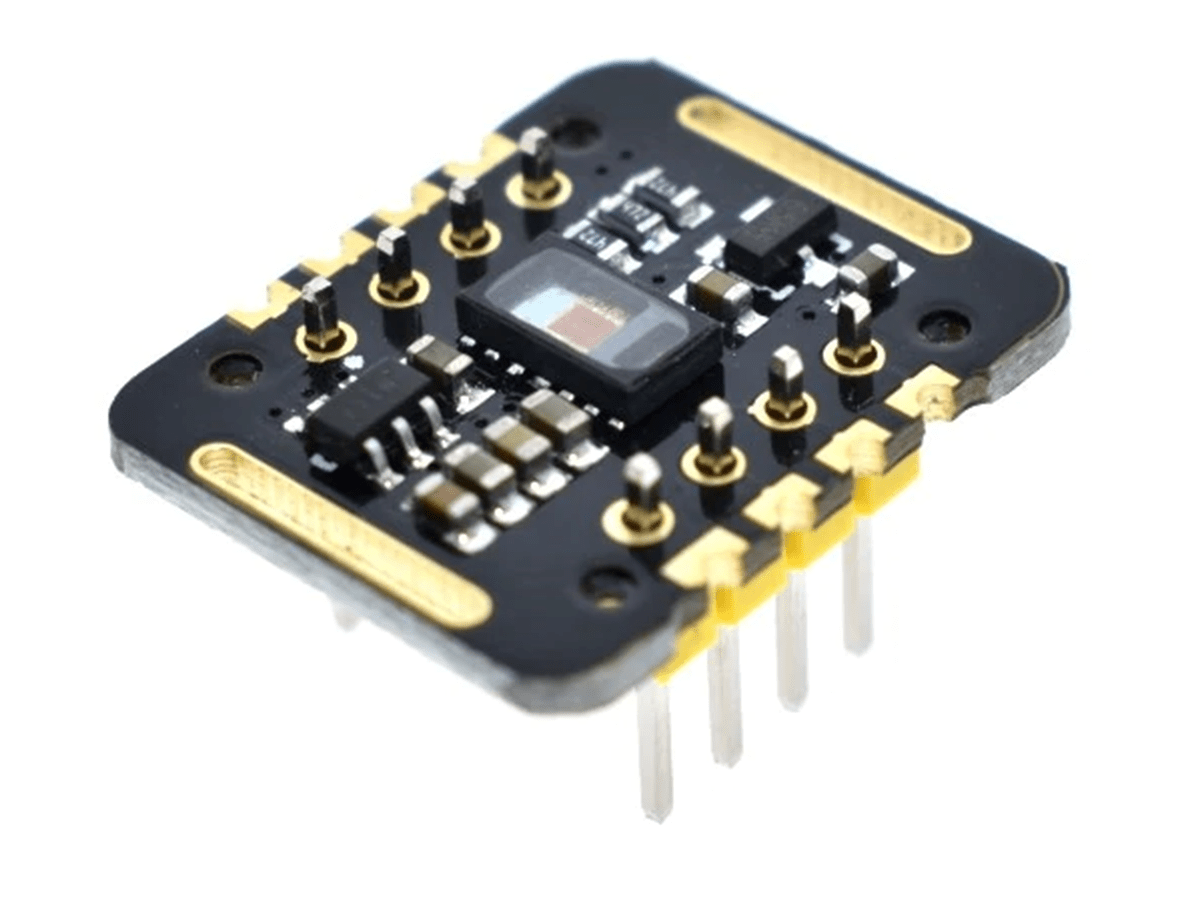
This device is mainly intended for wearables. The MAX30102 is the central SMD component, and I got this already mounted on a module. Here is the Datasheet for the component.
This sensor is used to detect blood oxygen and heart rate. First, infrared radiation is sent and reflected by hitting the finger, and then the amount of oxygen in the blood is determined by measuring the wave amplitude. Heart rate is also obtained by analyzing the time series response of this radiation.
The MAX30102 is an integrated module compatible with the Arduino and STM32. It integrates a red LED with an infrared LED, a photoelectric detector, an optical device, and a low-noise electronic circuit for ambient light suppression. Heart rate and blood oxygen data are also transmitted to the Arduino or other microcontrollers via I2C communication.
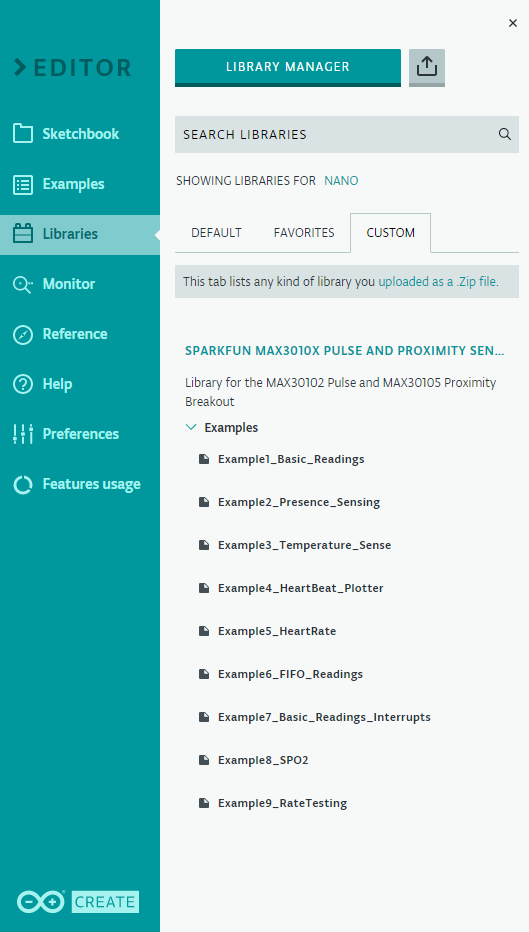
To start using this module we need to download the library, This library is for the SparkFun MAX301x Particle Sensor, on which our module is based. In the download link above there are also some Arduino example codes to test the device.
Testing with Arduino
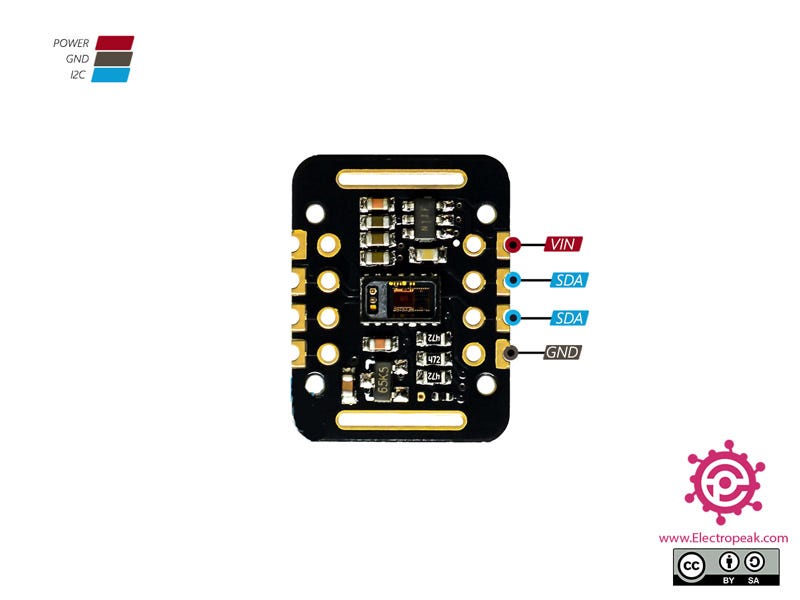
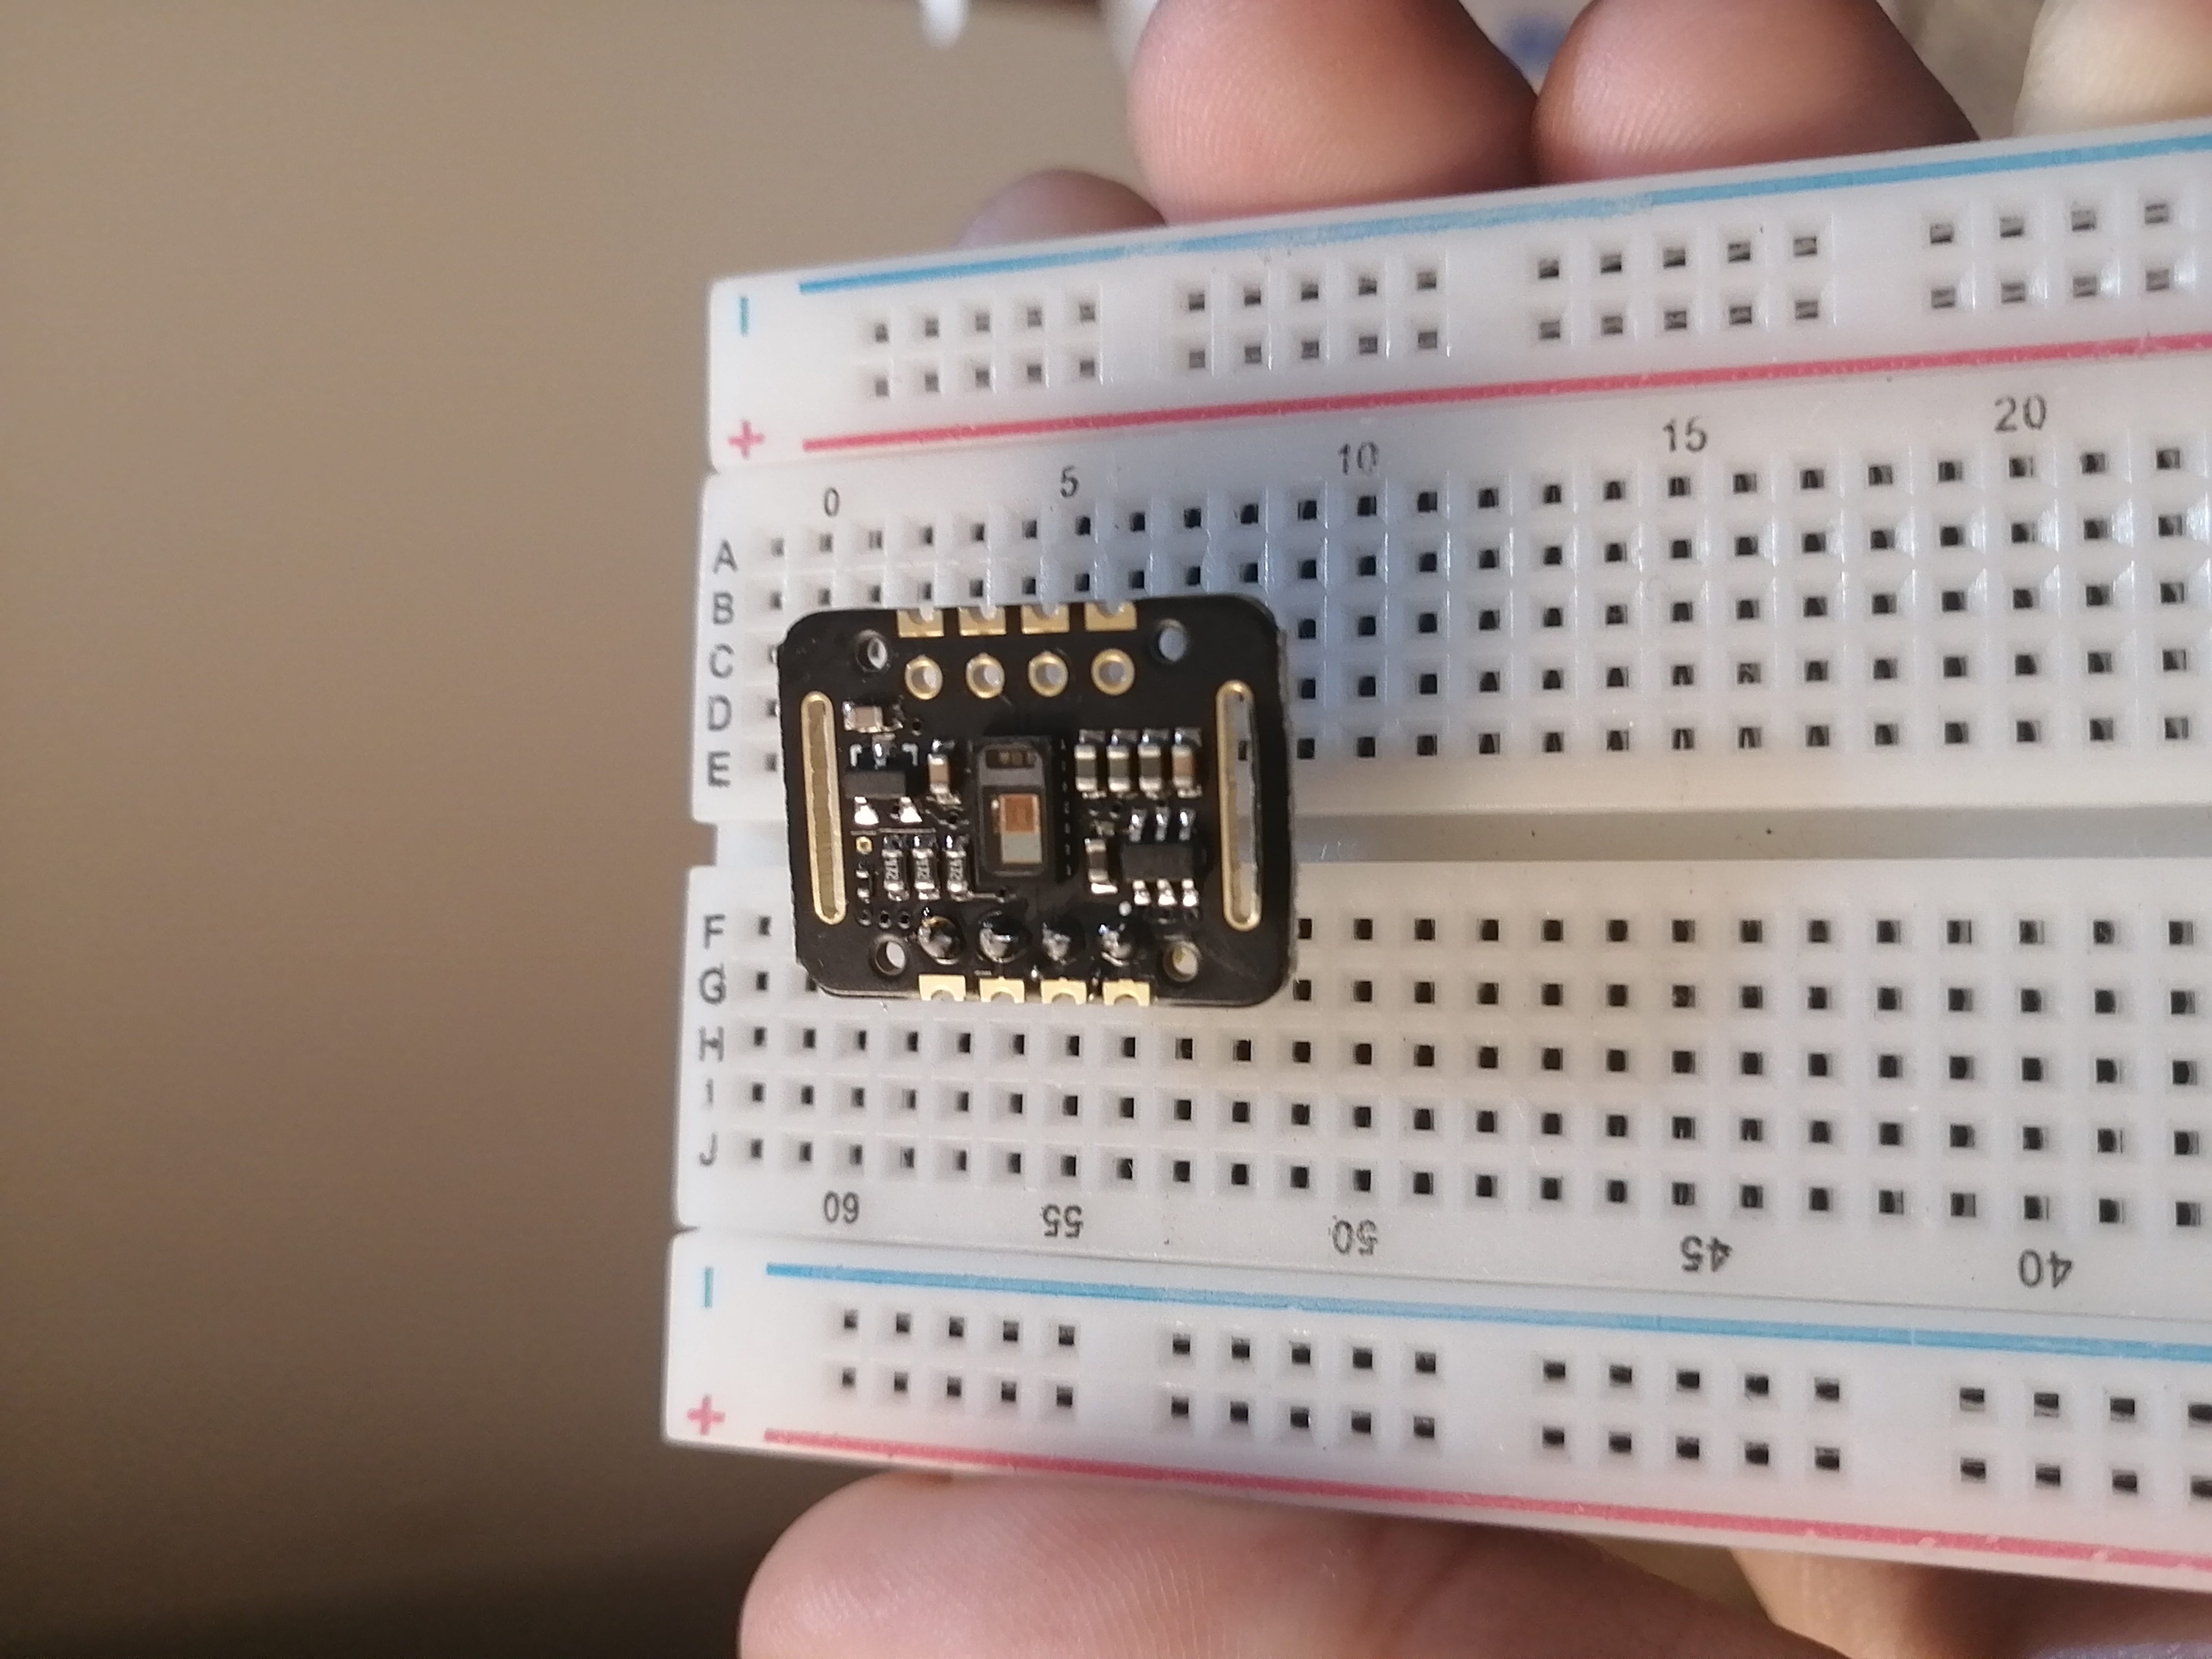
After soldering the 4 pins (VIN, GND, SDA, SCL) and placing the module on a breadboard, I started the wiring, I am using an Arduino Nano, so the SDA and SCL pins are the A4 and A5.
I’ll be using the Arduino web cloud to test the device and example codes. I have already loaded the library and these are the examples that come with it.
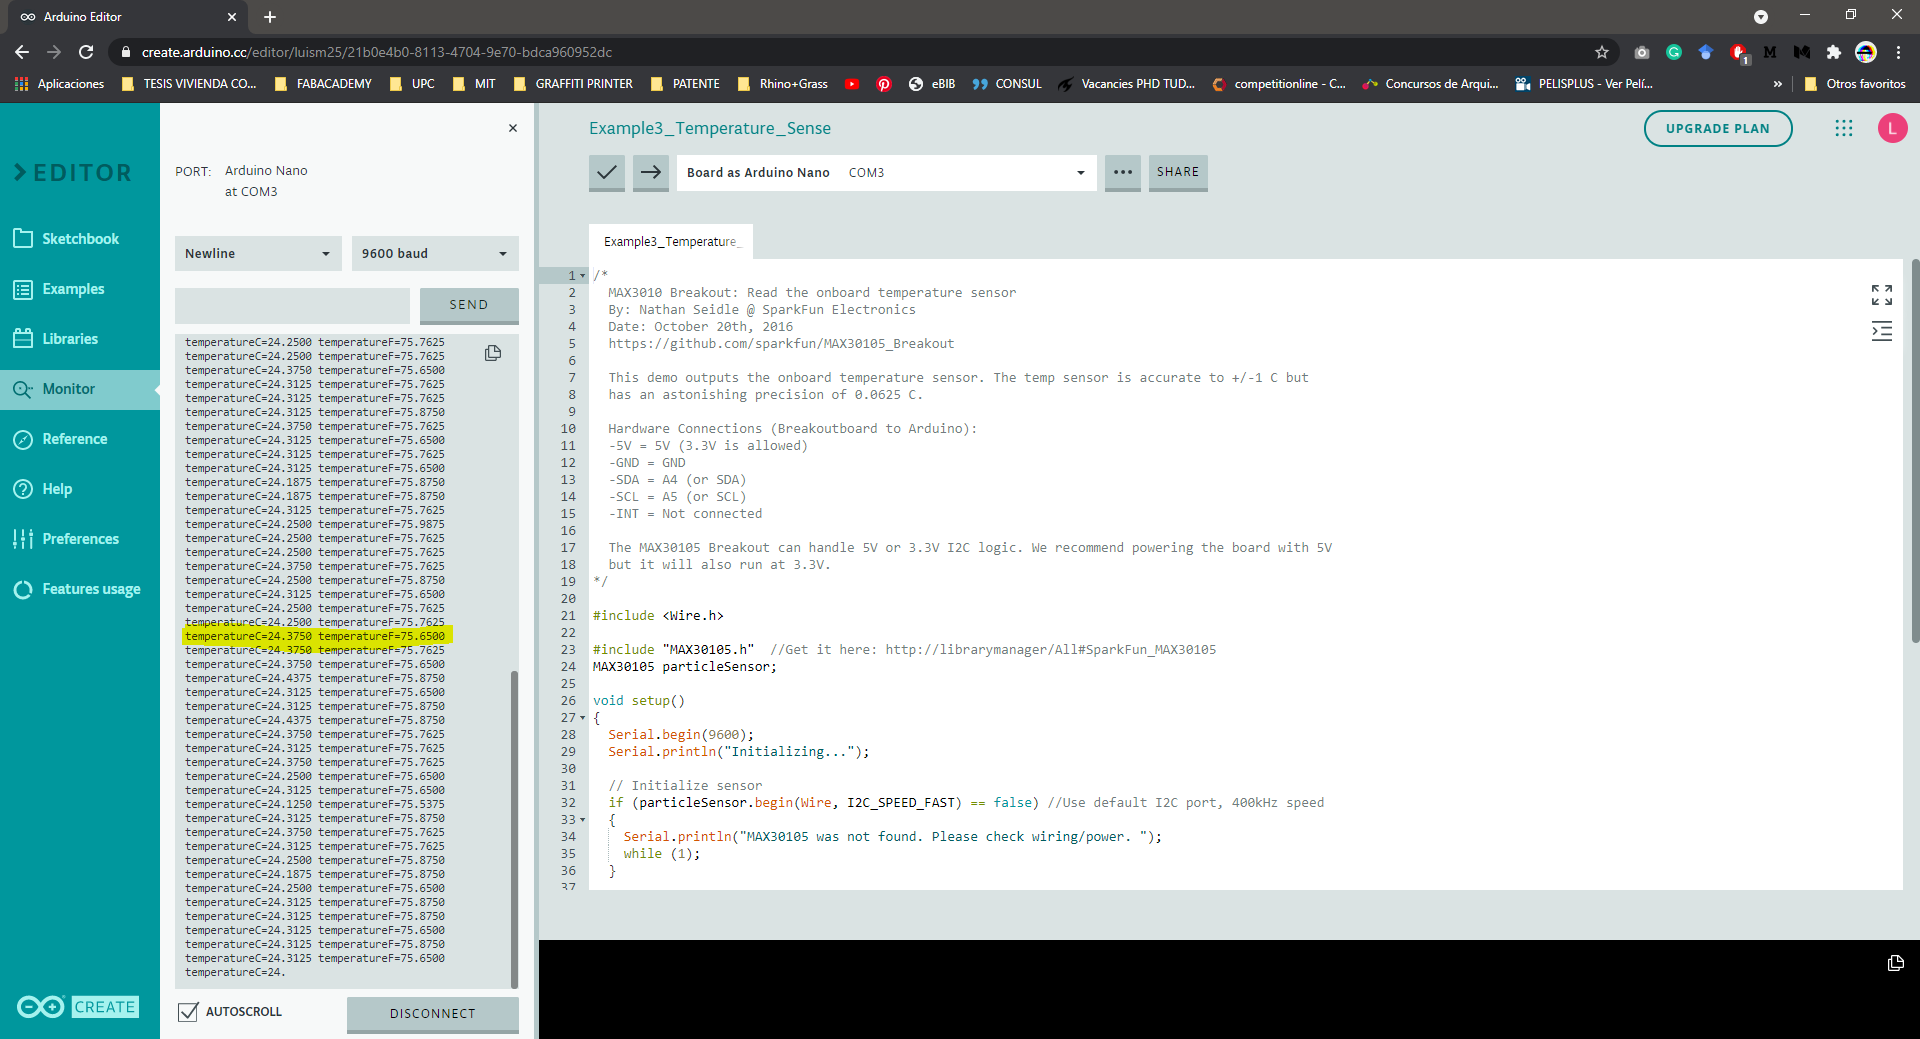
This device also has a temperature sense (Example 3) that measures room temperature (not body temperature). I tested it first because I didn't know that the module could do this.
After loading the example to the Arduino, I opened the Monitor to see the readings. This shows a measurement of 24°C and 74° F. If I place my finger on the sensor the temperature will slowly rise. But it's not adequate to measure body temp.
This example does not turn on the LED on the module.
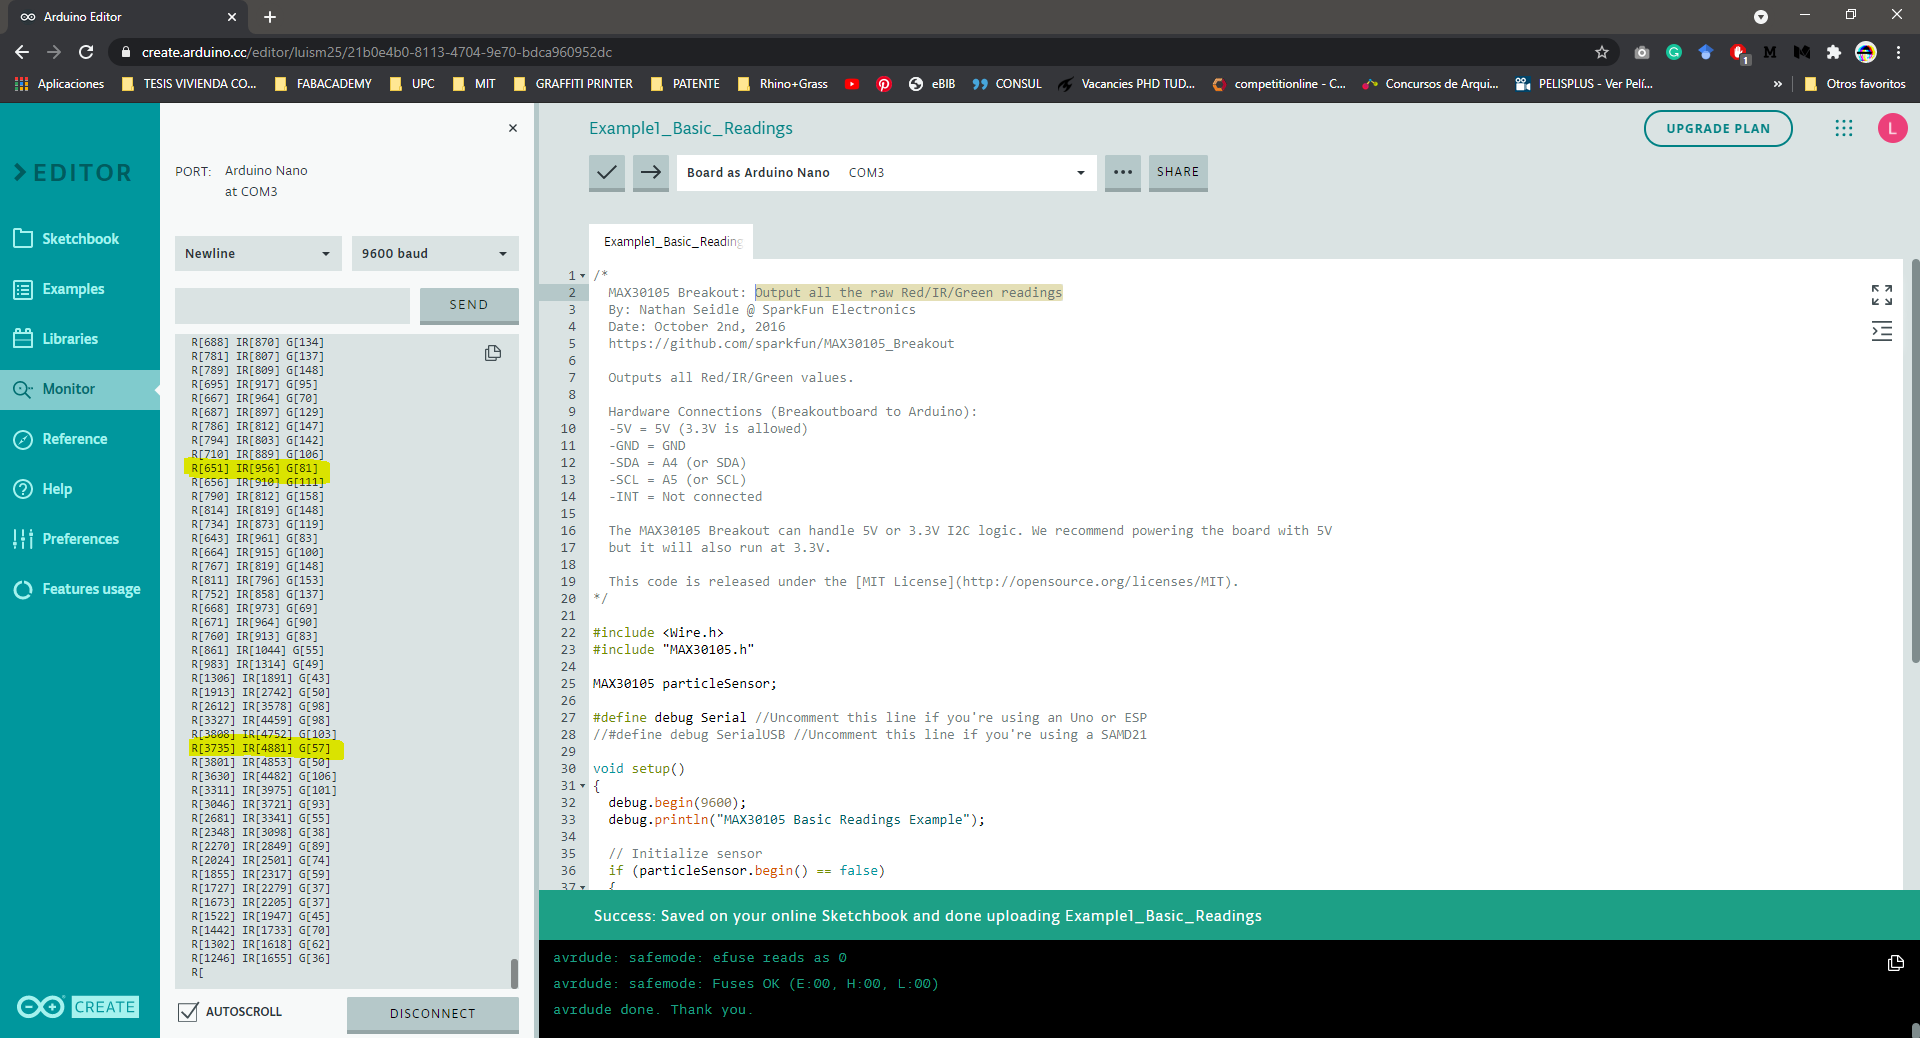
Next, I tried Example 1: Basic Readings, this Output all the raw Red/IR/Green readings, I'm not quite sure what does mean, or what is used for, but it works kind of a close-range proximity sensor, and the readings change if I place my finger on the module or if something is above it.
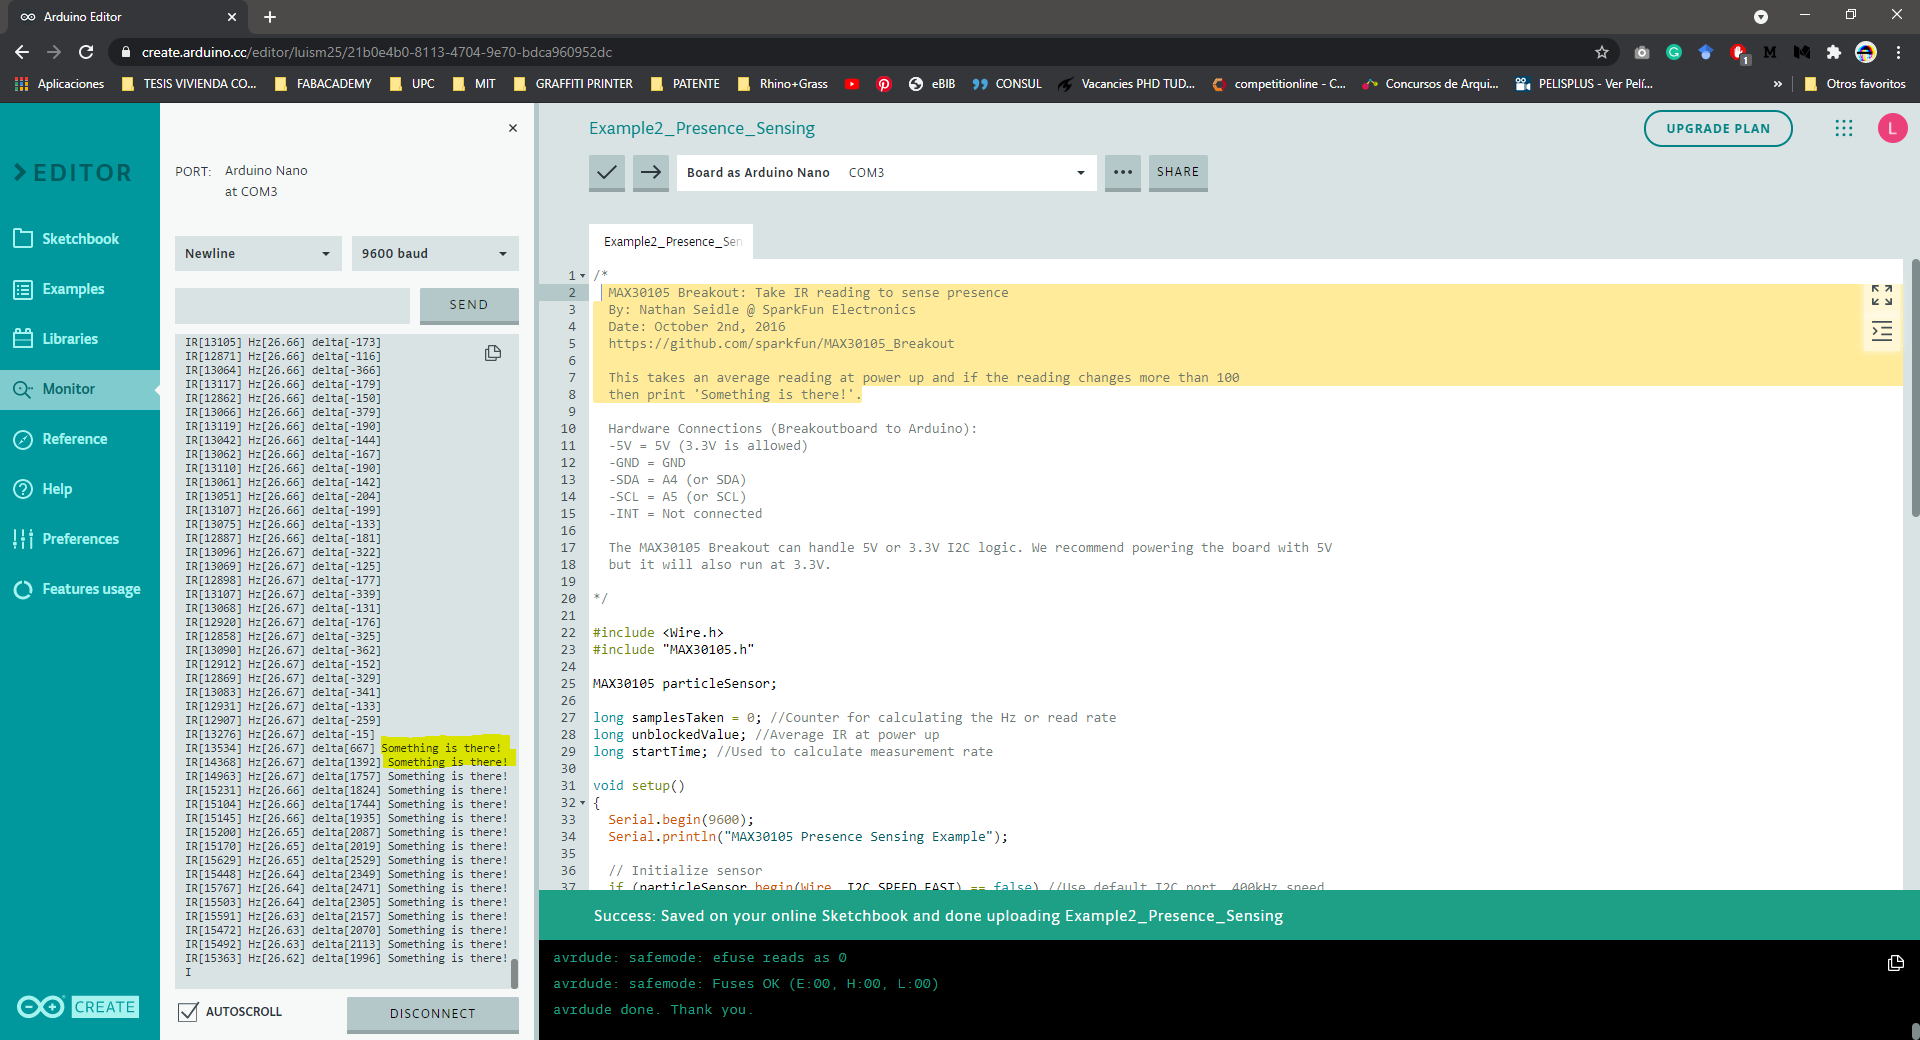
Example 2 is for presence sensing, this activates the IR to “see” if something is on or above the sensor, plotting the phrase “something is here”. It could detect up to 20cm directly above the device.
The most valuable examples for my project are:
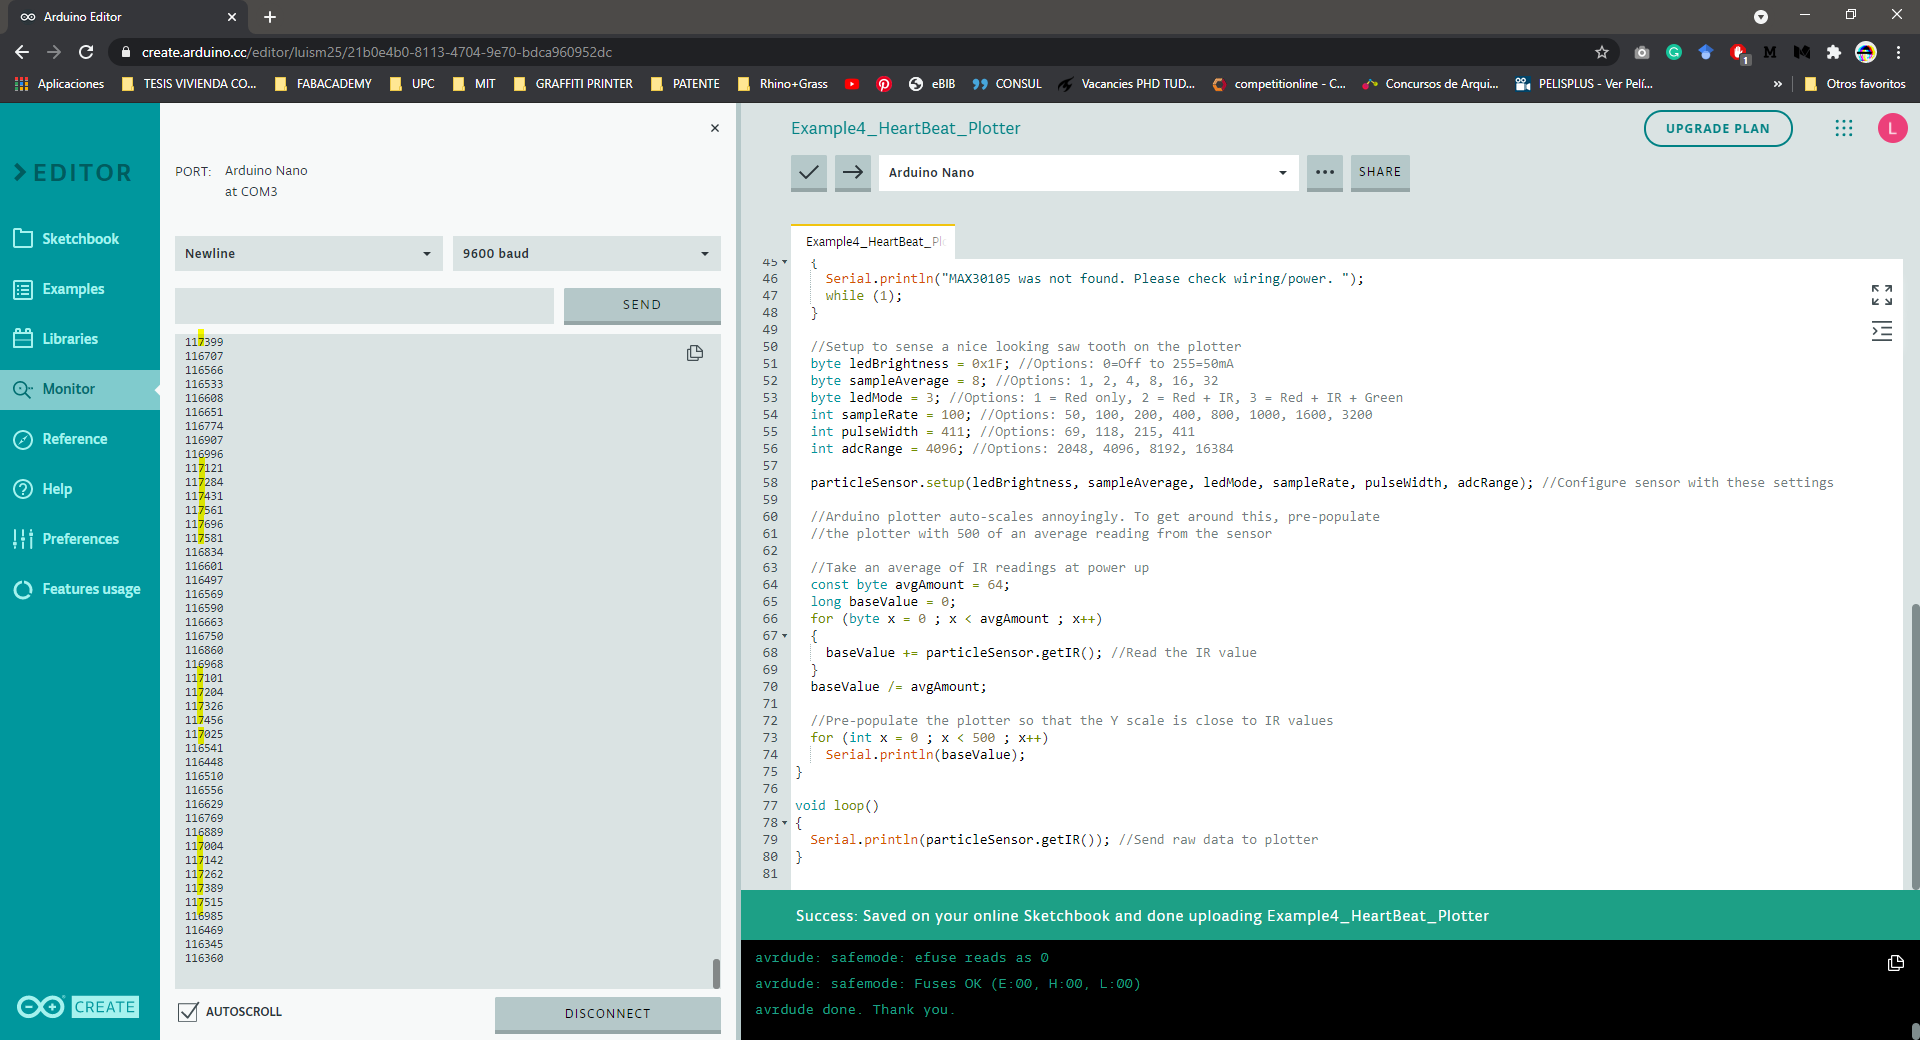
Example 4: Heart Beat Plotter
Shows the user’s heartbeat on Arduino’s serial plotter
Instructions: 1) Load code 2) Attach the sensor to your finger with a rubber band 3) Open Tools->Serial Plotter 4) Make sure the drop-down is set to 115200 baud 5) Check out the blips! 6) Feel the pulse on your neck and watch it mimic the blips
It is best to attach the sensor to your finger using a rubber band or other tightening device. Humans are generally bad at applying constant pressure to a thing. When you press your finger against the sensor it varies enough to cause the blood in your finger to flow differently which causes the sensor readings to go wonky.
Sadly, the Arduino web version does not have a serial plotter, and the monitor shows gibberish. I will install the Arduino IDE to check it.
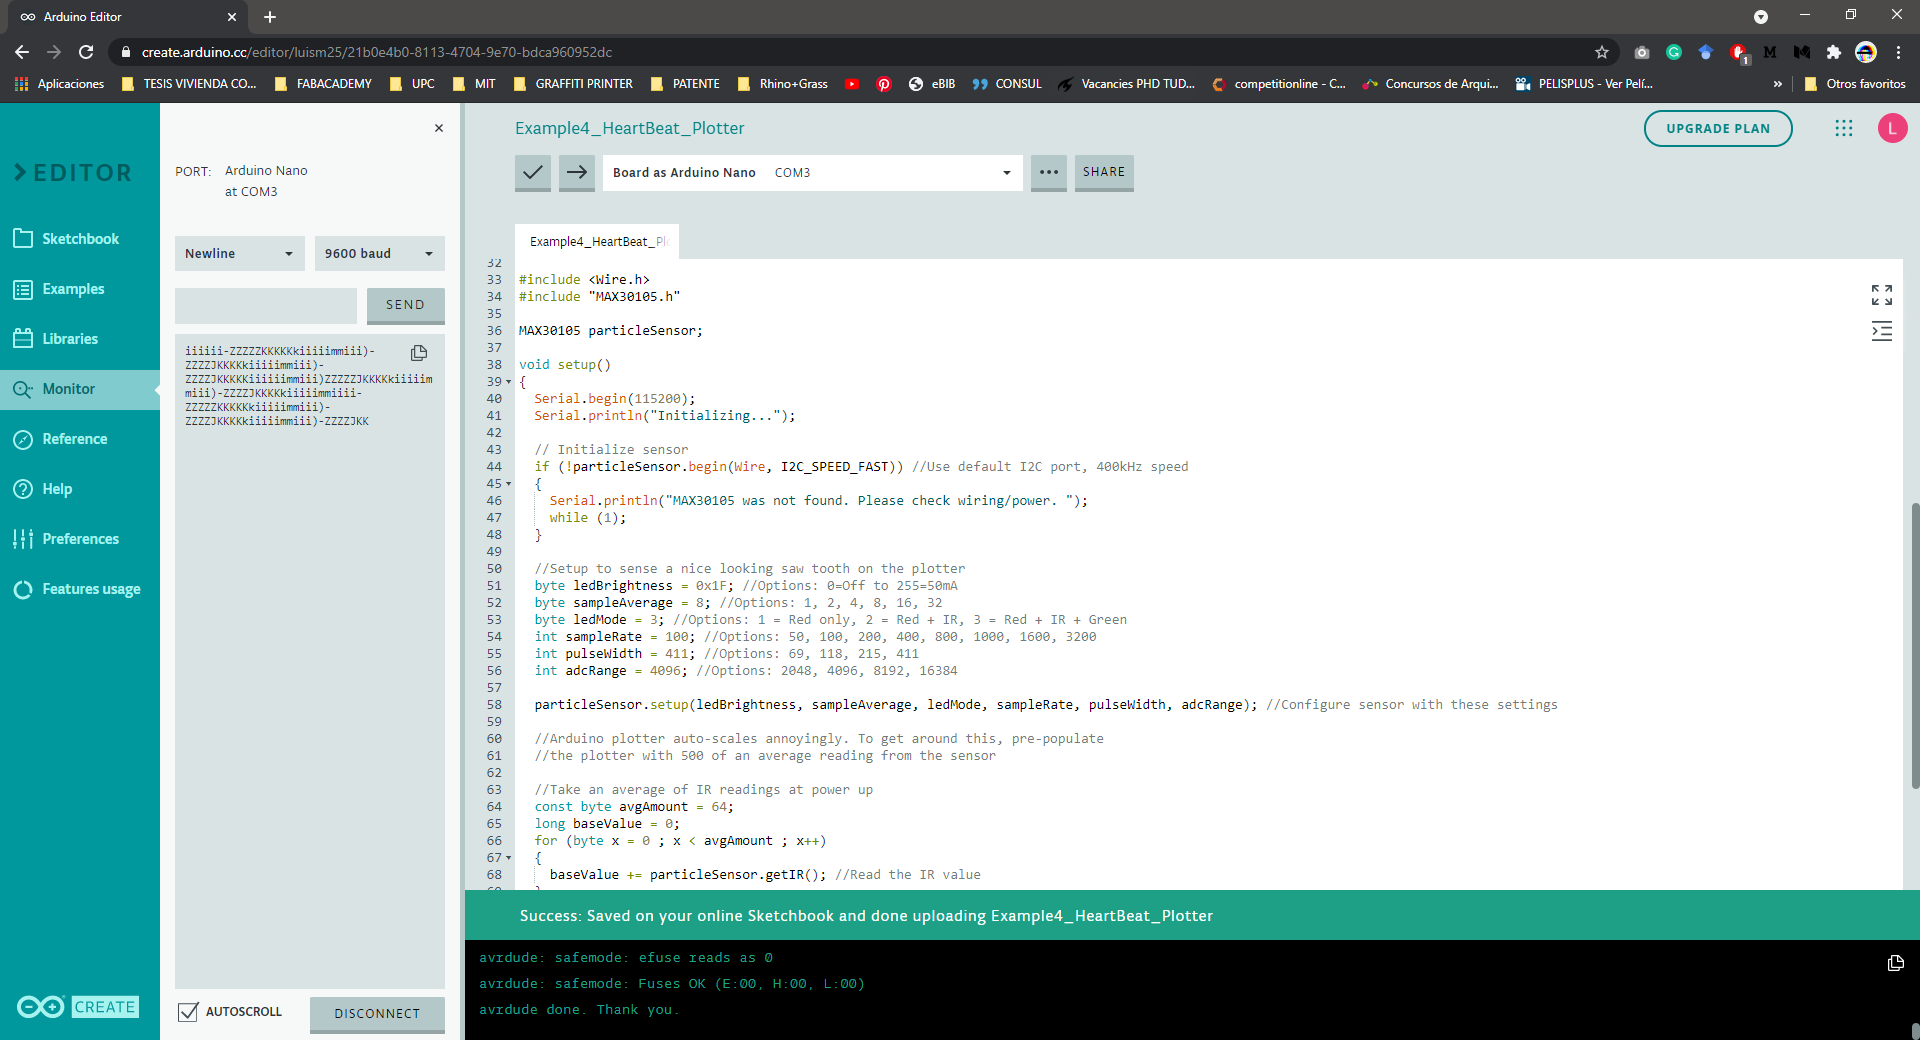
After changing the Serial.begin in this example too, I could get some reading in the serial monitor, which seems to have a certain pattern according to my pulse reading.
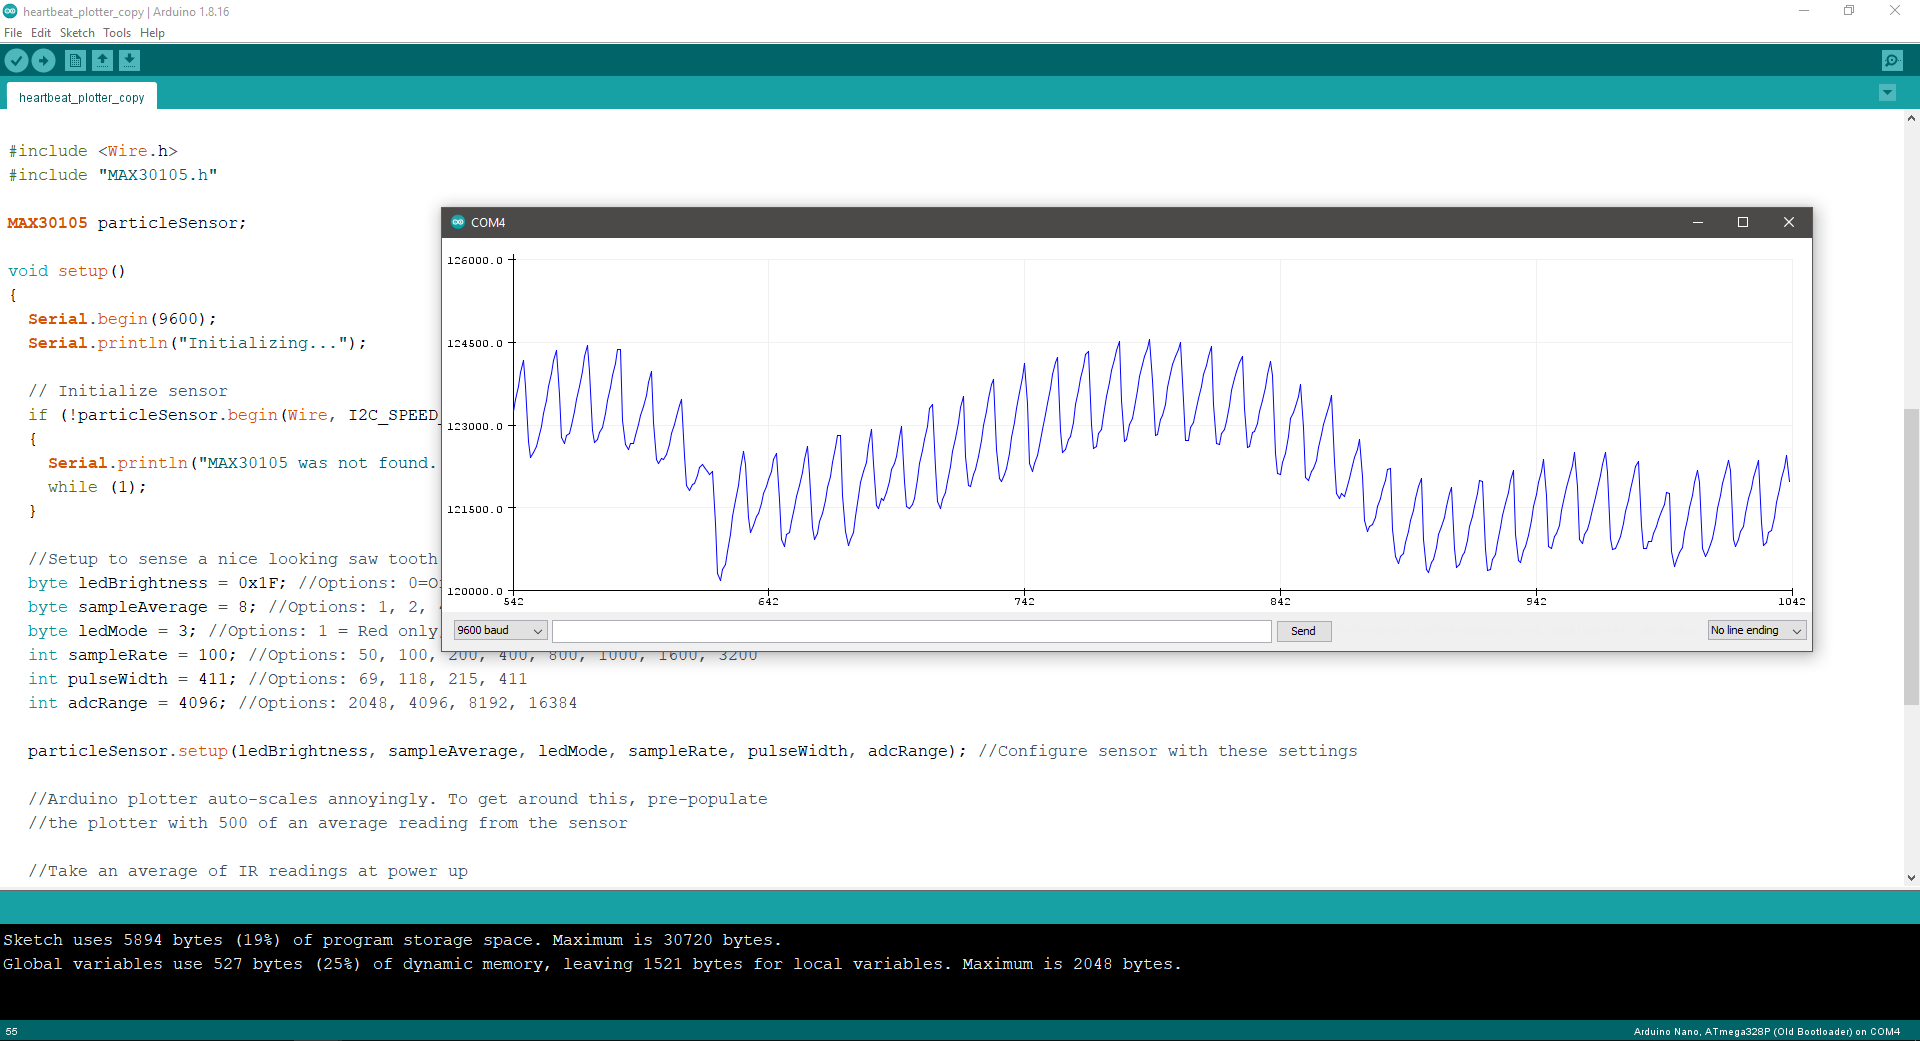
With Arduino IDE this is what the serial plotter shows
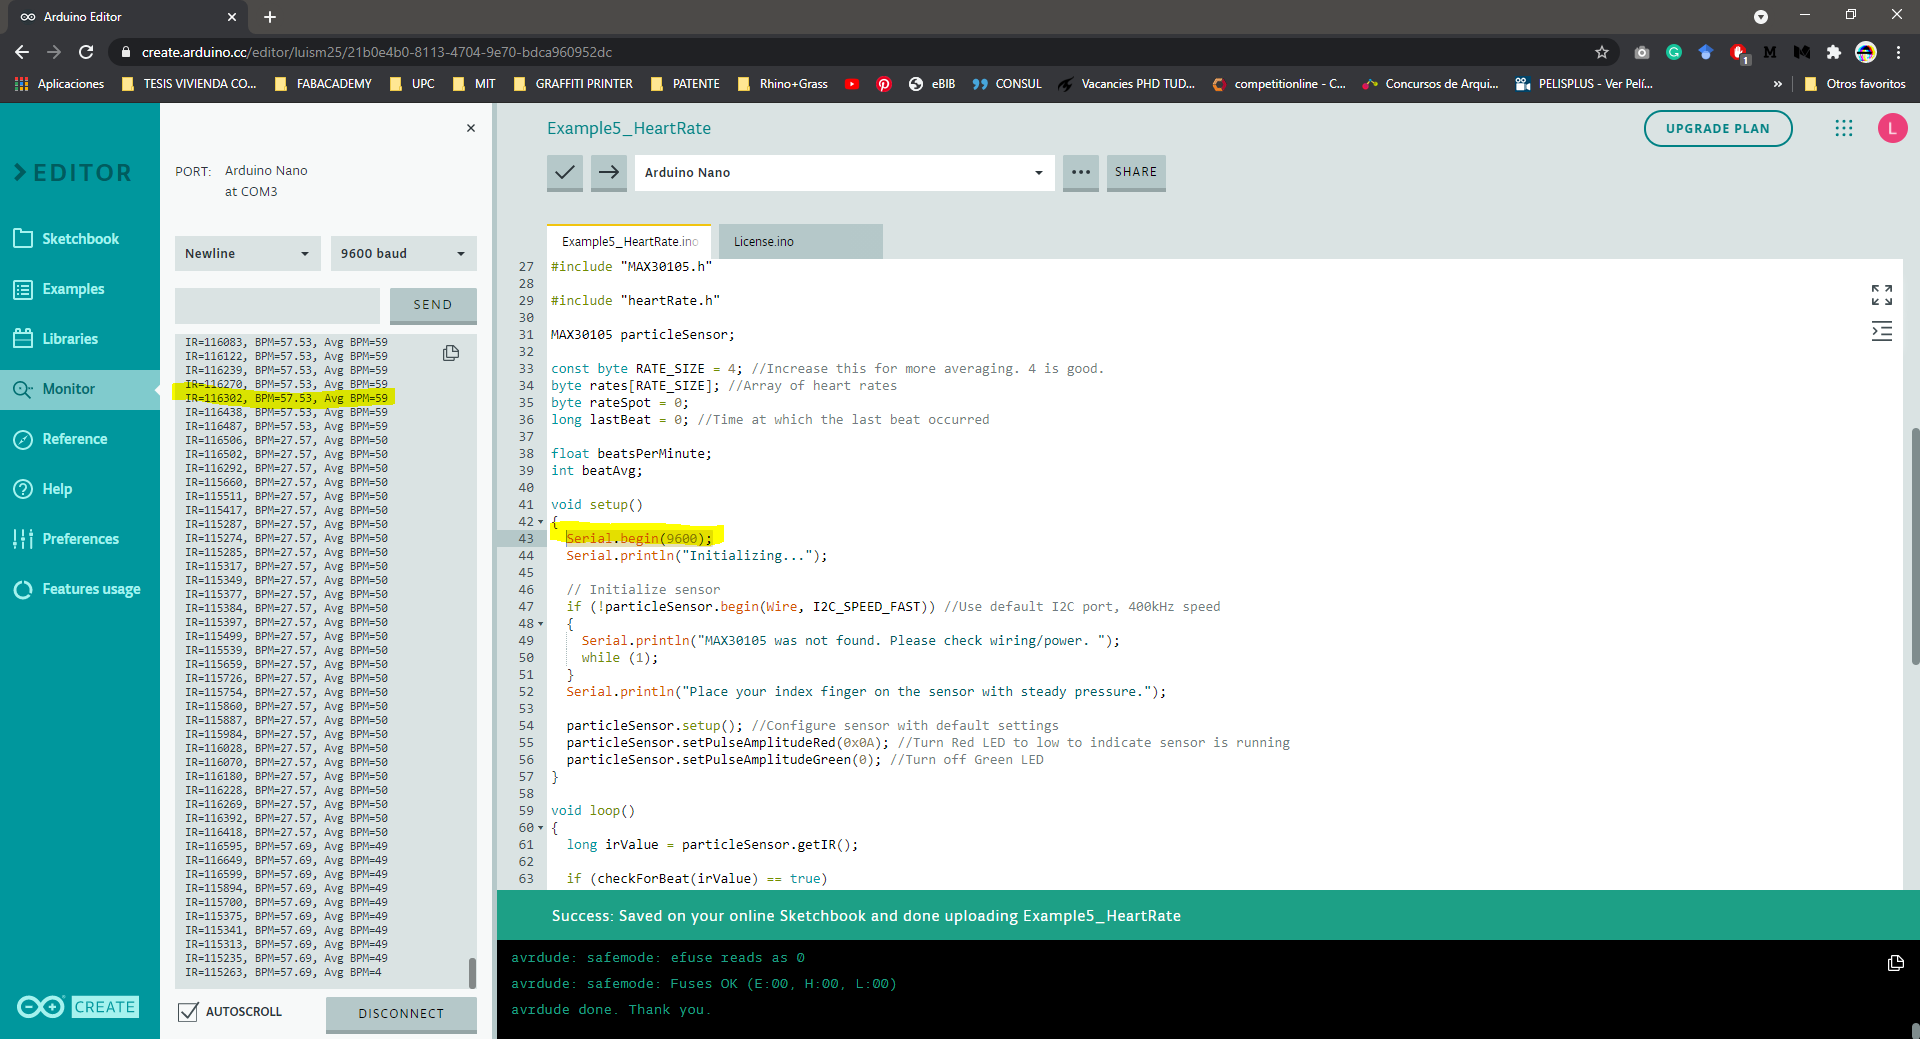
Example 5: Heart Rate (BPM)
This is a demo to show the reading of heart rate or beats per minute (BPM) using a Peripheral Beat Amplitude (PBA) algorithm.
Suddenly, something happened and I was getting no messages from the serial monitor.
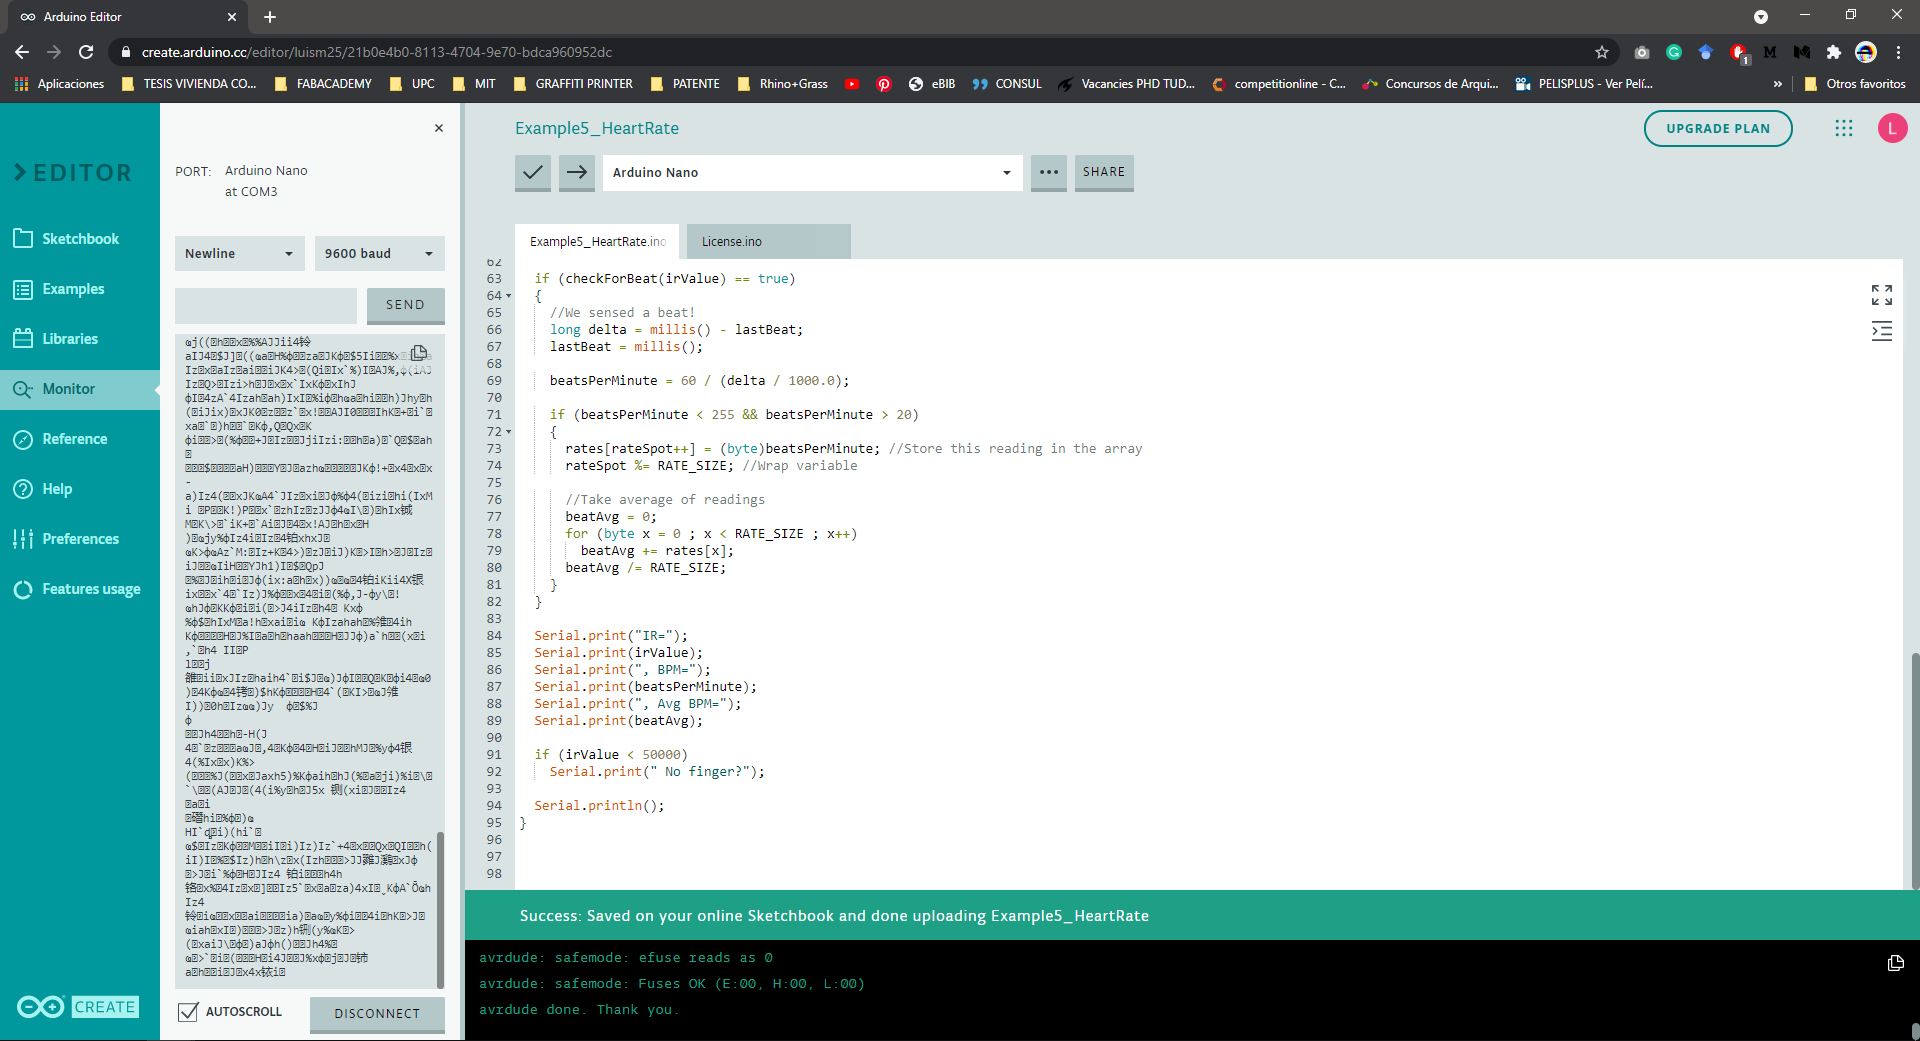
I changed the Serial.begin from 115200 to 9600 on the code, to match the serial monitor and it worked, now it displays the BPM and Average BPM when I place my finger on the sensor.
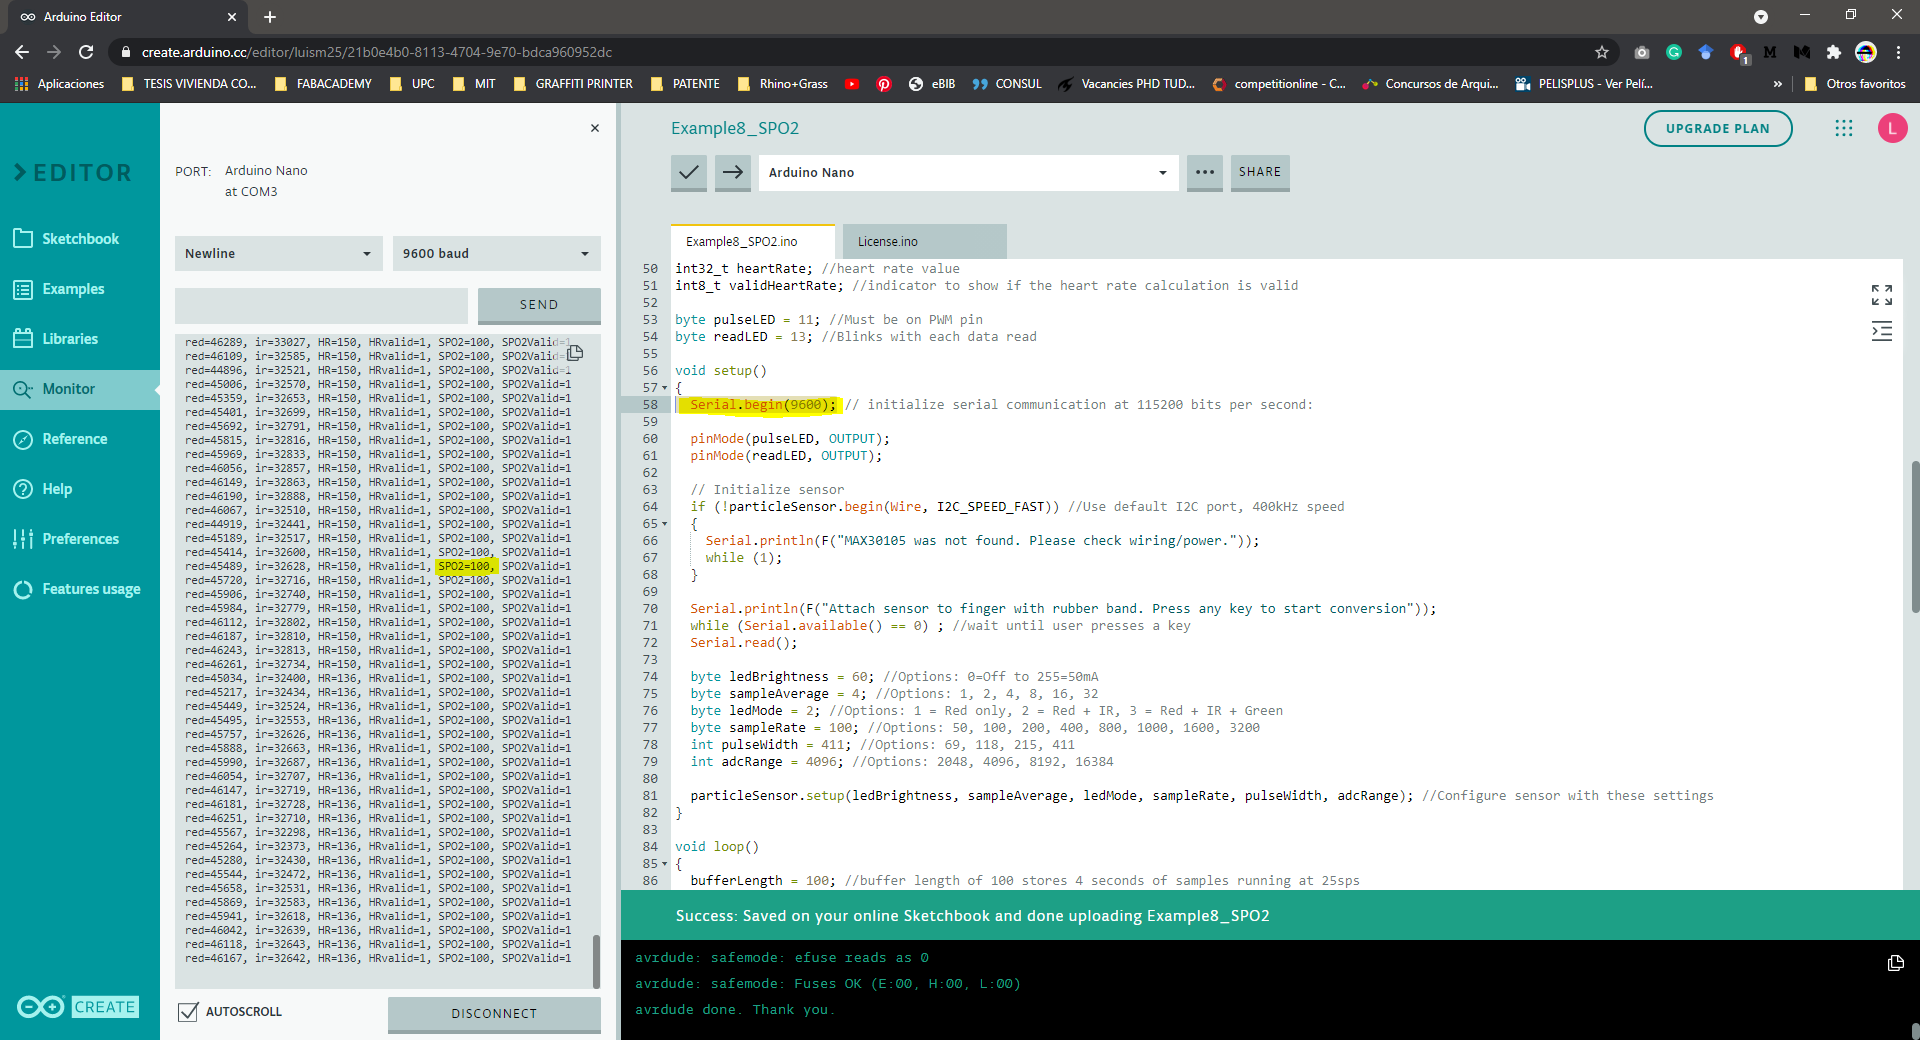
Example 8: SPO2 (oxygen saturation)
This demo shows heart rate and SPO2 levels. For this example I also changed the Serial.begin to work,
Connecting the MAX 30102 to the Octoduino
After testing the MAX 30102 readings with Arduino is time to test the input with the Octoduino board, this is the first prototype board for my final project, and it was presented in the Embedded programming week.
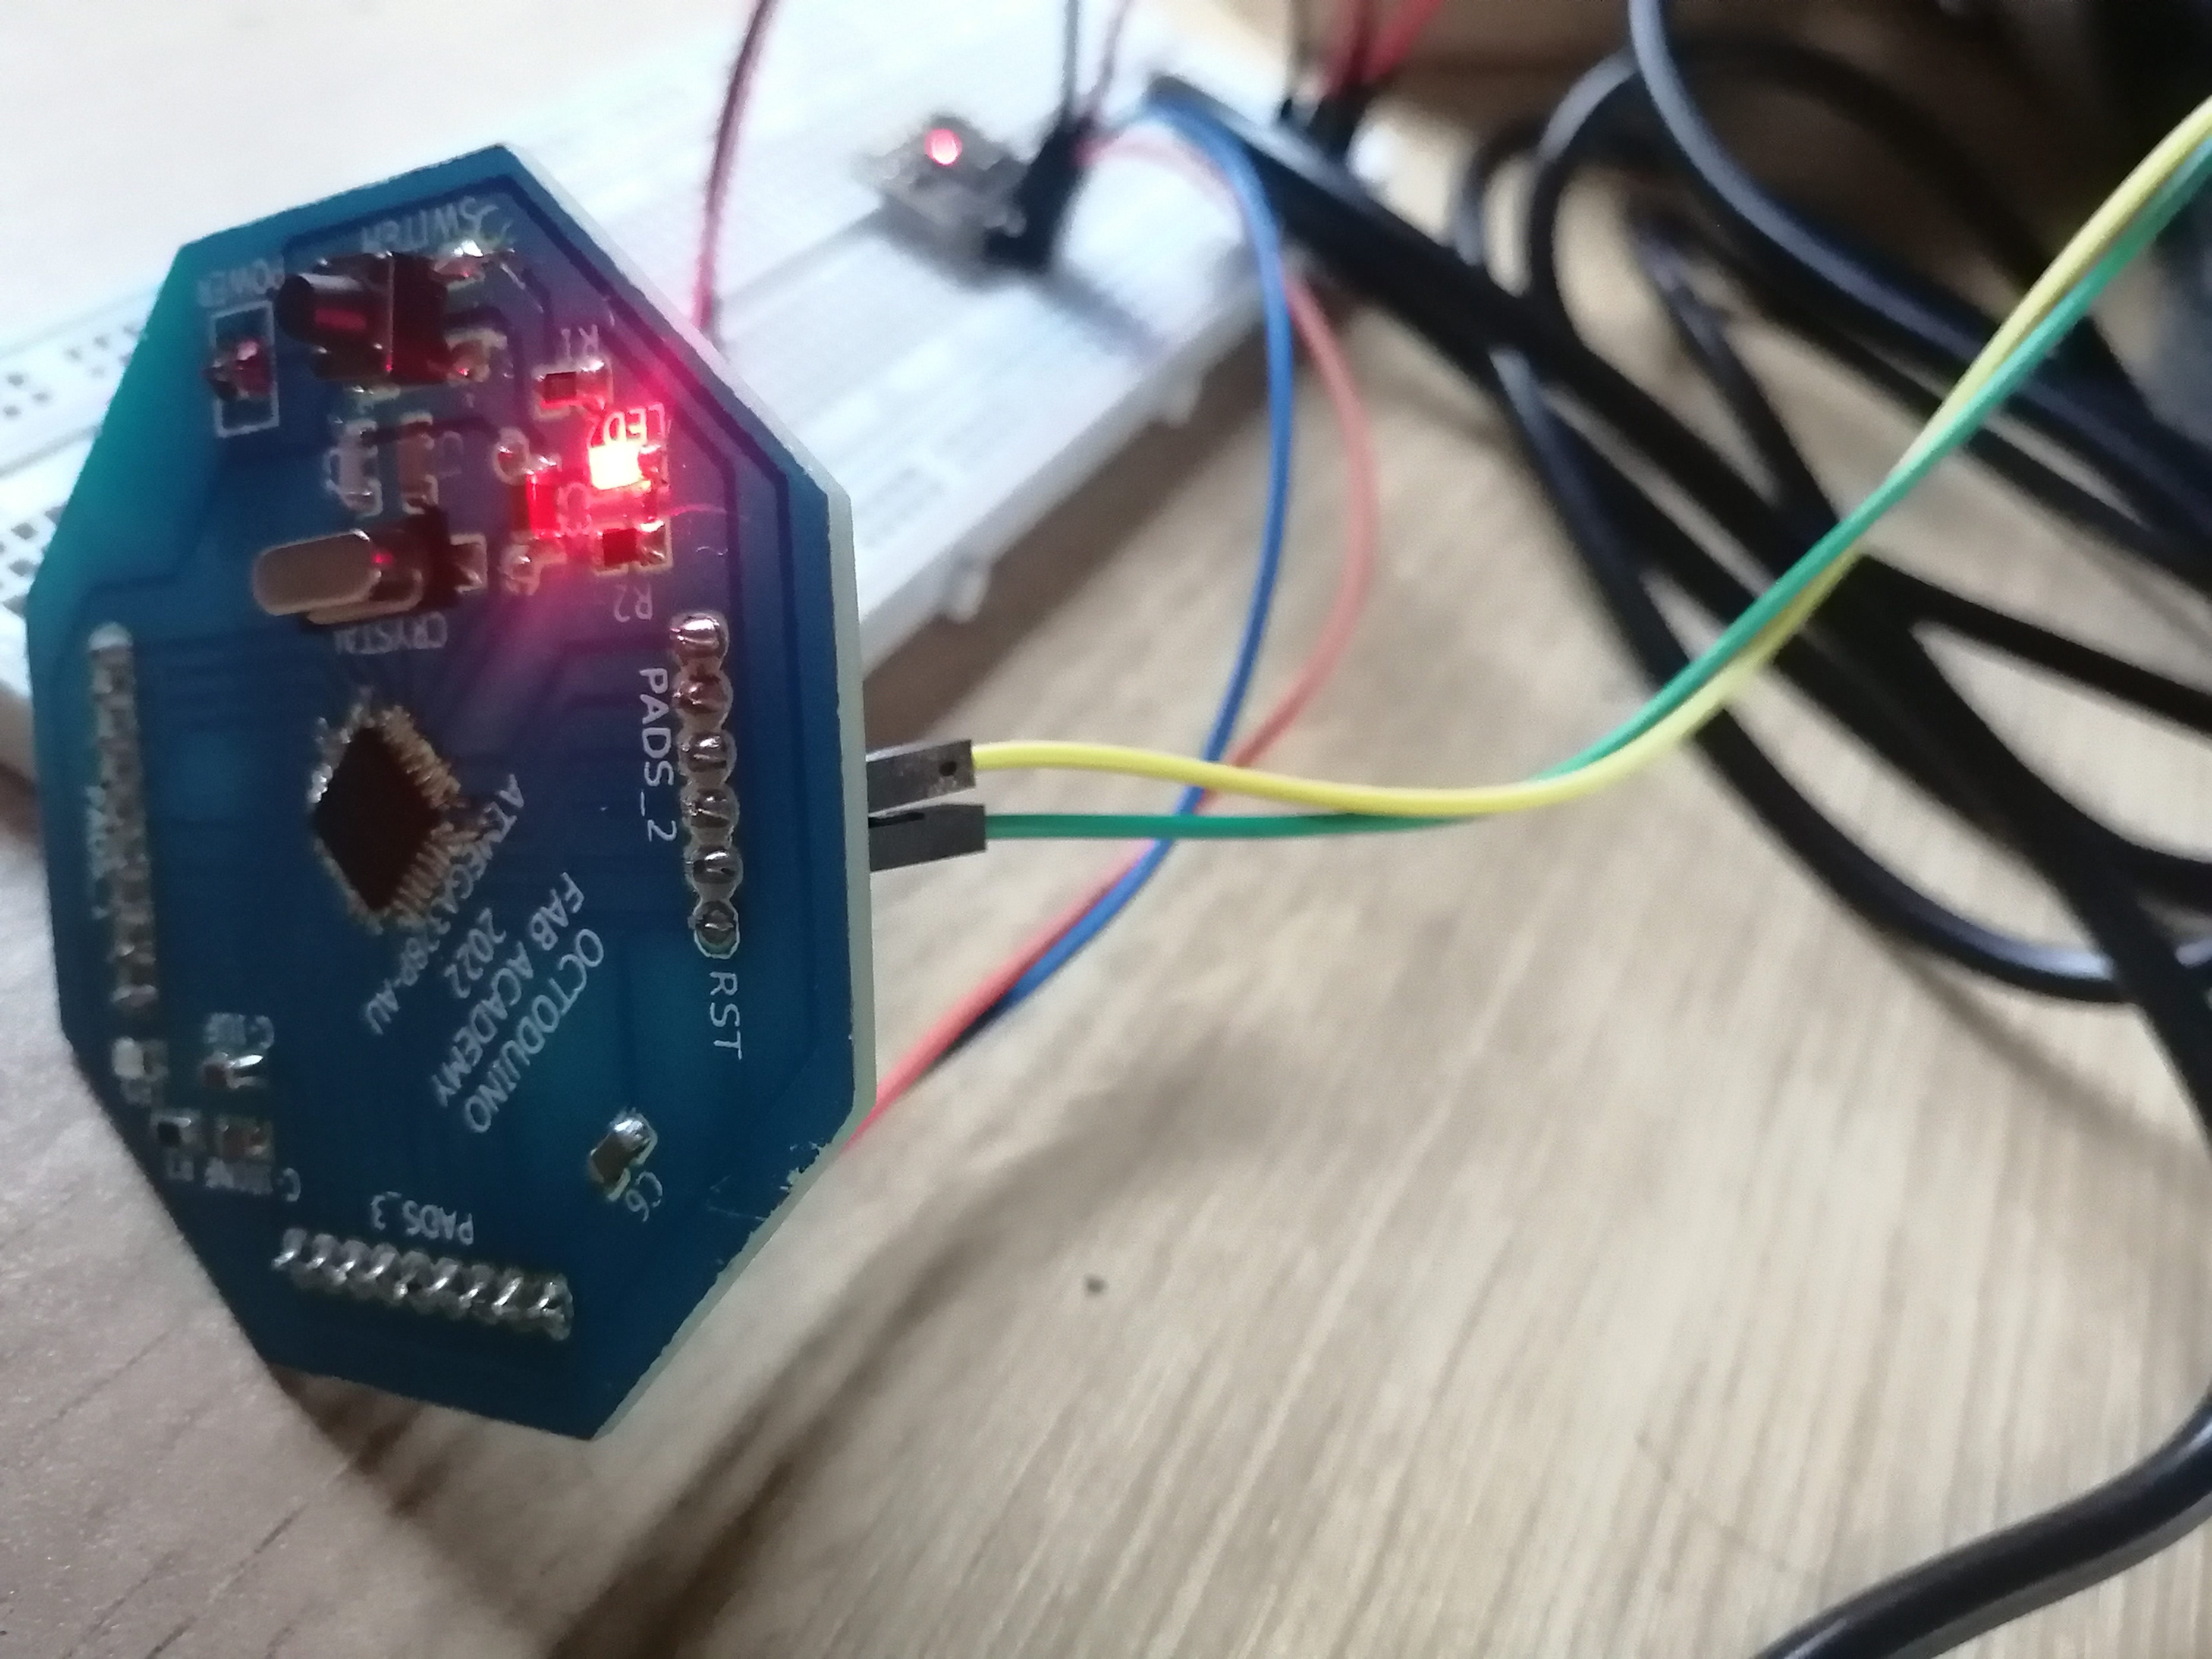
I decided to upload my modified version of the heartbeat plotter code, to upload the program I followed the same procedure explained in Embedded programming week. The upload had issues on the first try because of a loose USB connection to the FabISP, after fixing this the program uploaded fine.
After uploading I connected the pulse sensor to the Octoduino following the original Arduino pins A4 and A5 that correspond to pins 27 and 28 in the Octoduino (check the pinout here).
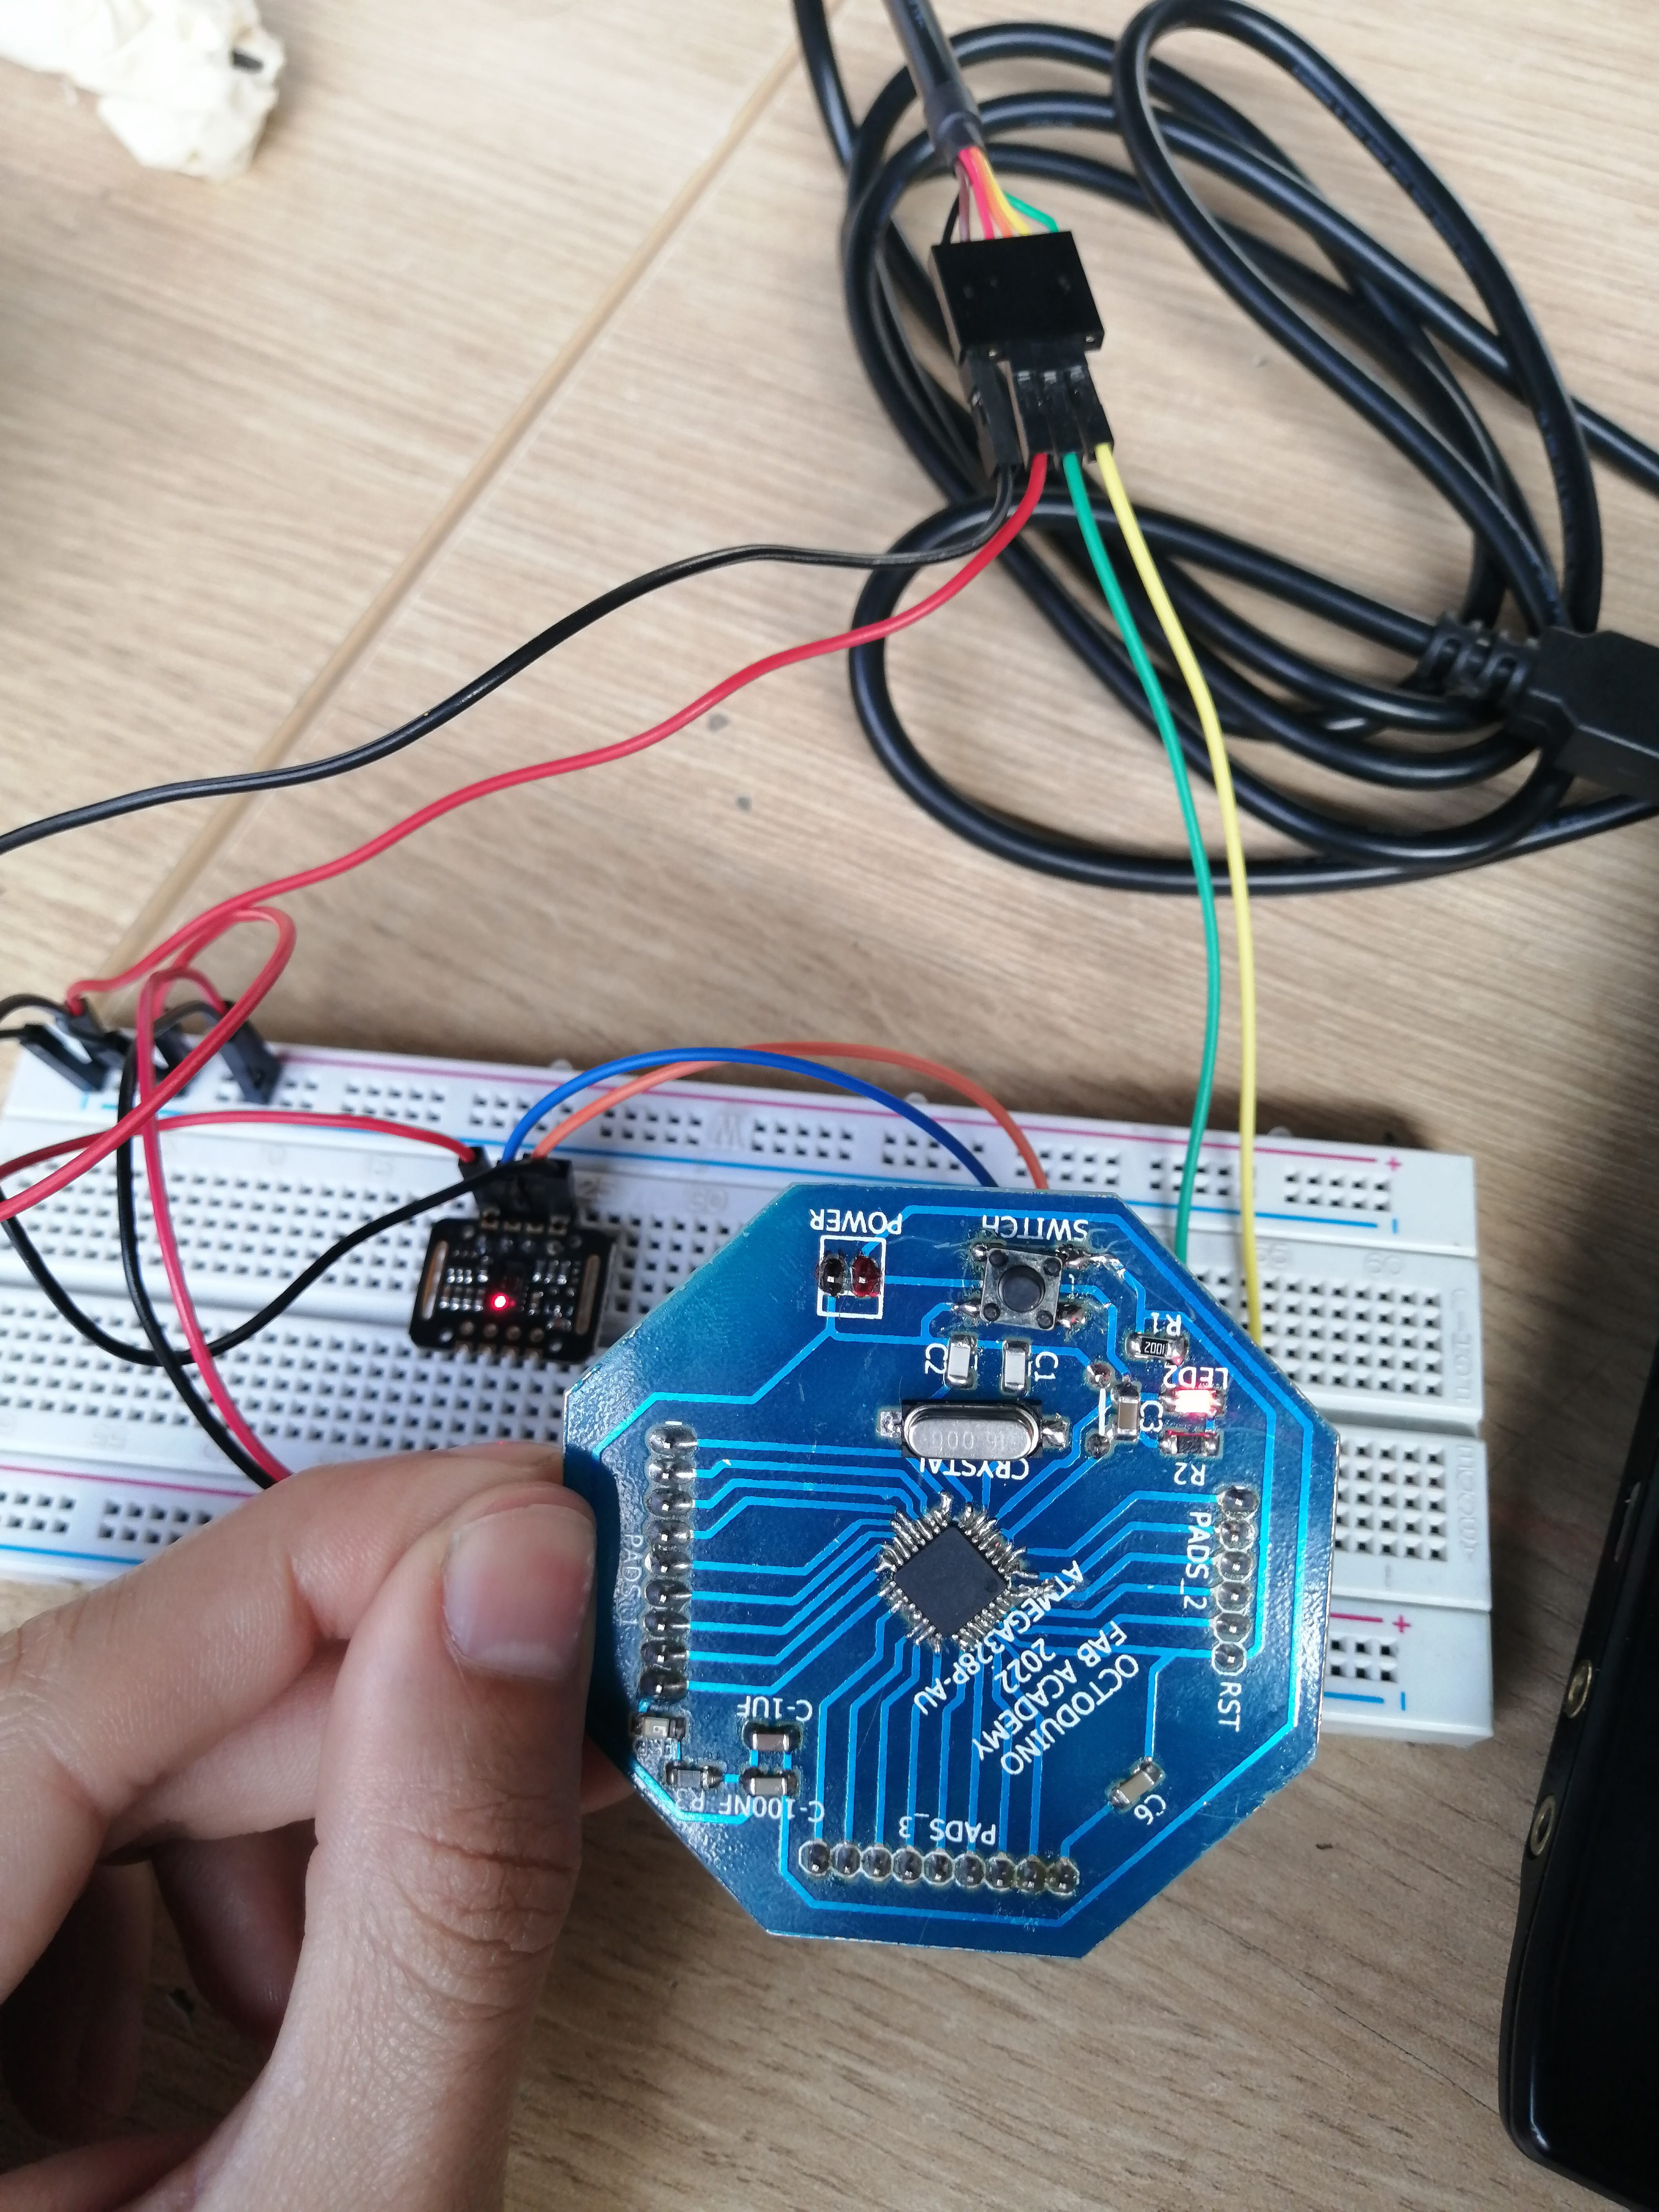
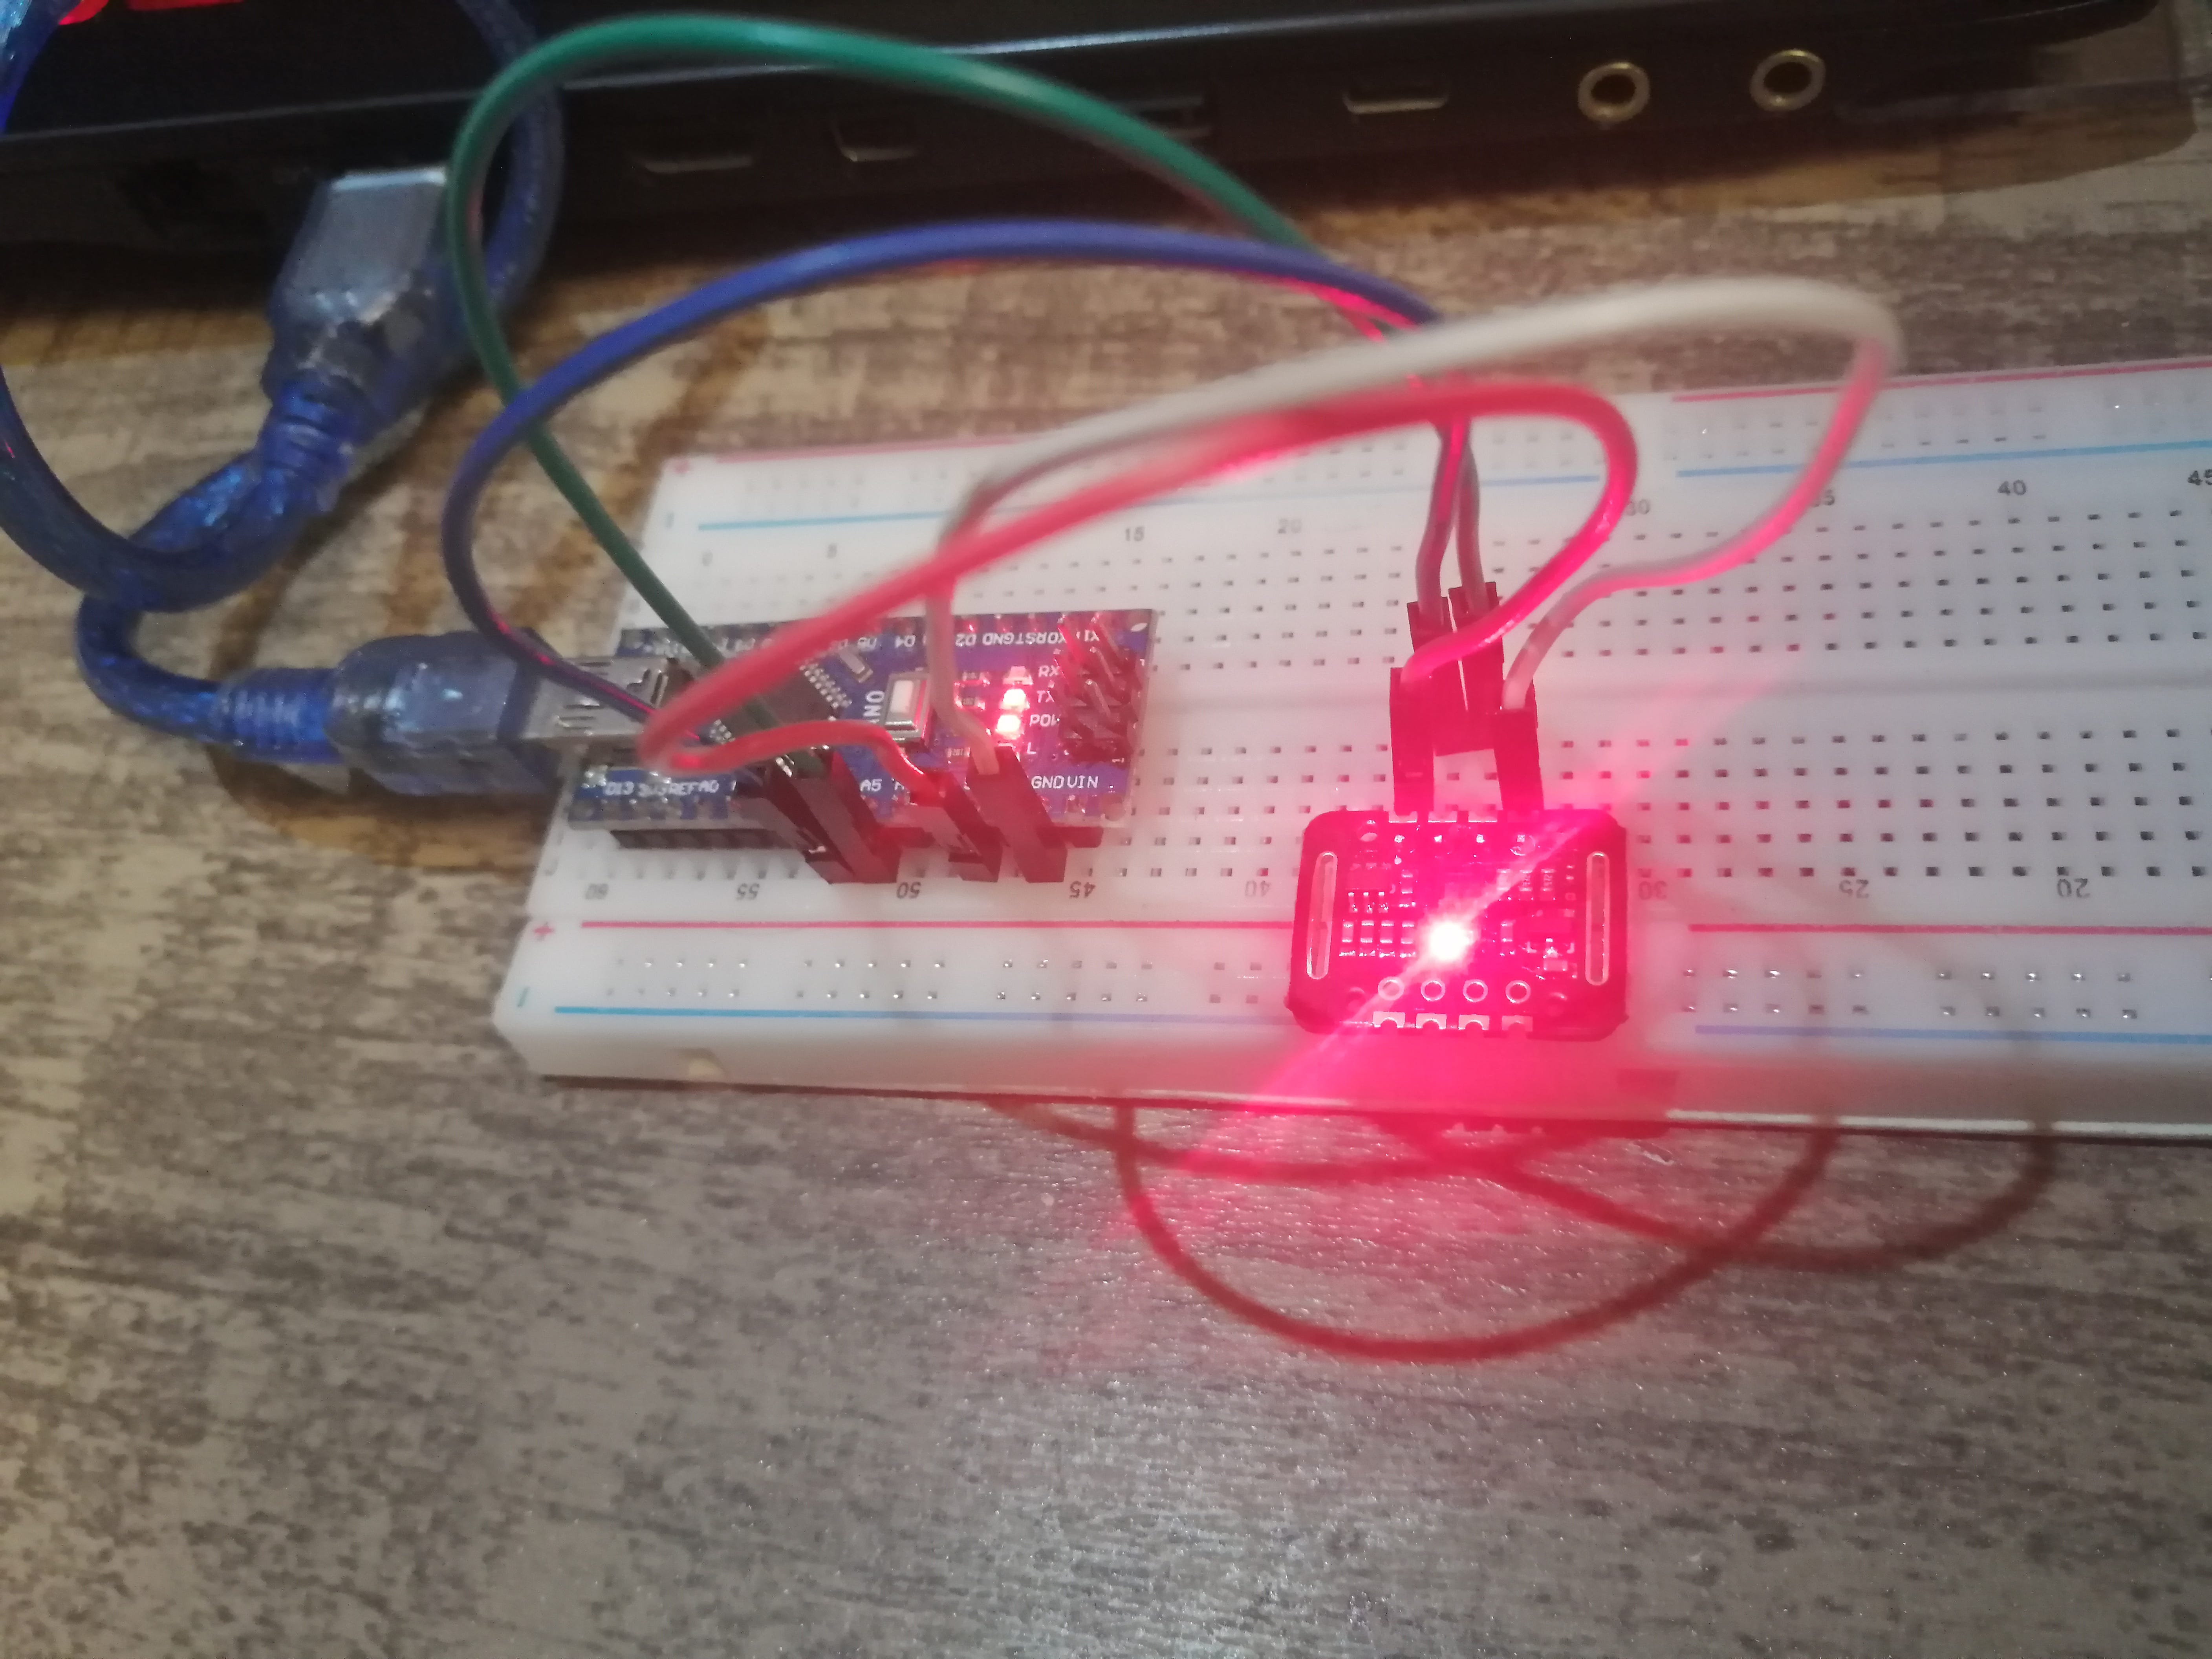
At first, the pulse sensor was unresponsive (the LED was off) but after pressing the Reset button on the board the code finally ran and it worked.
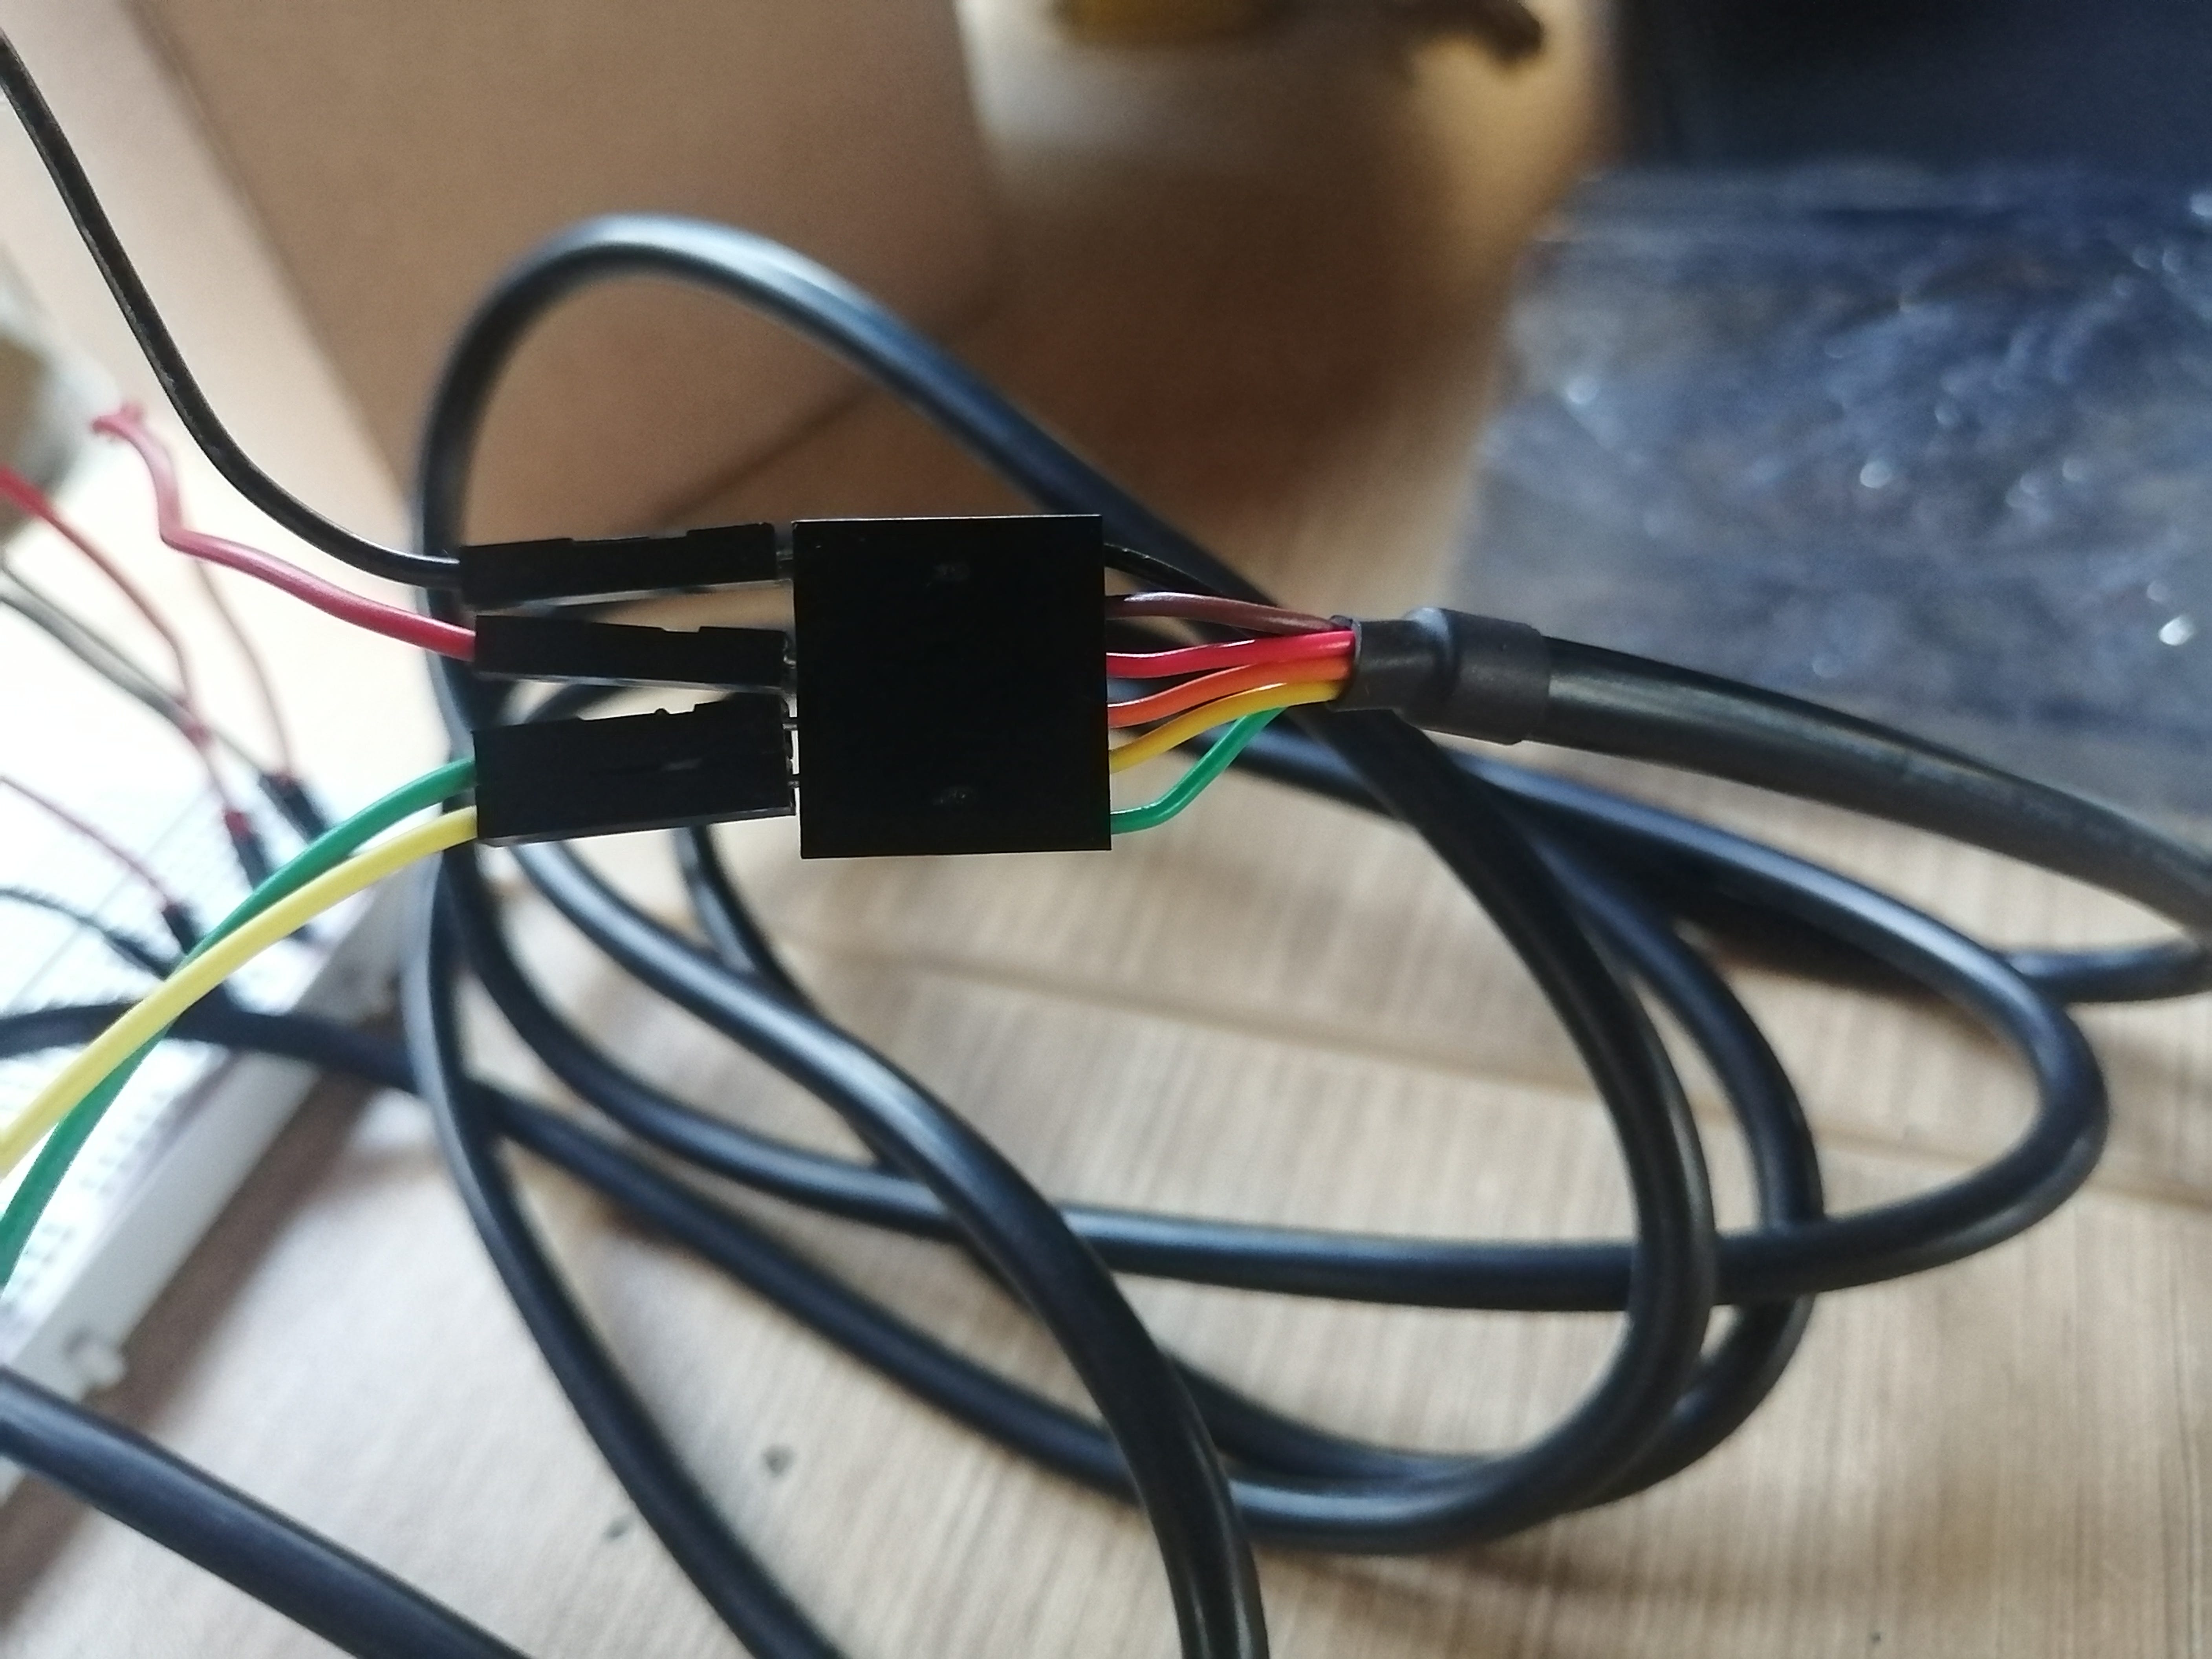
As this Sketch uses the serial plotter to show the pulse readings it is important that the RXD and TXD pins are connected to the FTDI cable to send the readings to the Arduino IDE. It is also important to check the correct, COM port and the corresponding baud rate in the code and in the monitor to show the correct readings.
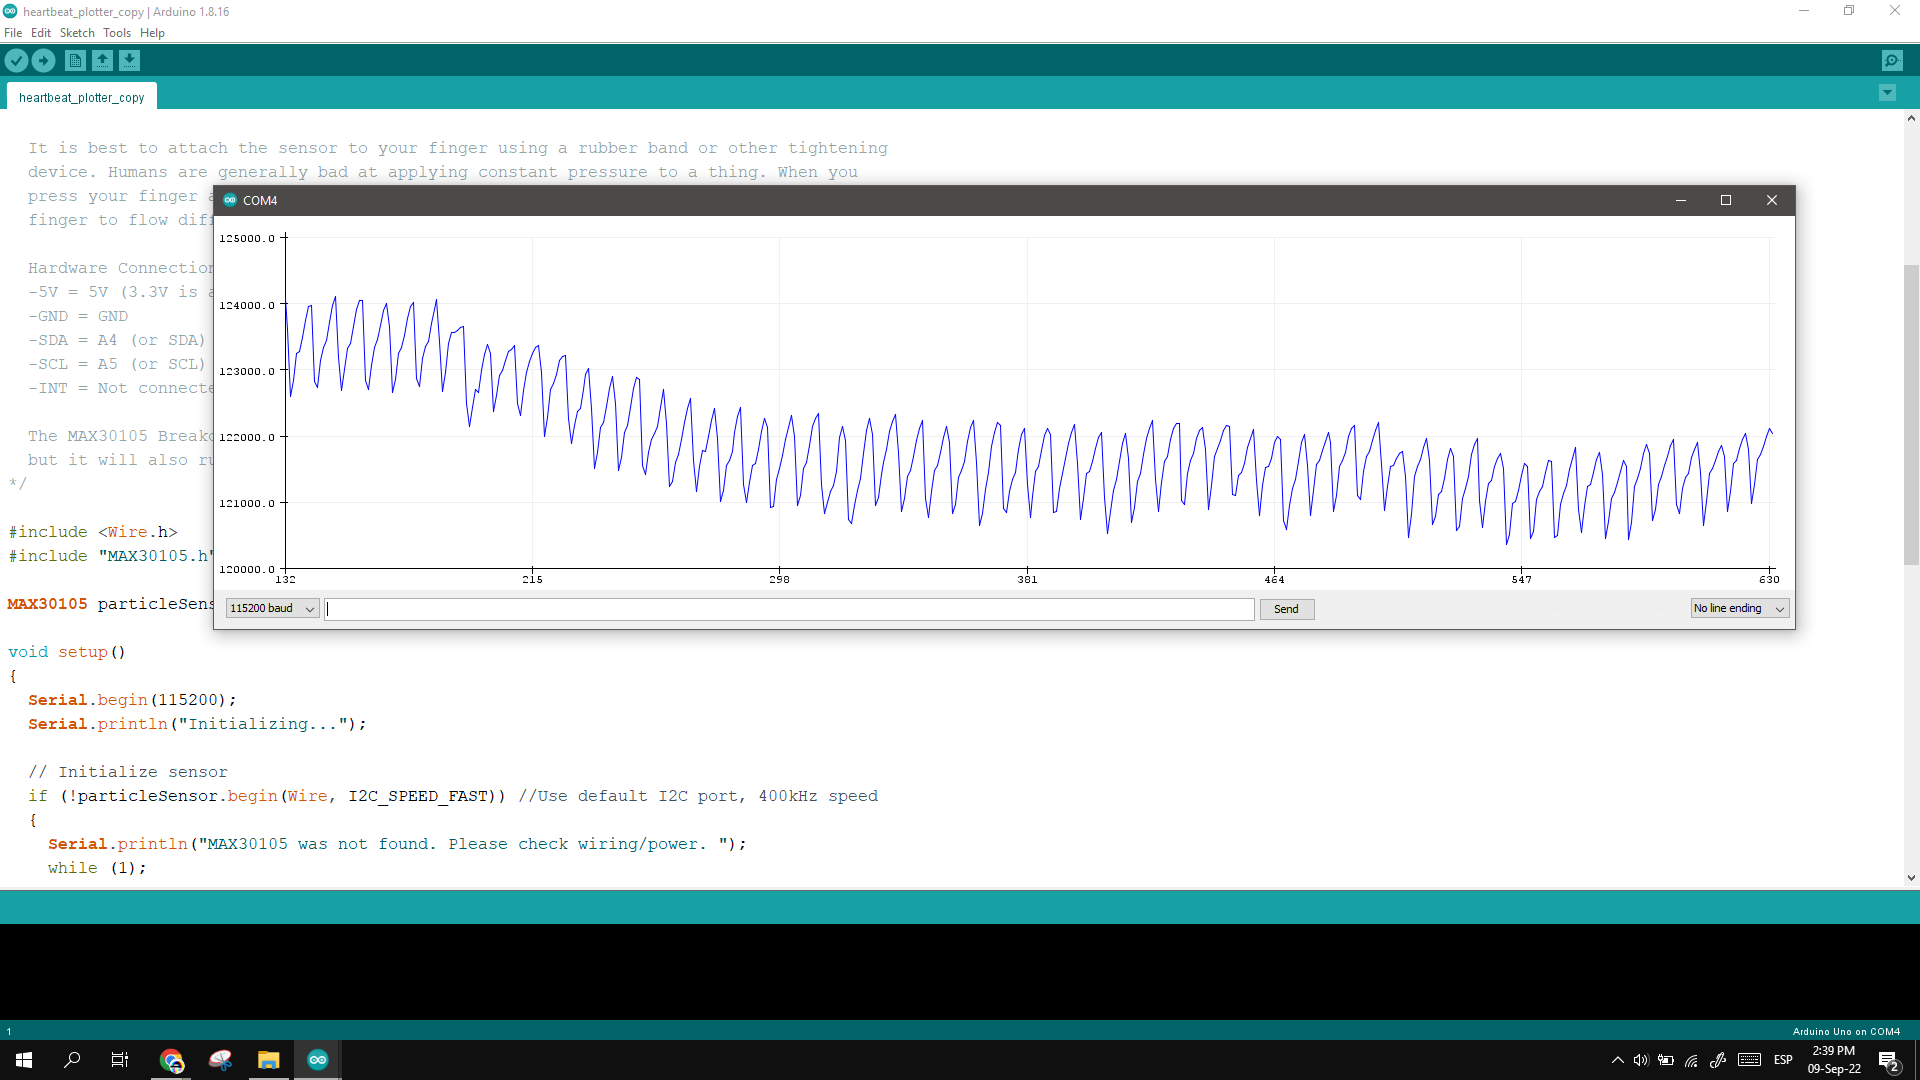
This is the view from the Arduino serial plotter with my finger on the sensor, the peaks in the reading represent my pulse in real-time. here's a very nice possibility of making an animation for the interface programming week.
I noticed that the sensor is very sensitive to pressure or even position, as not touching but moving the finger over the sensor triggers signals. Here is shown on the left when the finger is placed (the same graphic as above only zoomed out) the down peak is when I took the finger out of the sensor and the final line at the bottom represents no finger on or near the sensor.
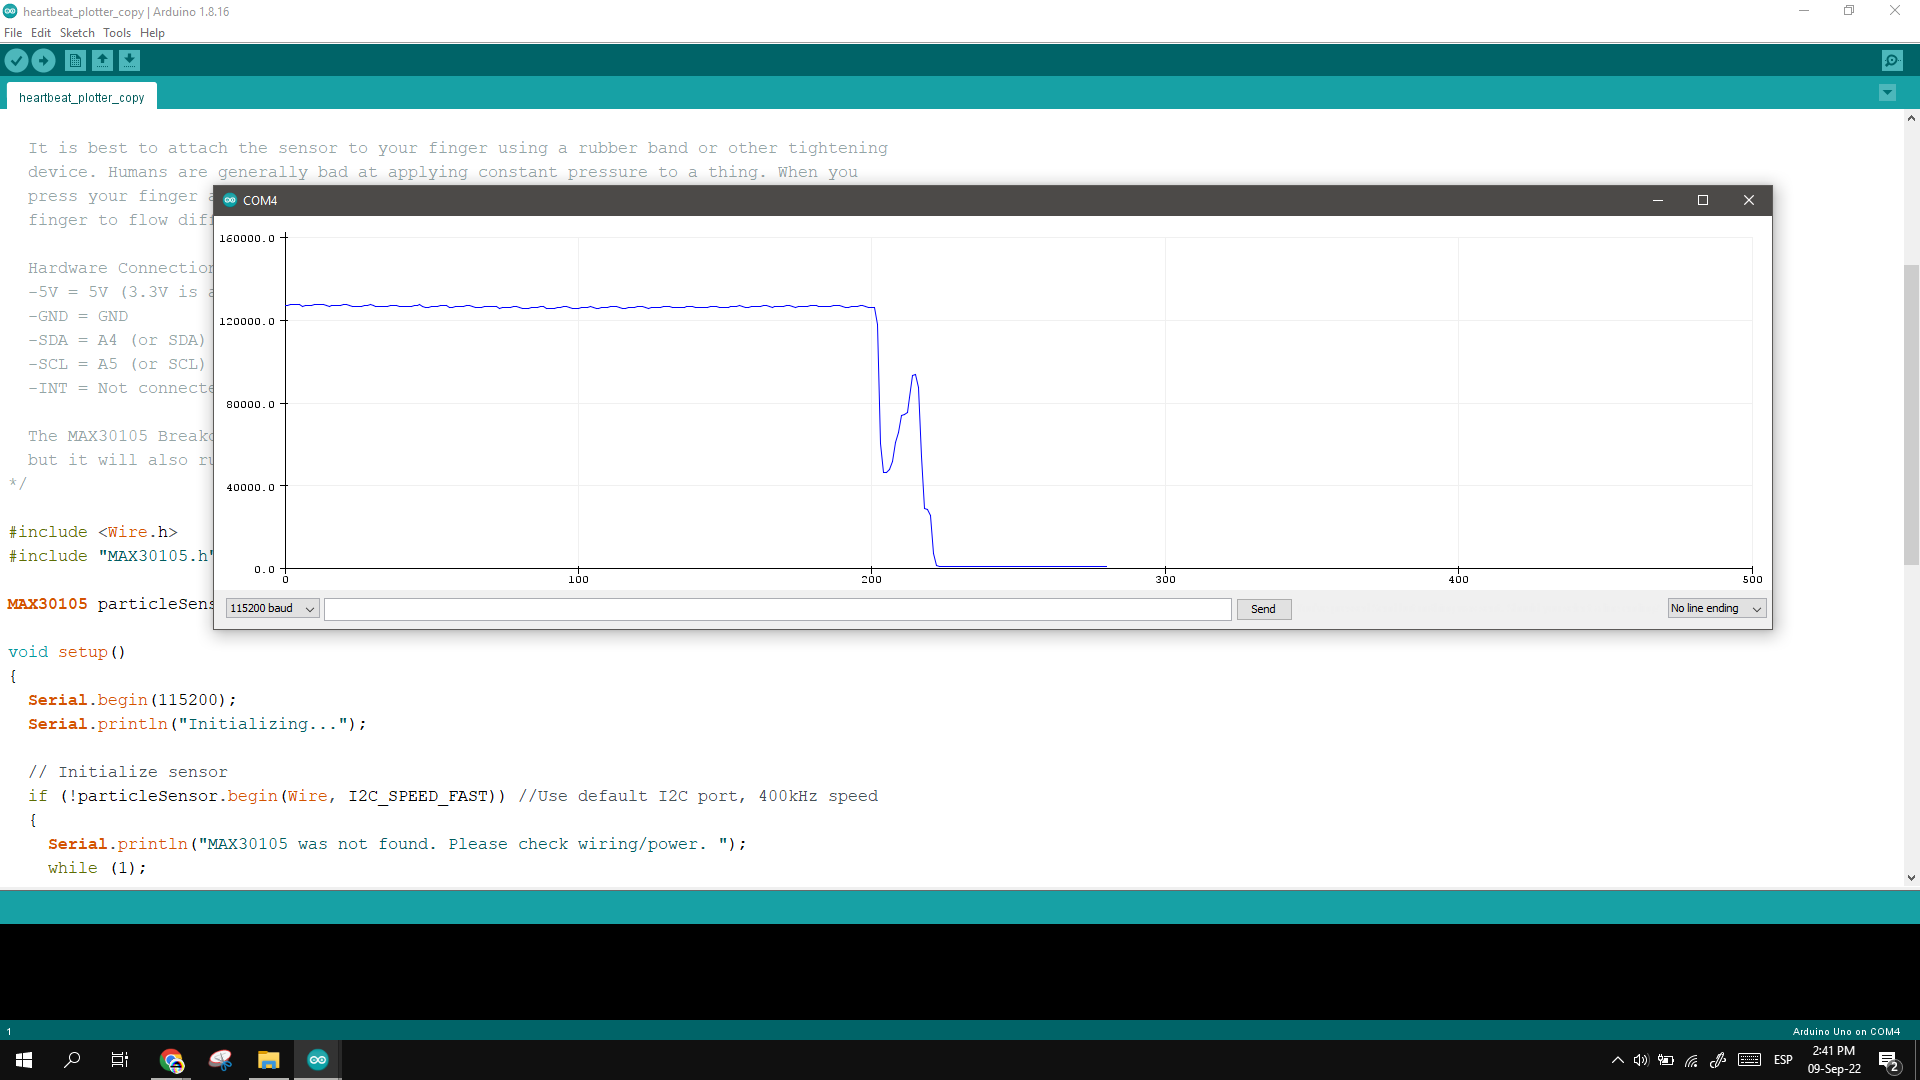
Is important to notice that some fingers get better readings, in my case, it works best placing my middle fingers under slight pressure.
Here’s the final code applied:
/*
  Heart beat plotting!
  By: Nathan Seidle @ SparkFun Electronics
  Date: October 20th, 2016
  [https://github.com/sparkfun/MAX30105_Breakout](https://github.com/sparkfun/MAX30105_Breakout)

Shows the user's heart beat on Arduino's serial plotter

It is best to attach the sensor to your finger using a rubber band or other tightening
  device. Humans are generally bad at applying constant pressure to a thing. When you
  press your finger against the sensor it varies enough to cause the blood in your
  finger to flow differently which causes the sensor readings to go wonky.

Hardware Connections (Breakoutboard to Arduino):
  -5V = 5V (3.3V is allowed)
  -GND = GND
  -SDA = A4 (or SDA)
  -SCL = A5 (or SCL)
  -INT = Not connected

The MAX30105 Breakout can handle 5V or 3.3V I2C logic. We recommend powering the board with 5V
  but it will also run at 3.3V.
*/

#include <Wire.h>
#include "MAX30105.h"

MAX30105 particleSensor;

void setup()
{
  Serial.begin(115200);
  Serial.println("Initializing...");

// Initialize sensor
  if (!particleSensor.begin(Wire, I2C_SPEED_FAST)) //Use default I2C port, 400kHz speed
  {
    Serial.println("MAX30105 was not found. Please check wiring/power. ");
    while (1);
  }

//Setup to sense a nice looking saw tooth on the plotter
  byte ledBrightness = 0x1F; //Options: 0=Off to 255=50mA
  byte sampleAverage = 8; //Options: 1, 2, 4, 8, 16, 32
  byte ledMode = 3; //Options: 1 = Red only, 2 = Red + IR, 3 = Red + IR + Green
  int sampleRate = 100; //Options: 50, 100, 200, 400, 800, 1000, 1600, 3200
  int pulseWidth = 411; //Options: 69, 118, 215, 411
  int adcRange = 4096; //Options: 2048, 4096, 8192, 16384

particleSensor.setup(ledBrightness, sampleAverage, ledMode, sampleRate, pulseWidth, adcRange); //Configure sensor with these settings

//Arduino plotter auto-scales annoyingly. To get around this, pre-populate
  //the plotter with 500 of an average reading from the sensor

//Take an average of IR readings at power up
  const byte avgAmount = 64;
  long baseValue = 0;
  for (byte x = 0 ; x < avgAmount ; x++)
  {
    baseValue += particleSensor.getIR(); //Read the IR value
  }
  baseValue /= avgAmount;

//Pre-populate the plotter so that the Y scale is close to IR values
  for (int x = 0 ; x < 500 ; x++)
    Serial.println(baseValue);
}

void loop()
{
  Serial.println(particleSensor.getIR()); //Send raw data to plotter
}
Here is the pulse reading video, the Arduino plotter takes a long time to show the reading at scale.
Electronic boards
Download the Octoduino Board used in this assignment.
Group Assignment
For the group assignment we need to:
- Probe an input device(s)’s analog and digital signals.
- Document your work to the group work page and reflect on your individual page what you learned.
The group test of input devices are documented in my classmate's FabAcademy page Lesly Ramirez
This covers:
- Test of digital signals using a limit switch.
- Test of analog signal using a potentiometer and measuring with arduino and a osciloscope.