Week 16.Interface and Application Programming
Individual assignment:
write an application that interfaces a user with an
input &/or output device that you made
Group assignment:
compare as many tool options as possible
Group work:
For this week, we all started with the group task together. Some of us used Processing, Blynk, PyQt5 and others used the Python or Matlab
Blynk
Blynk was designed for the Internet of Things. It can control hardware remotely, it can display sensor data, it can store data, vizualize it and do many other cool things. Blynk supports hardware platforms such as Arduino, Raspberry Pi, and similar microcontroller boards to build hardware for your projects. Blink can support the following Ethernet, Wi-Fi, Bluetooth, Cellular and Serial connection types:
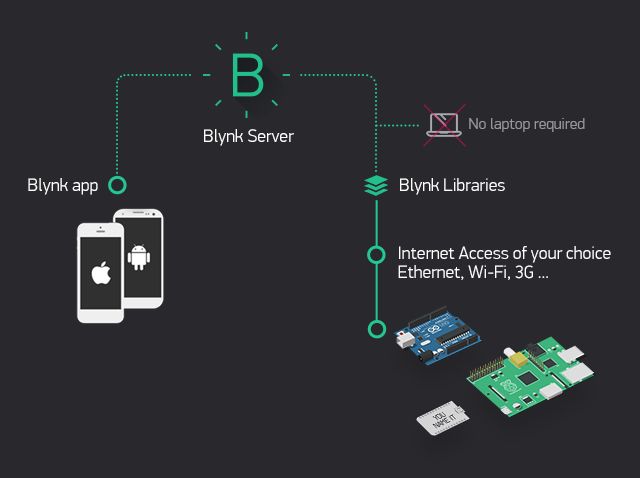
- There are three major components in the platform:
- Blynk App: allows to you create amazing interfaces for your projects using various widgets we provide..
- Blynk Server: responsible for all the communications between the smartphone and hardware. You can use the Blynk Cloud or run your private Blynk server locally. It’s open-source, could easily handle thousands of devices and can even be launched on a Raspberry Pi.
- Blynk Libraries: for all the popular hardware platforms - enable communication with the server and process all the incoming and outcoming commands
- Hello world with Blynk from the microcontroller to Phones Blynk app monitor looks like this:
BLYNK_LOG1("Hello World"); // Print a string
PyQt5
PyQt is a GUI widgets toolkit. It is a Python interface for Qt, one of the most powerful, and popular cross-platform GUI library. PyQt is a blend of Python programming language and the Qt library.Qt is set of cross-platform C++ libraries that implement high-level APIs for accessing many aspects of modern desktop and mobile systems. These include location and positioning services, multimedia, NFC and Bluetooth connectivity, a Chromium based web browser, as well as traditional UI development.
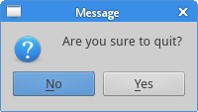
PyQt is used for developing desktop application using python. Latest version is PyQt5 in which we can design window, text box, label, etc using designer application. By default, if we click on the x button on the titlebar, the QWidget is closed. Sometimes we want to modify this default behaviour. For example, if we have a file opened in an editor to which we did some changes. We show a message box to confirm the action. We show a message box with two buttons: Yes and No. The first string appears on the titlebar. The second string is the message text displayed by the dialog. The third argument specifies the combination of buttons appearing in the dialog. The last parameter is the default button. It is the button, which has initially the keyboard focus. The return value is stored in the reply variable.
Below is the message code after running the python code.
Python
Python is an object-oriented, high-level programming language with integrated dynamic semantics primarily for web and app development. It is extremely attractive in the field of Rapid Application Development because it offers dynamic typing and dynamic binding options. Python is also used for developing complex scientific and numeric applications and its design philosophy emphasises code readability with its notable use of significant whitespace
A simple program for addition and calculating savings in Python is presented below :
# Create a variable savings
savings = 100

# Create a variable factor
factor = 1.10

# Calculate result after 7 years
result = savings * (factor ** 7)

# Print out result
print (result)
The Hello world printed by simply using this:
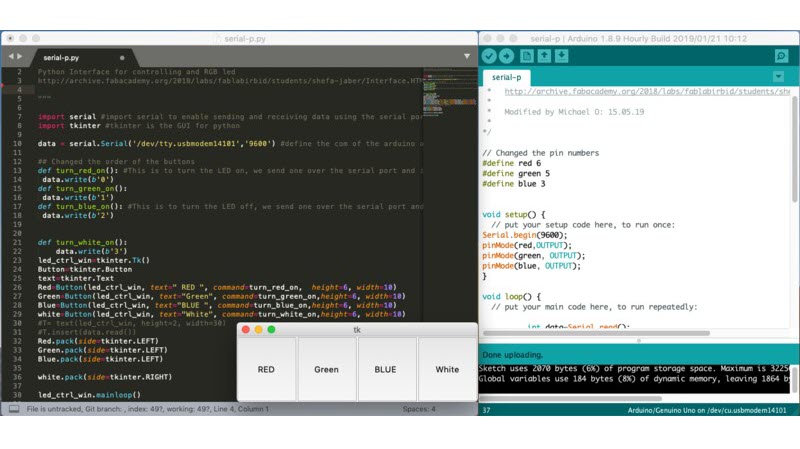
print(“Hello, World!”) We followed a this tutorial to control the RGB LED with Python and Arduino.
Individual work:
Processing
Processing is a programming language designed for the visual arts community. It is open source and uses basic syntax for creating drawings, animations, and interactive programs. It also includes a basic IDE, which serves as the programming interface.Each program created in Processing is called a "sketch" and can be saved in a sketchbook. I decided to use processing for my Individual Task.
For this week assignment, I decided to read and plot the serial data from my light sensor board. This board can detect the level of the light and it gives numerical values as serial output correspondingly. I used Neil's code for hello.light.45.c to program the board to send numerical values to PC according to the light level. When I check the previous year documentation I found out that Ivan has used a similar application for getting serial data from the ultrasonic sensor. Therefore, I decided to use his code and edit it to get my results.
I first downloaded processing from the Processing download page. According to their page, 'Processing' is a flexible software sketchbook and a language for learning how to code within the context of the visual arts. I followed some tutorials to get to know about the Processing.
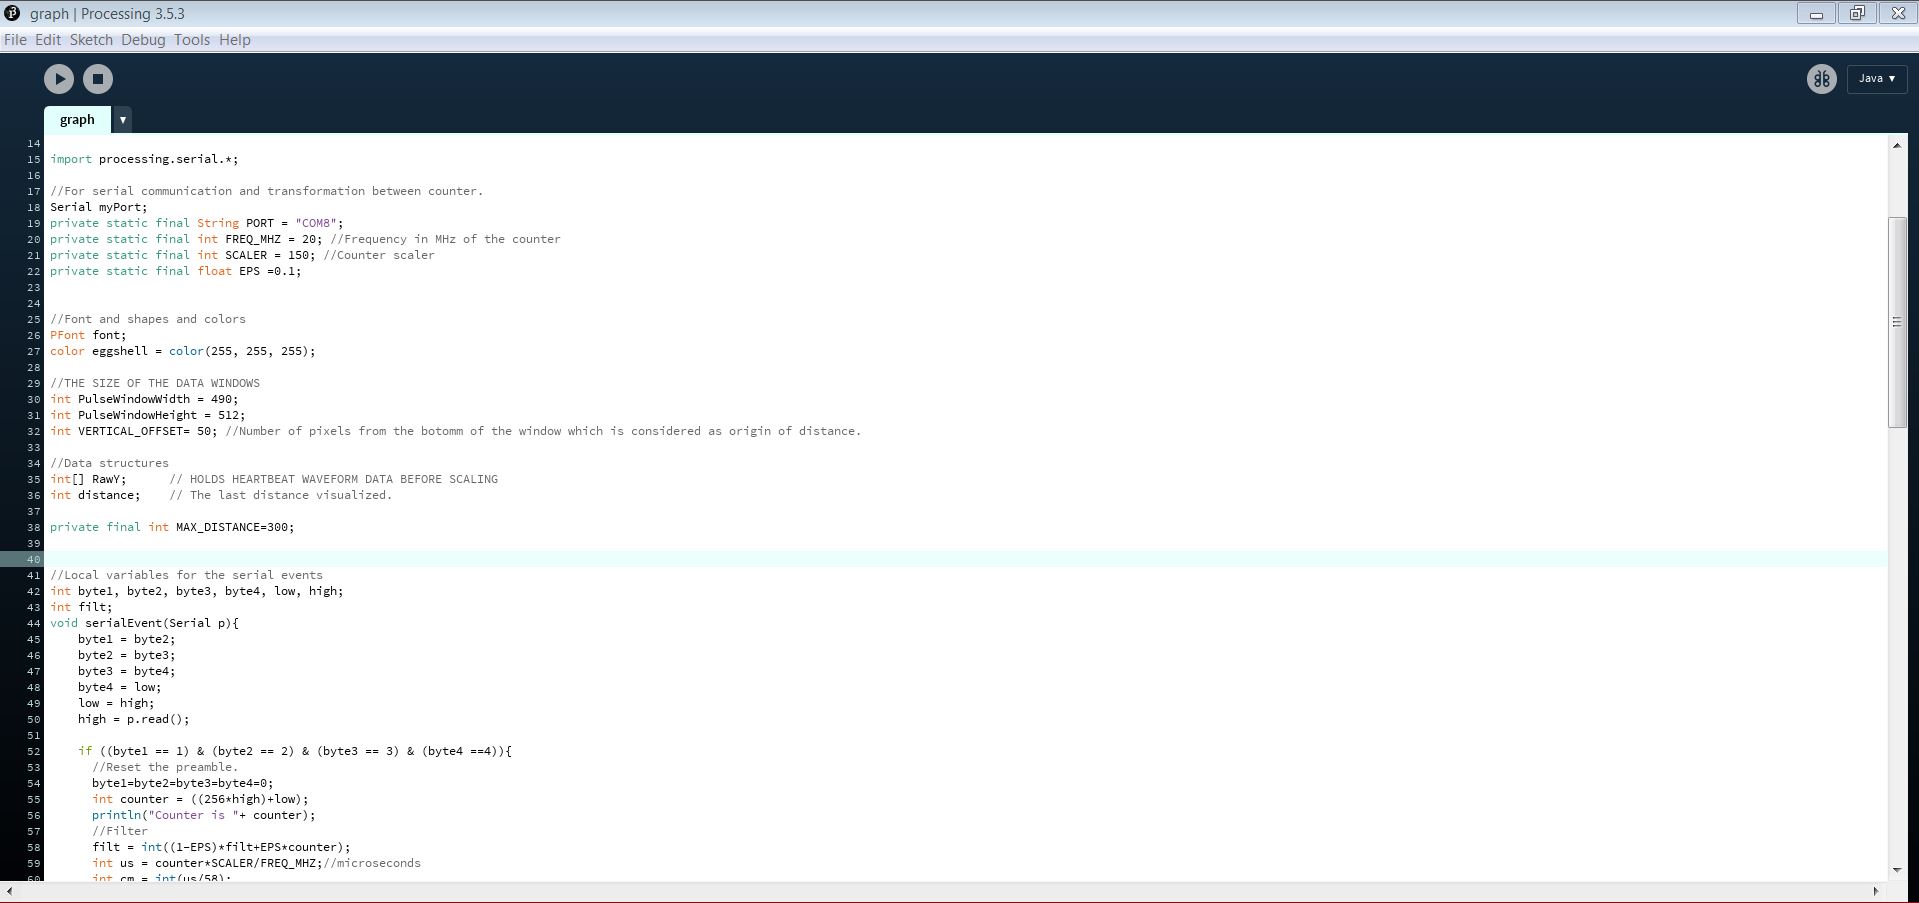
Then I got Ivan's code and tried to understand it specifically. The Serial port had to be changed in the code initially. The data I send from the serial line will be in two bytes + preamble.
The ADC reads the data from the sensor and encode it in 10 bits. This data are in registers ADCL and ADCH
The code store these 10 bits in two bytes
hr = ADCL;
        put_char(&serial_port, serial_pin_out, chr);
        char_delay();
        chr = ADCH;
                put_char(&serial_port, serial_pin_out, chr);
        char_delay();
In the Processing code I decode this byte and store it in a int:
int counter = ((256*high)+low);counter is the value that is present in the graph.
In addition, I'm sending a preamble of 4 bytes before each data frame. The bytes are 1, 2, 3, 4
put_char(&serial_port, serial_pin_out, 1);
        char_delay();
        put_char(&serial_port, serial_pin_out, 2);
        char_delay();
        put_char(&serial_port, serial_pin_out, 3);
        char_delay();
        put_char(&serial_port, serial_pin_out, 4);
        char_delay();
That will be checked in your Processing code:
if ((byte1 == 1) & (byte2 == 2) & (byte3 == 3) & (byte4 ==4)){
      //Reset the preamble.
Here I used FTDI cable to send the data to the PC from the serial port. Then I tried to change the colors of the window and the texts according to my needs. The graph of the program updates everytime I receive a new value from the sensor.
void updateGraph(int value){
   distance = value;
   //Add the point to the graph
   //Shift all to the left (new value will be added at the end), instead of using for loop I utilize the arraycopy method that it is much faster.
   int[] buffer = new int[PulseWindowWidth];
   arrayCopy(RawY, 1, buffer, 0, RawY.length-1);
   //Make a map: distance values [0,200], vertical values [0,pulsewindowheight-verticaloffset]
   value = int(map(value,0,MAX_DISTANCE, 0, PulseWindowHeight-VERTICAL_OFFSET));
   buffer[buffer.length-1]=value;
   RawY=buffer;
   println("Added: " +RawY[RawY.length-1] );

}
The key method is the updateGraph method called from the Serial Event. This method stored the recieved value in the distance variable to be visualized later. In addition, it shifts all the elements of the array RawY one position left, leaving a free space at the end of the array that will be filled with the received value. Note that it has been used the arraycopy method instead of utilizing a for loop because it is more efficient. In addition to that The received values from distance range from [0, MAX_DISTANCE] while the Y axis range from [0, windowHeight-Offset] has to be transformed. Hence, we need to scale the value utilizing the map function.
Then I changed to scaling factor to get clearly visible values in the graph. After running the code I was able to plot and display the serial data coming from my light sensor. I faced some problems while displying the values in the graph. The values were coming too small and the graph was not displaying them properly due to the scaling factor. When I checked for the reason I found out that the reason behind the small values was thelight sensor was not soldered properly. Then I had to solder the light sensor again and changed the scaling factorback to normal value to display the graph properly.
Models files
data folder for the application
source code used to program the light sensor board