Skulina Hlif Kjartansdottir
How to make [almost] anything
Week 14: Interface and Application Programming
This week we get to grips with interface and application programming. This is our agenda for the week.
Week 14: Assignment
The assignment for this week is to write an application that interfaces with an input and/or output device. I carried on with my light reading and wanted to be able to read it and create an output over a period of time that could be registered and could be observed in order to views fluctuation over time according to differenct lighting conditions. The intension was to catch a reading of the light through the input board every 5 minutes and write a .csv file that could be imported into excel to give a chart of a light reading of, for instance, a 24 hour period. For this I picked Python and worked on the basis of the file: hello.light.45.make. I copied the code onto the microcontroller on the input board and later to my output board.
I then imported PySerial to prepare for coding. I got an error and with looking up how other students had resolved this issue, such as Alexandra Ferreira's account I managed to get it going. I also referred to this article on Installing Python and PySerial. For further information on reading and writing the .csv file I consulted this article on CSV File Reading and Writing .
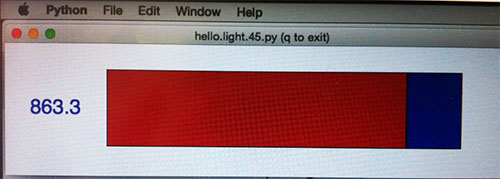
I reconnected and tested if the code was working by entering: python hello.light.45.py /dev/tty.usbserial-FTGA2IBF - into the terminal window. The code worked on both boards and returned a light reading:
I then wrote the following code and inserted at front:
import csv
csvfile=open('light-reading.csv', 'wb')
lightwriter = csv.writer(csvfile, delimiter=' ',
quotechar='|', quoting=csv.QUOTE_MINIMAL)
I also the line: lightwriter.writerow(filter), after 'filter'.
Following this the code was tested and a .csv file was created in the folder where the code for this assignment resides.
Now, I added: nexttime = 0, and:
if nexttime < time.gmtime([secs]):
lightwriter.writerow([filter])
nexttime = time.gmtime([secs])+300
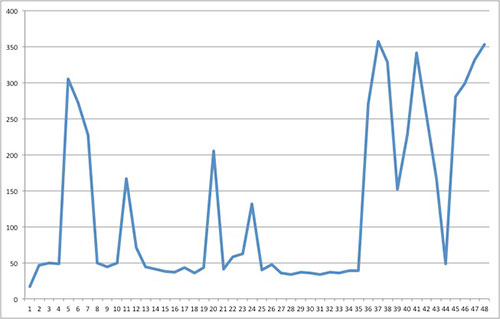
This indicated to the microcontroller to take a reading every 5 minutes (300 sec) that would be saved in the .csv file. This I was able to confirm, with letting the reading of the light run for a while and later importing the excel file.
The .csv file needs to be imported into excel for translating the data into graphs, for instance. The first reading looked like this:
#
# hello.light.45.py
#
#
# receive and display light level
# hello.light.45.py serial_port
#
# Neil Gershenfeld
# CBA MIT 10/24/09
#
# (c) Massachusetts Institute of Technology 2009
# Permission granted for experimental and personal use;
# license for commercial sale available from MIT
#
from Tkinter import *
import serial
import csv
import time
csvfile=open('light-reading.csv', 'wb')
lightwriter = csv.writer(csvfile, delimiter=' ',
quotechar='|', quoting=csv.QUOTE_MINIMAL)
WINDOW = 600 # window size
eps = 0.5 # filter time constant
filter = 0.0 # filtered value
nexttime = 0
def idle(parent,canvas):
global filter, eps, nexttime
#
# idle routine
#
byte2 = 0
byte3 = 0
byte4 = 0
ser.flush()
while 1:
#
# find framing
#
byte1 = byte2
byte2 = byte3
byte3 = byte4
byte4 = ord(ser.read())
if ((byte1 == 1) & (byte2 == 2) & (byte3 == 3) & (byte4 == 4)):
break
low = ord(ser.read())
high = ord(ser.read())
value = 256*high + low
filter = (1-eps)*filter + eps*value
if nexttime < time.time():
lightwriter.writerow([filter])
nexttime = time.time()+300
x = int(.2*WINDOW + (.9-.2)*WINDOW*filter/1024.0)
canvas.itemconfigure("text",text="%.1f"%filter)
canvas.coords('rect1',.2*WINDOW,.05*WINDOW,x,.2*WINDOW)
canvas.coords('rect2',x,.05*WINDOW,.9*WINDOW,.2*WINDOW)
canvas.update()
parent.after_idle(idle,parent,canvas)
#
# check command line arguments
#
if (len(sys.argv) != 2):
print "command line: hello.light.45.py serial_port"
sys.exit()
port = sys.argv[1]
#
# open serial port
#
ser = serial.Serial(port,9600)
ser.setDTR()
#
# set up GUI
#
root = Tk()
root.title('hello.light.45.py (q to exit)')
root.bind('q','exit')
canvas = Canvas(root, width=WINDOW, height=.25*WINDOW,
background='white')
canvas.create_text(.1*WINDOW,.125*WINDOW,text=".33",font=("Helvetica",
24),tags="text",fill="#0000b0")
canvas.create_rectangle(.2*WINDOW,.05*WINDOW,.3*WINDOW,.2*WINDOW,
tags='rect1', fill='#b00000')
canvas.create_rectangle(.3*WINDOW,.05*WINDOW,.9*WINDOW,.2*WINDOW,
tags='rect2', fill='#0000b0')
canvas.pack()
#
# start idle loop
#
root.after(100,idle,root,canvas)
root.mainloop()
Plans for next Week
To follow up on the programming and do some more light readings.
Notes
My Notes from this week.