12. Interface and Application Programming
Assignment
Group assignment
- Compare as many tool options as possible.
Group Project here
Individual Assignment
- Interpret and implement design and programming protocols to create a Graphic User Interface (GUI).
- Node-RED
Table of Contents
1. The Plan
2. Languages
2-1 Option
2-2 Selection(Node-RED)
2-1 Option
2-2 Selection(Node-RED)
3. Node-RED
3-1. Download & Run
3-2. Programming
3-1. Download & Run
3-2. Programming
4. Milling & Soldering Component
5. Programming For "Arduino"
1. The Plan
- What I want to show through UI
- heating temperature
- temperature variation
2. Languages
2-1 Option
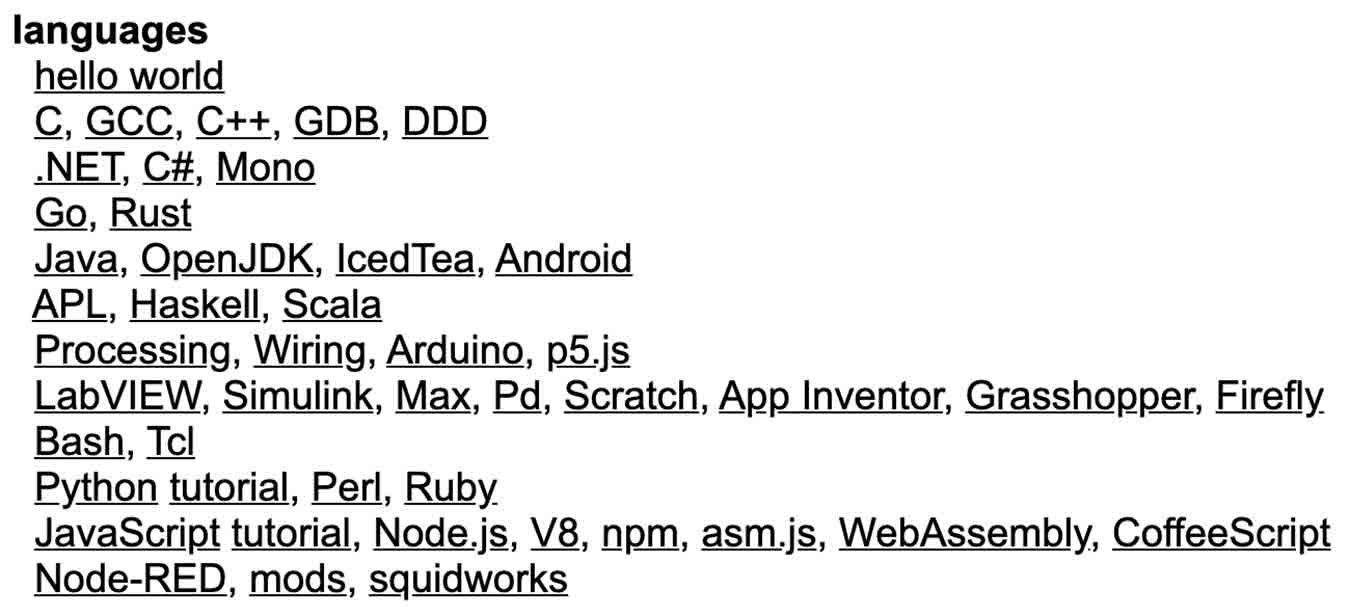
- I wanted to make it easier to see. So I thought mainly about simple language with low difficulty. (Like Node-RED or App Inventer)
2-2 Selection(Node-RED)
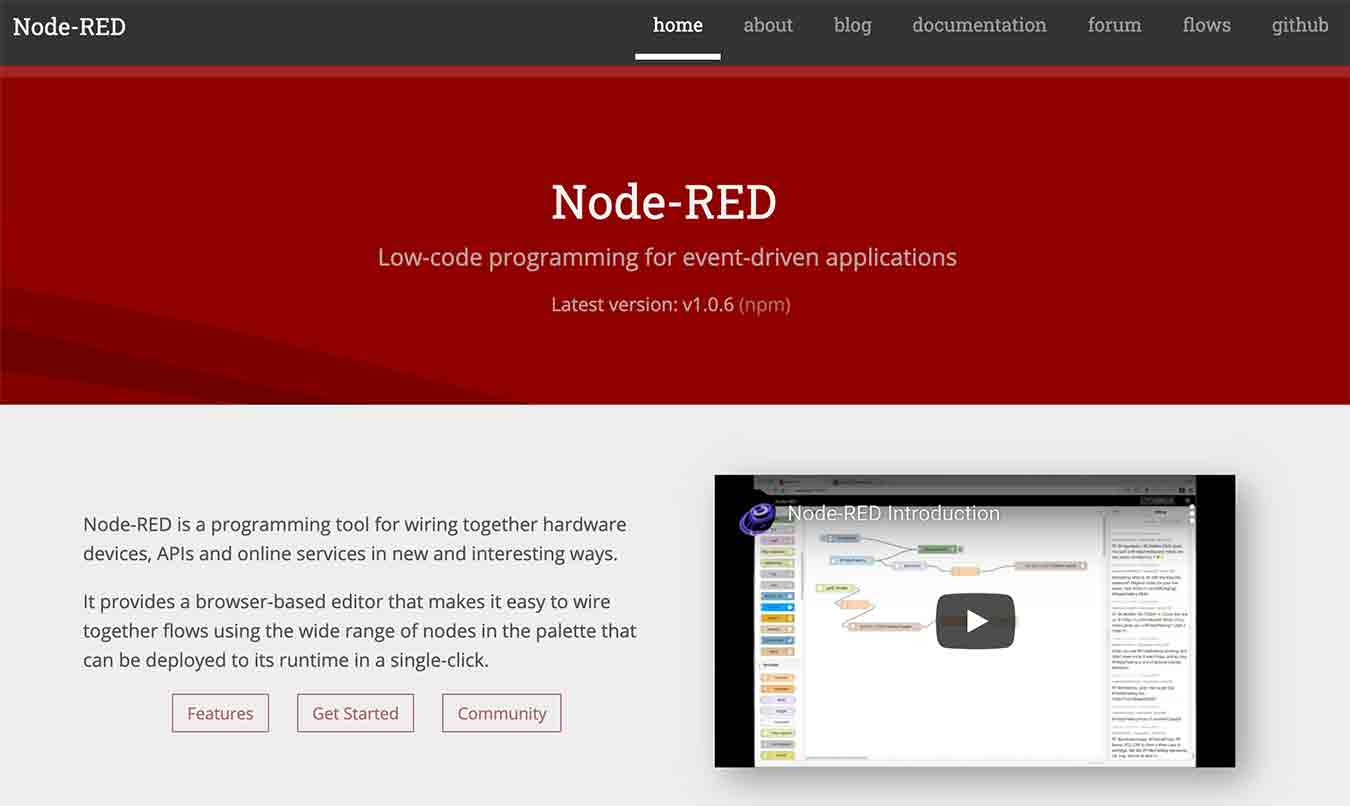
- It has an interface similar to MODS. It is also a low-code programming for event-driven applications. It programs a browser-based monitor that makes it easy to wire together using the wide range of nodes in that can be deployed to its runtime in a single-click.
3. Node-RED
- Node-Red Reference Site here
3-1. Download & Run
- I downloaded "Node-RED" using the terminal through Homebrew that I downloaded in week4, the electronics production.
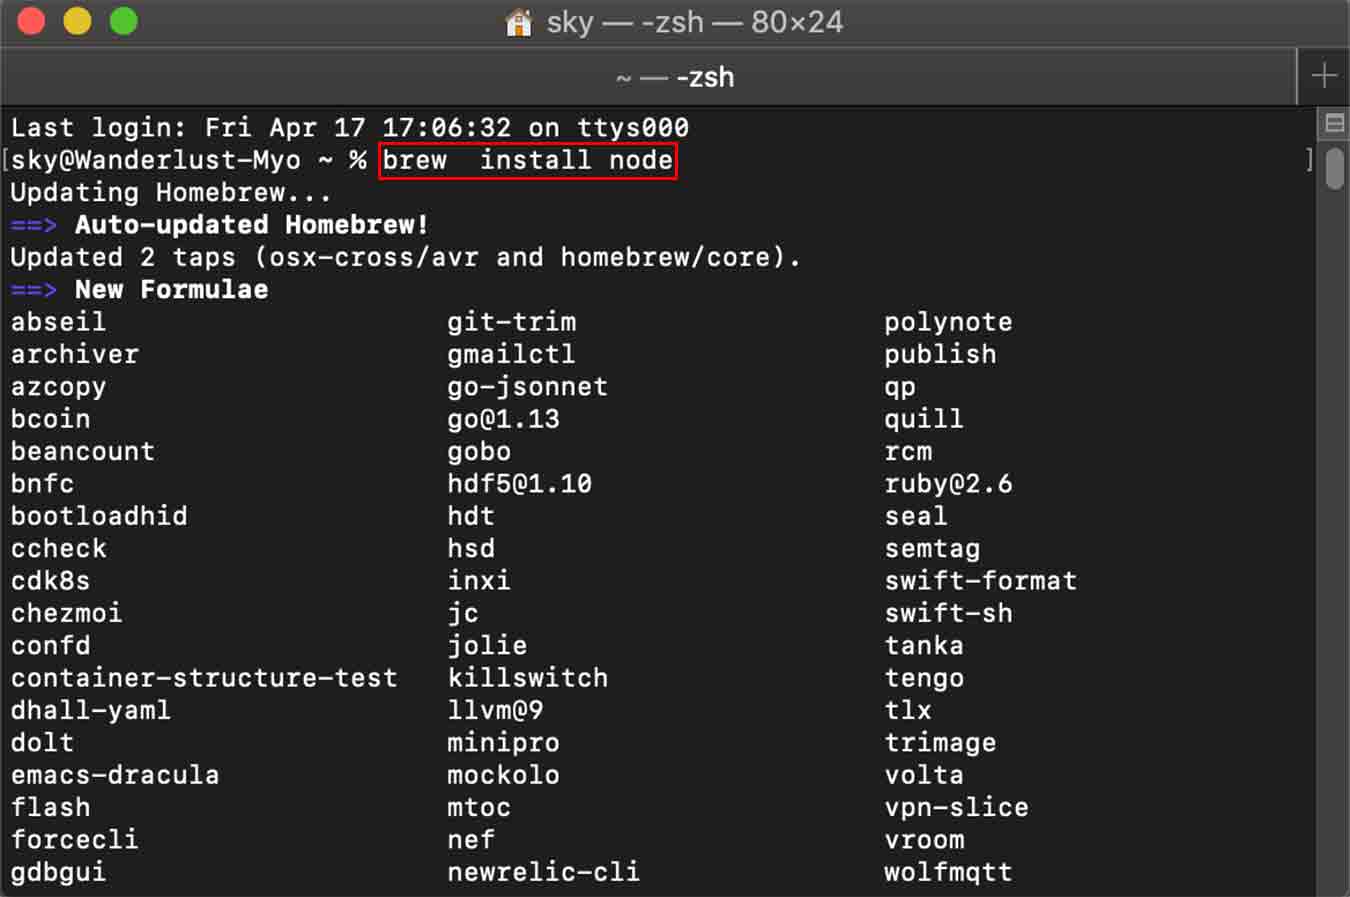
- The first command is "brew install node".
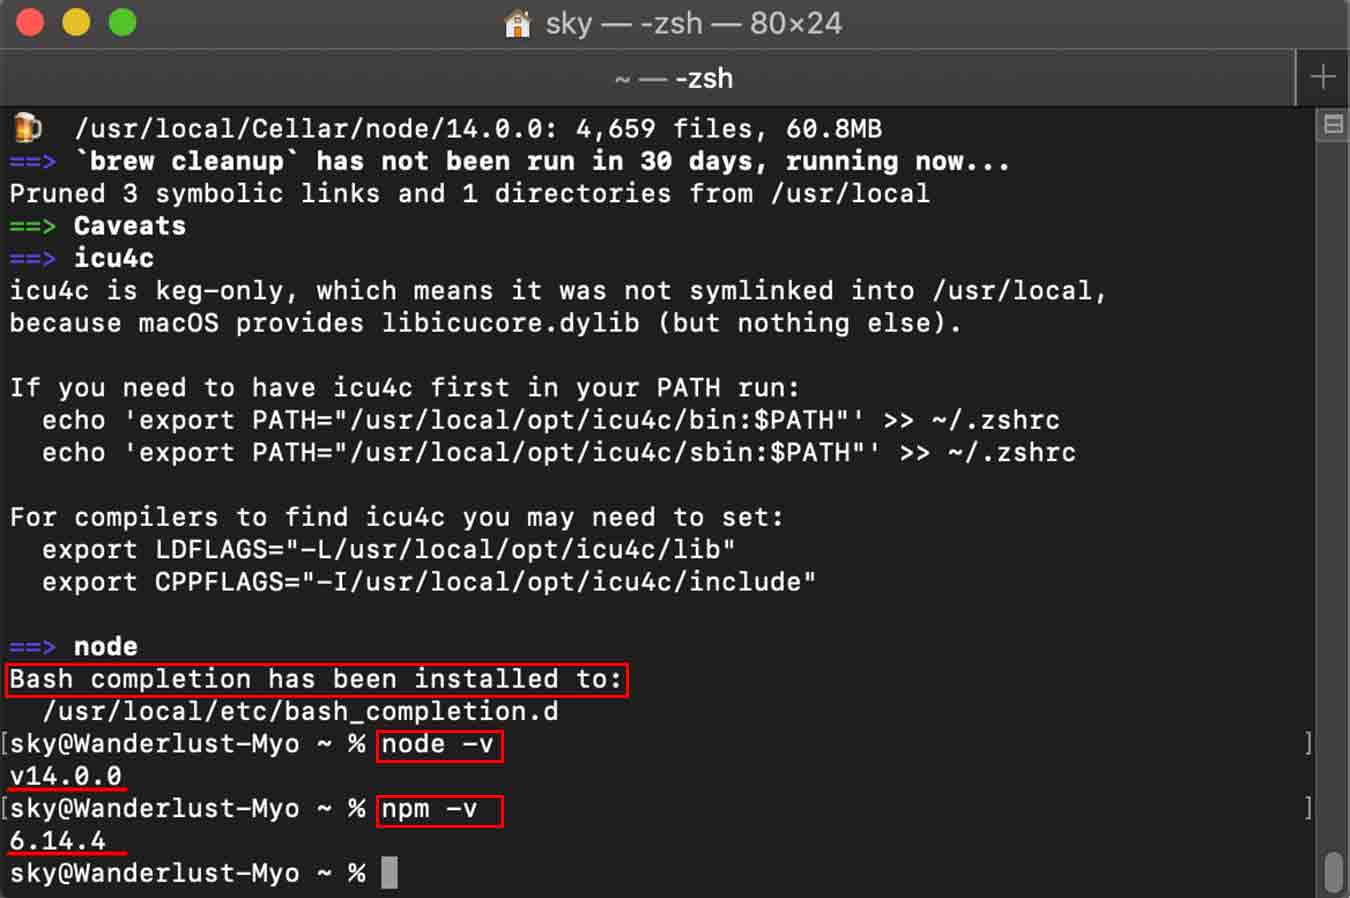
- Download complete! The command to check the downloaded the version of node and npm(Node Package Manager) is "node -v" and "npm -v" respectively.
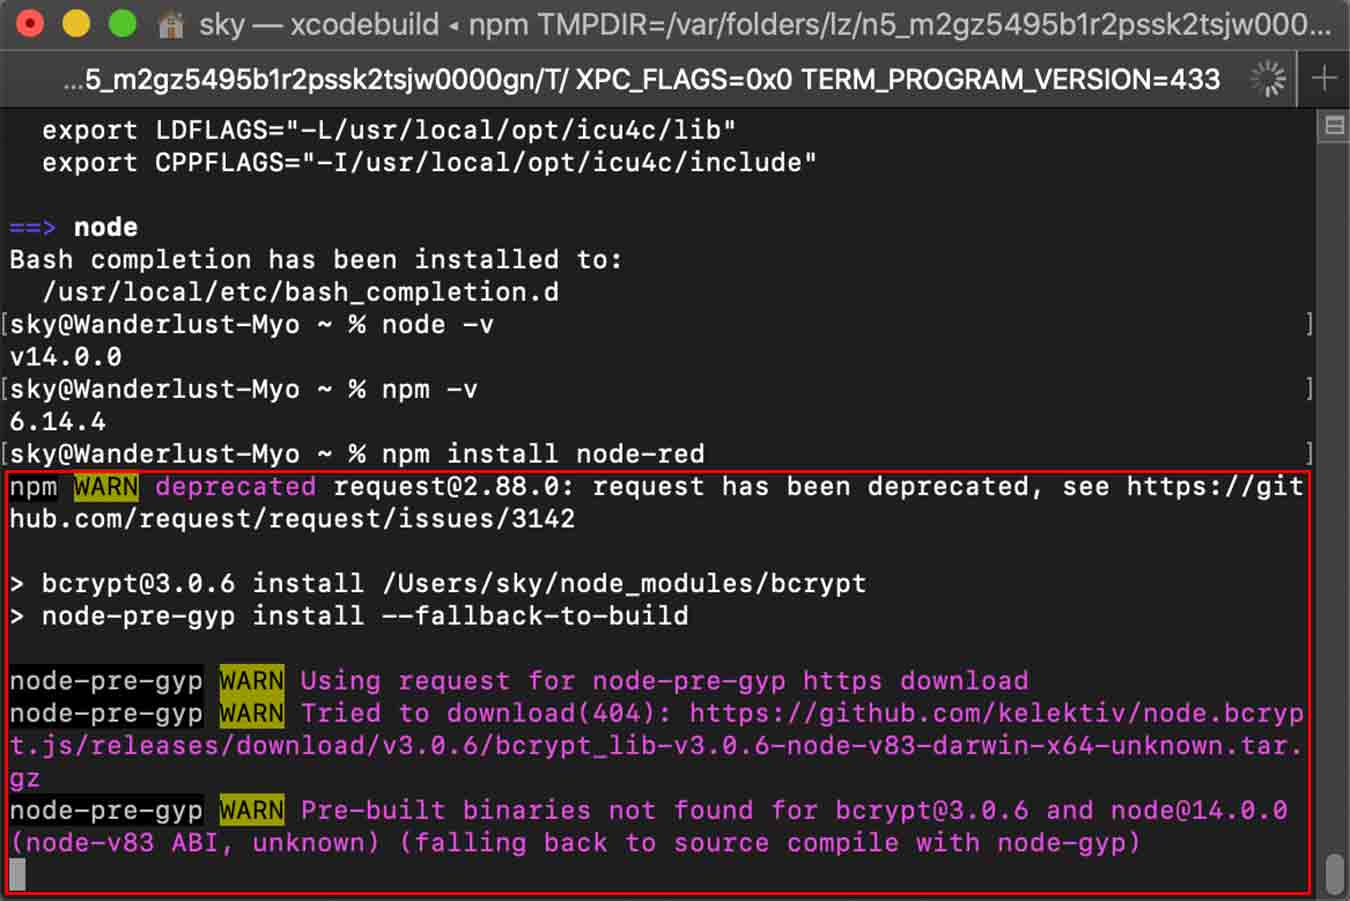
- Warning while downloading node red.(Commend : npm install node-red)
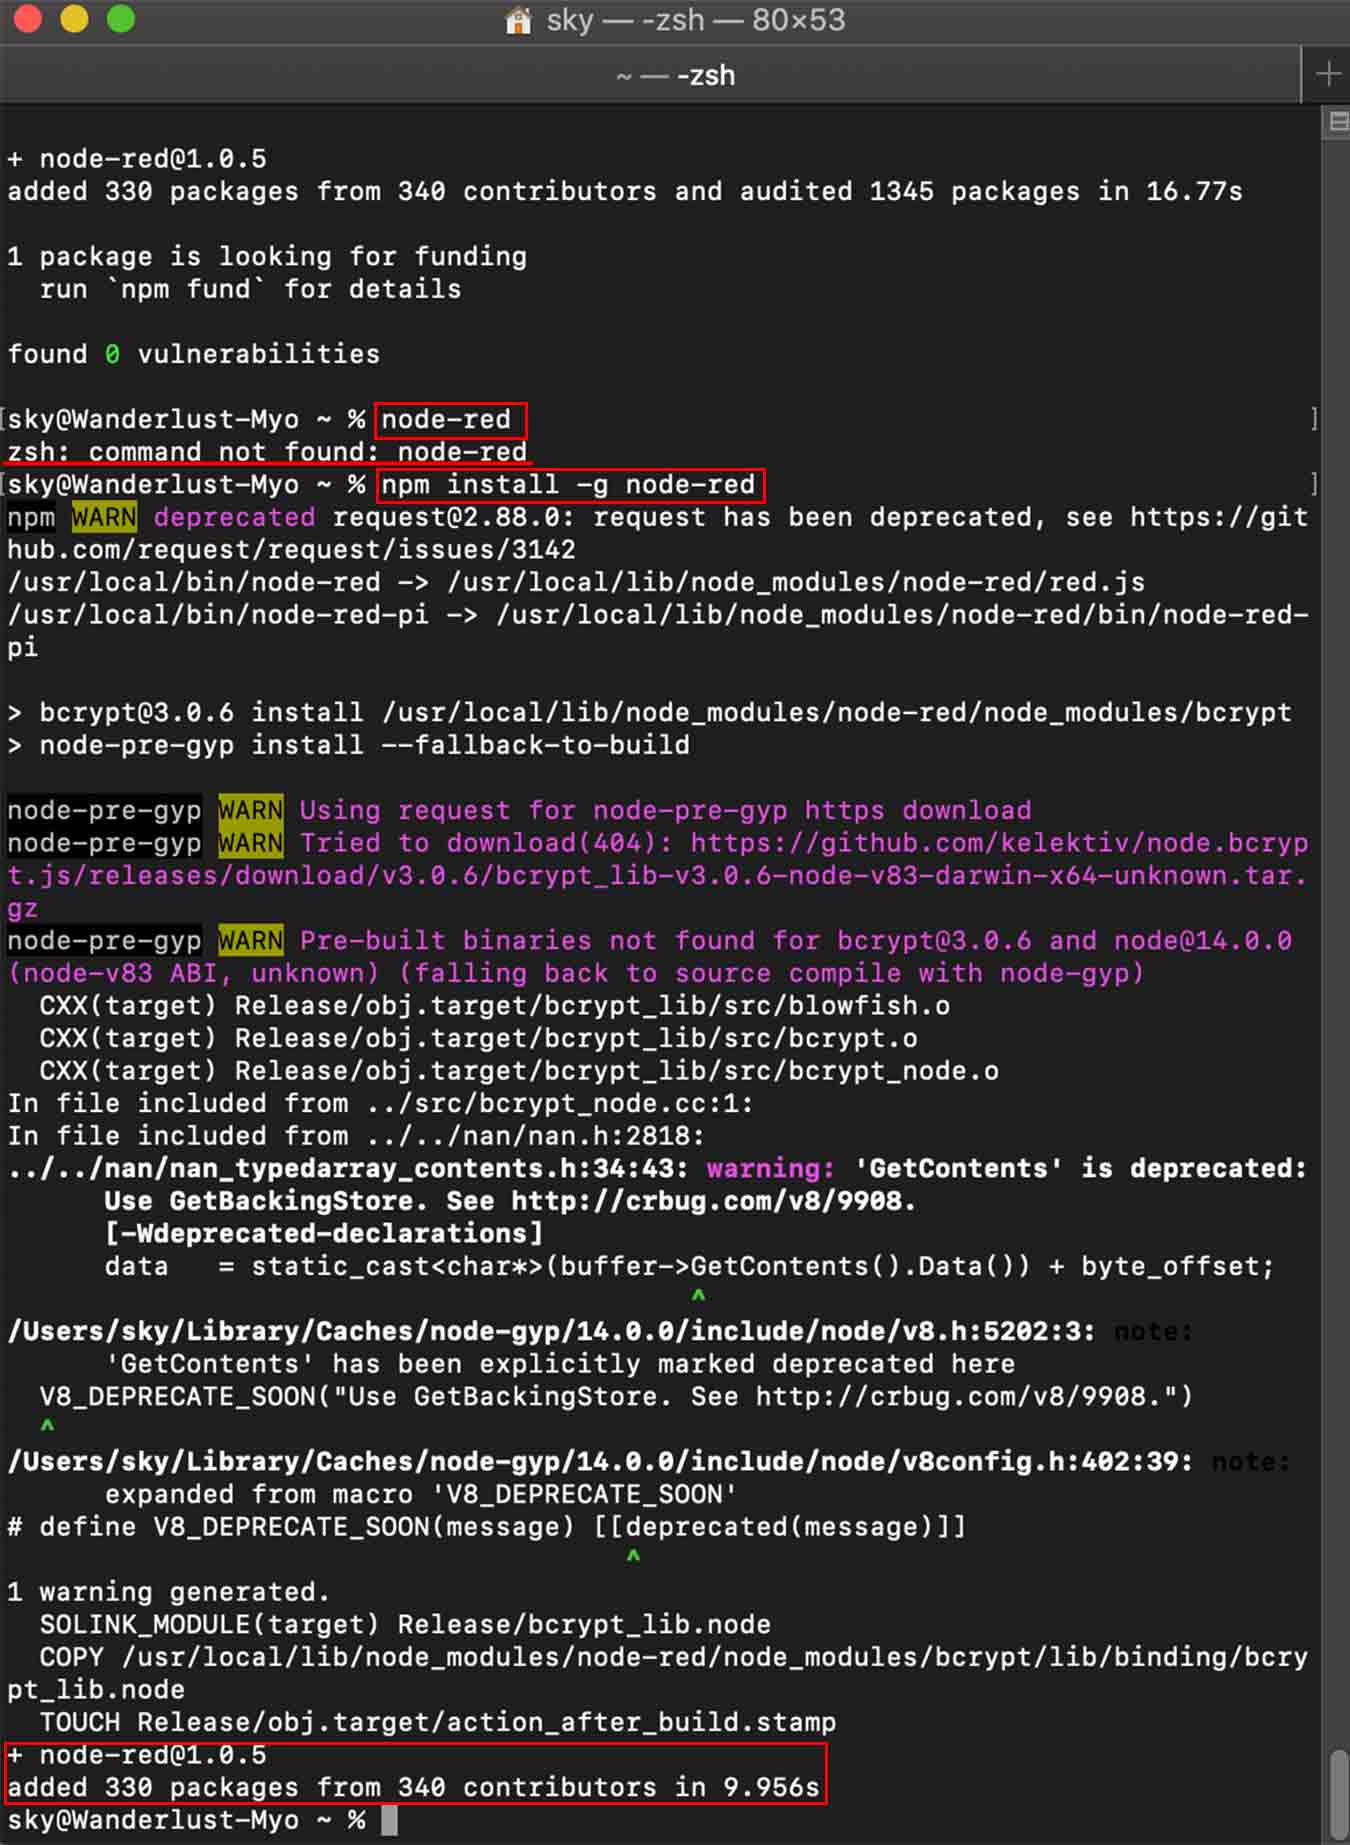
- Naturally, can't find it even if you enter the command to open the node(Commend : node-red).
- I found out that -g was missing in the middle of the command, and when I typed "npm install -g node-red", node-red download is complete!
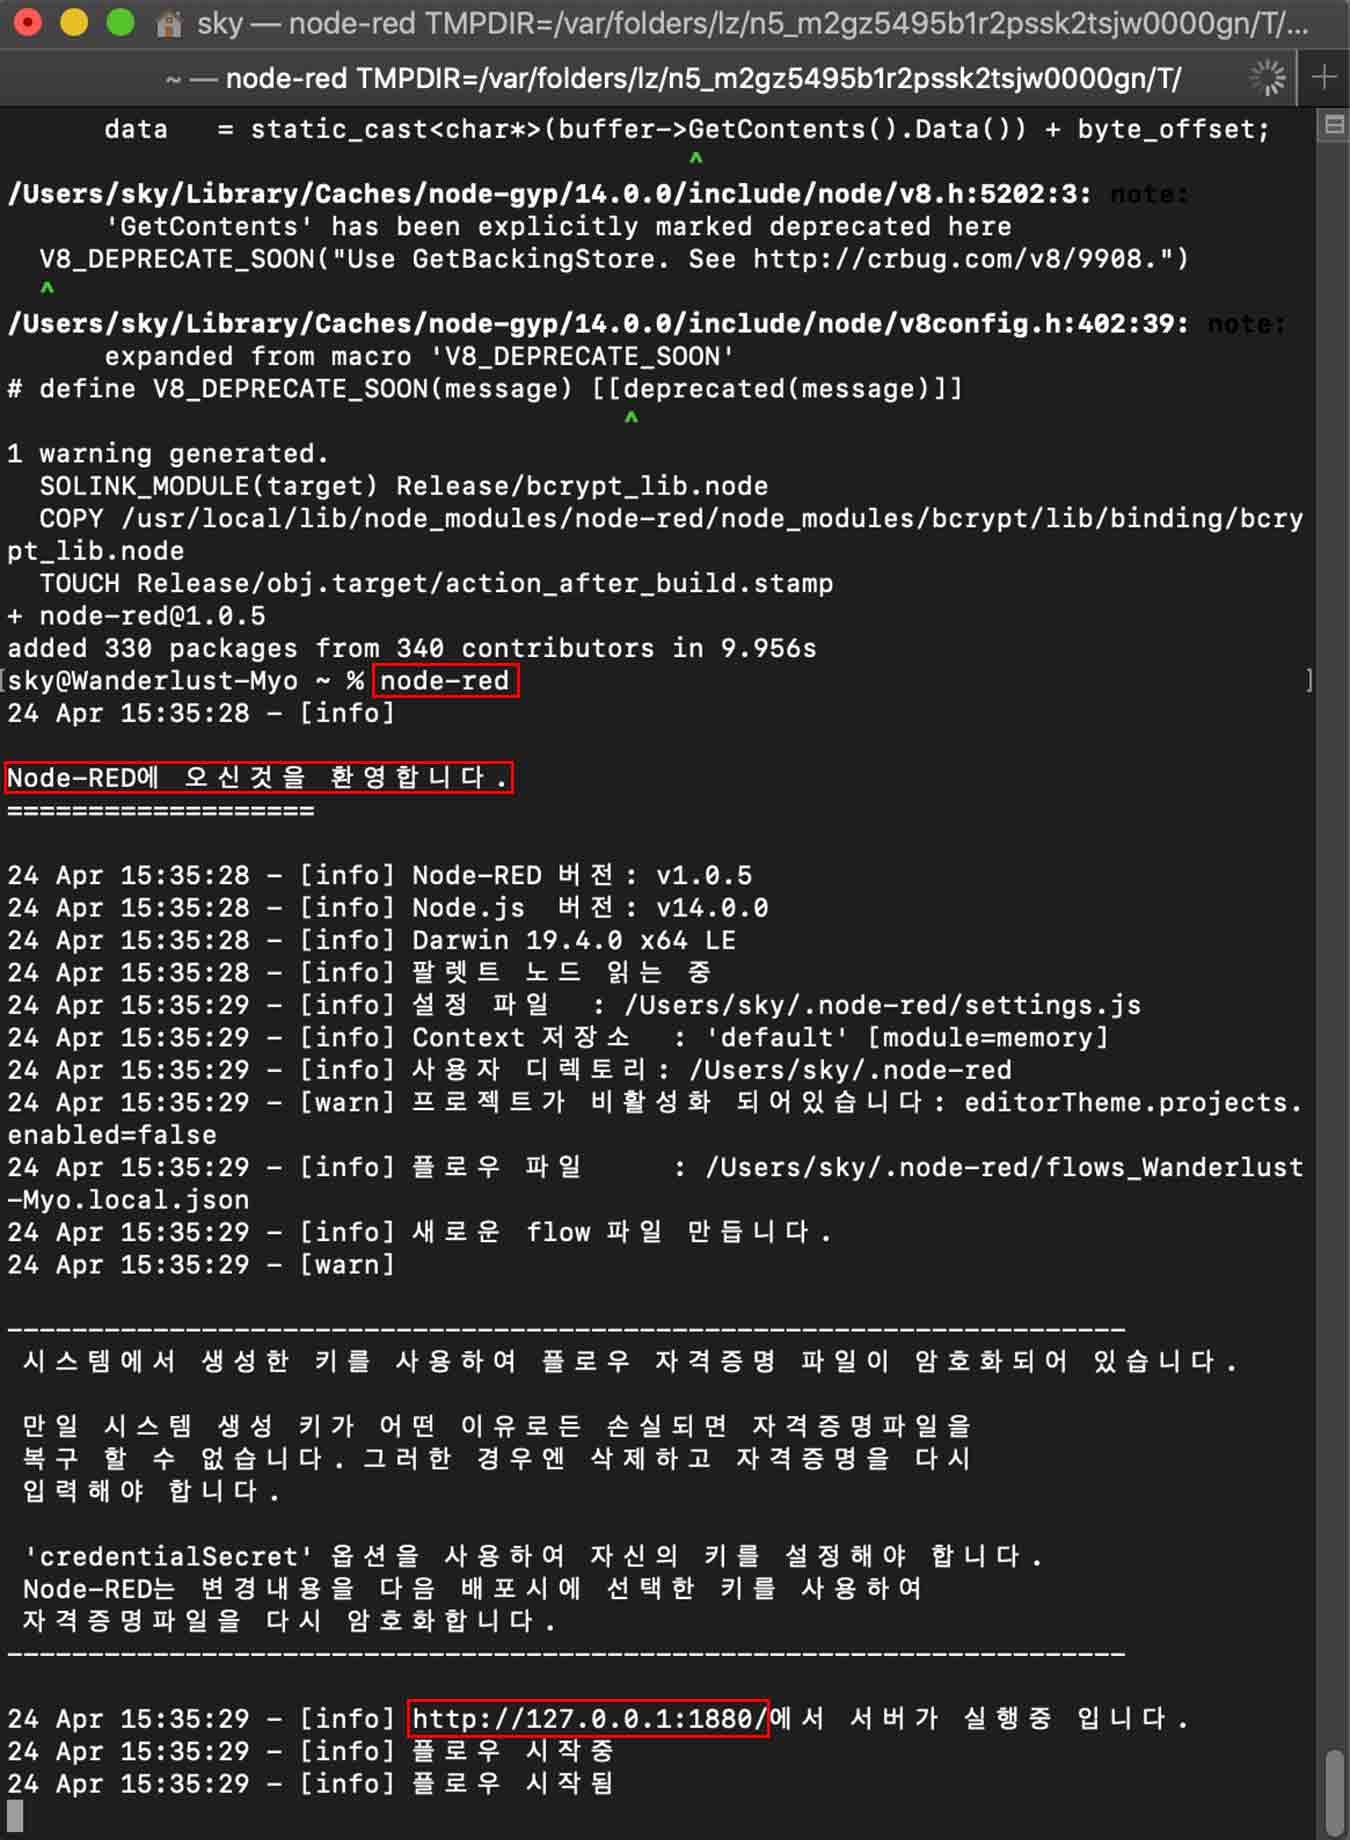
- Type "node-red" again, enter node red! If you go into the link below, you're!
3-2. Programming
- The screen of the Node-RED that followed the link.
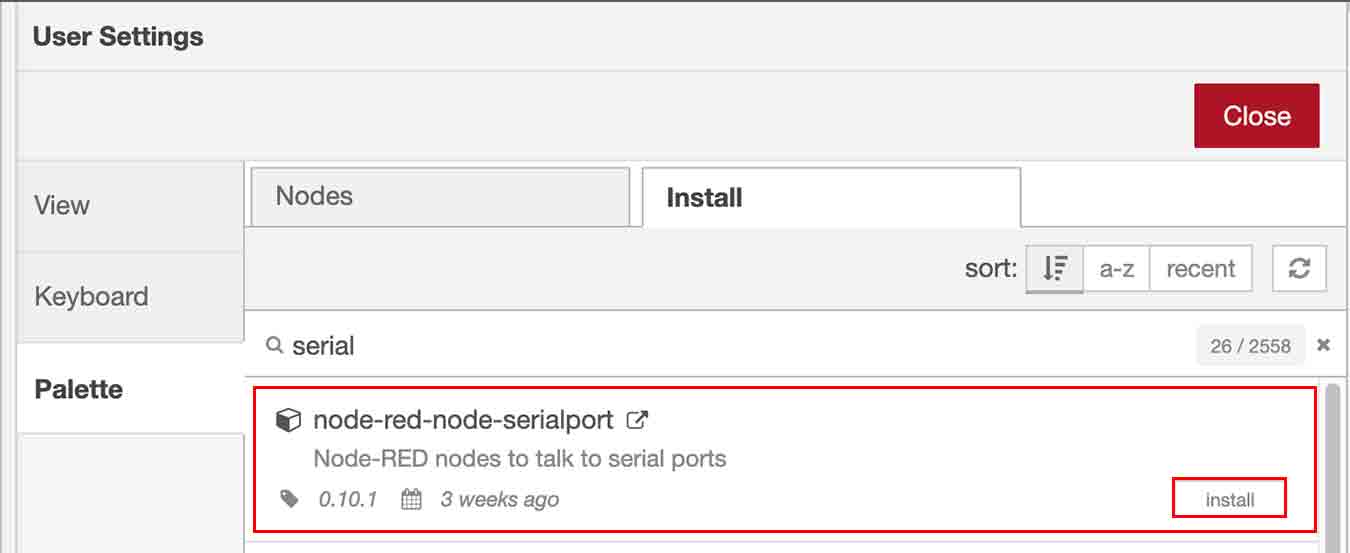
- Because there is no serial port! Click on the list icon in the upper right corner Manage Palette > Palette > Nodes > Enter "serial" in the search box > Click on the first "node-red-node-serialport" install!
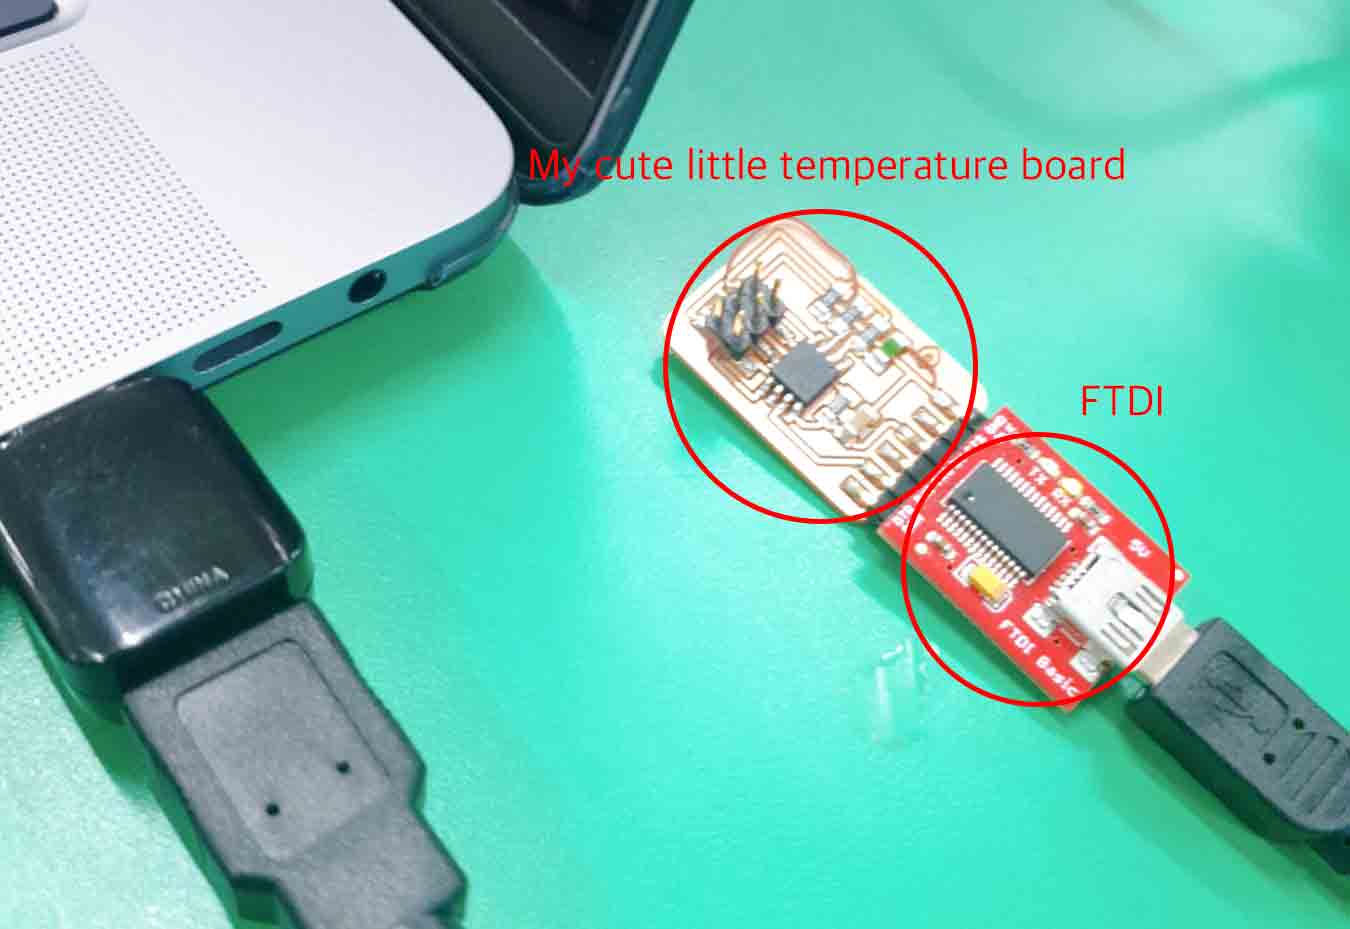
- Connect the temperature board you made in input device week to your computer and open the serial board to check if it works well!
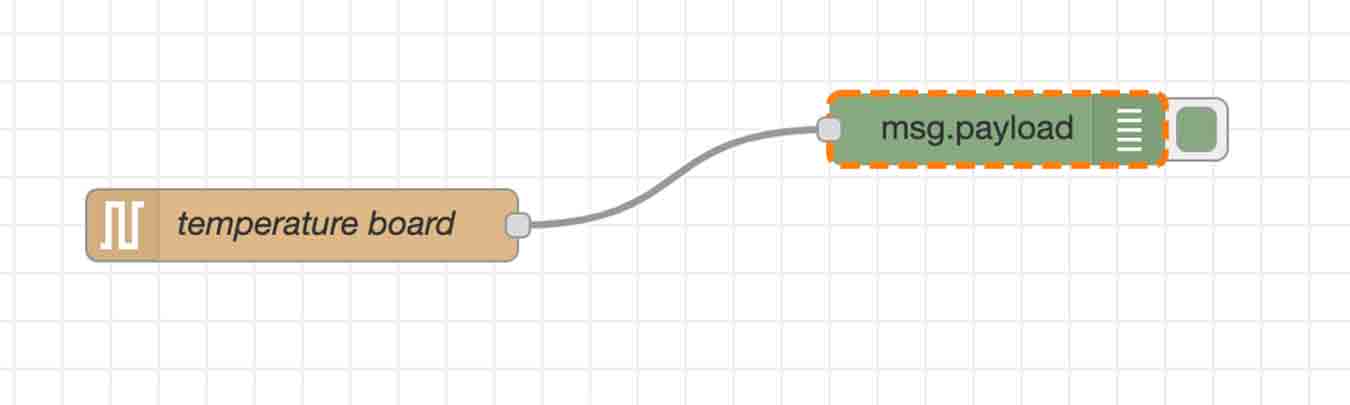
- Add nodes called "Serial in" and "debug" to Flow 1 and connect each other.
- First "debug" double-click
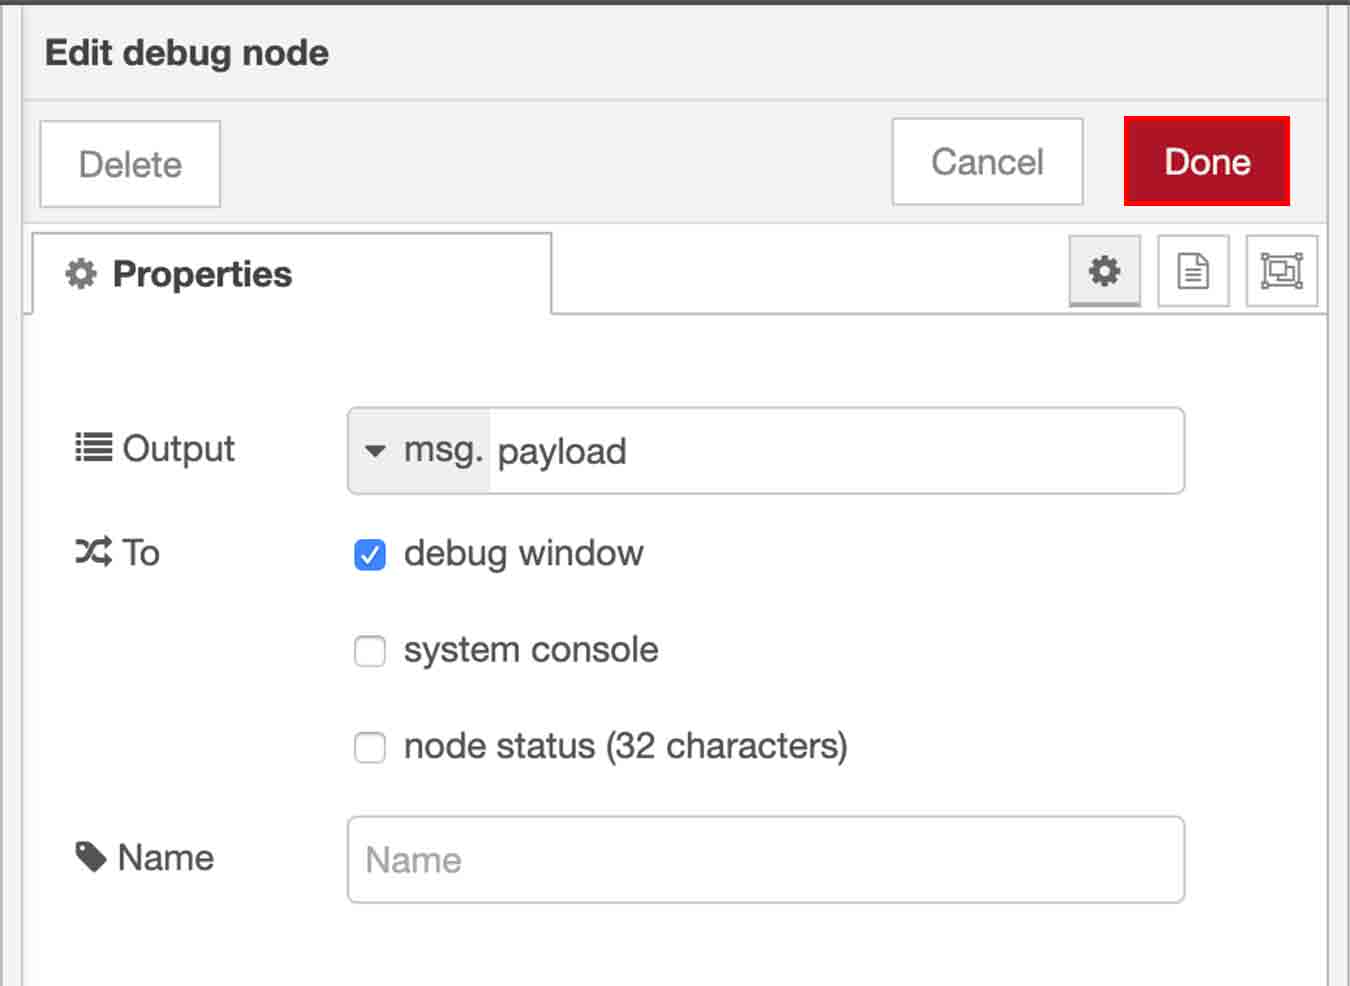
- Set "Debug" setting like this and double-click "Serial in"!
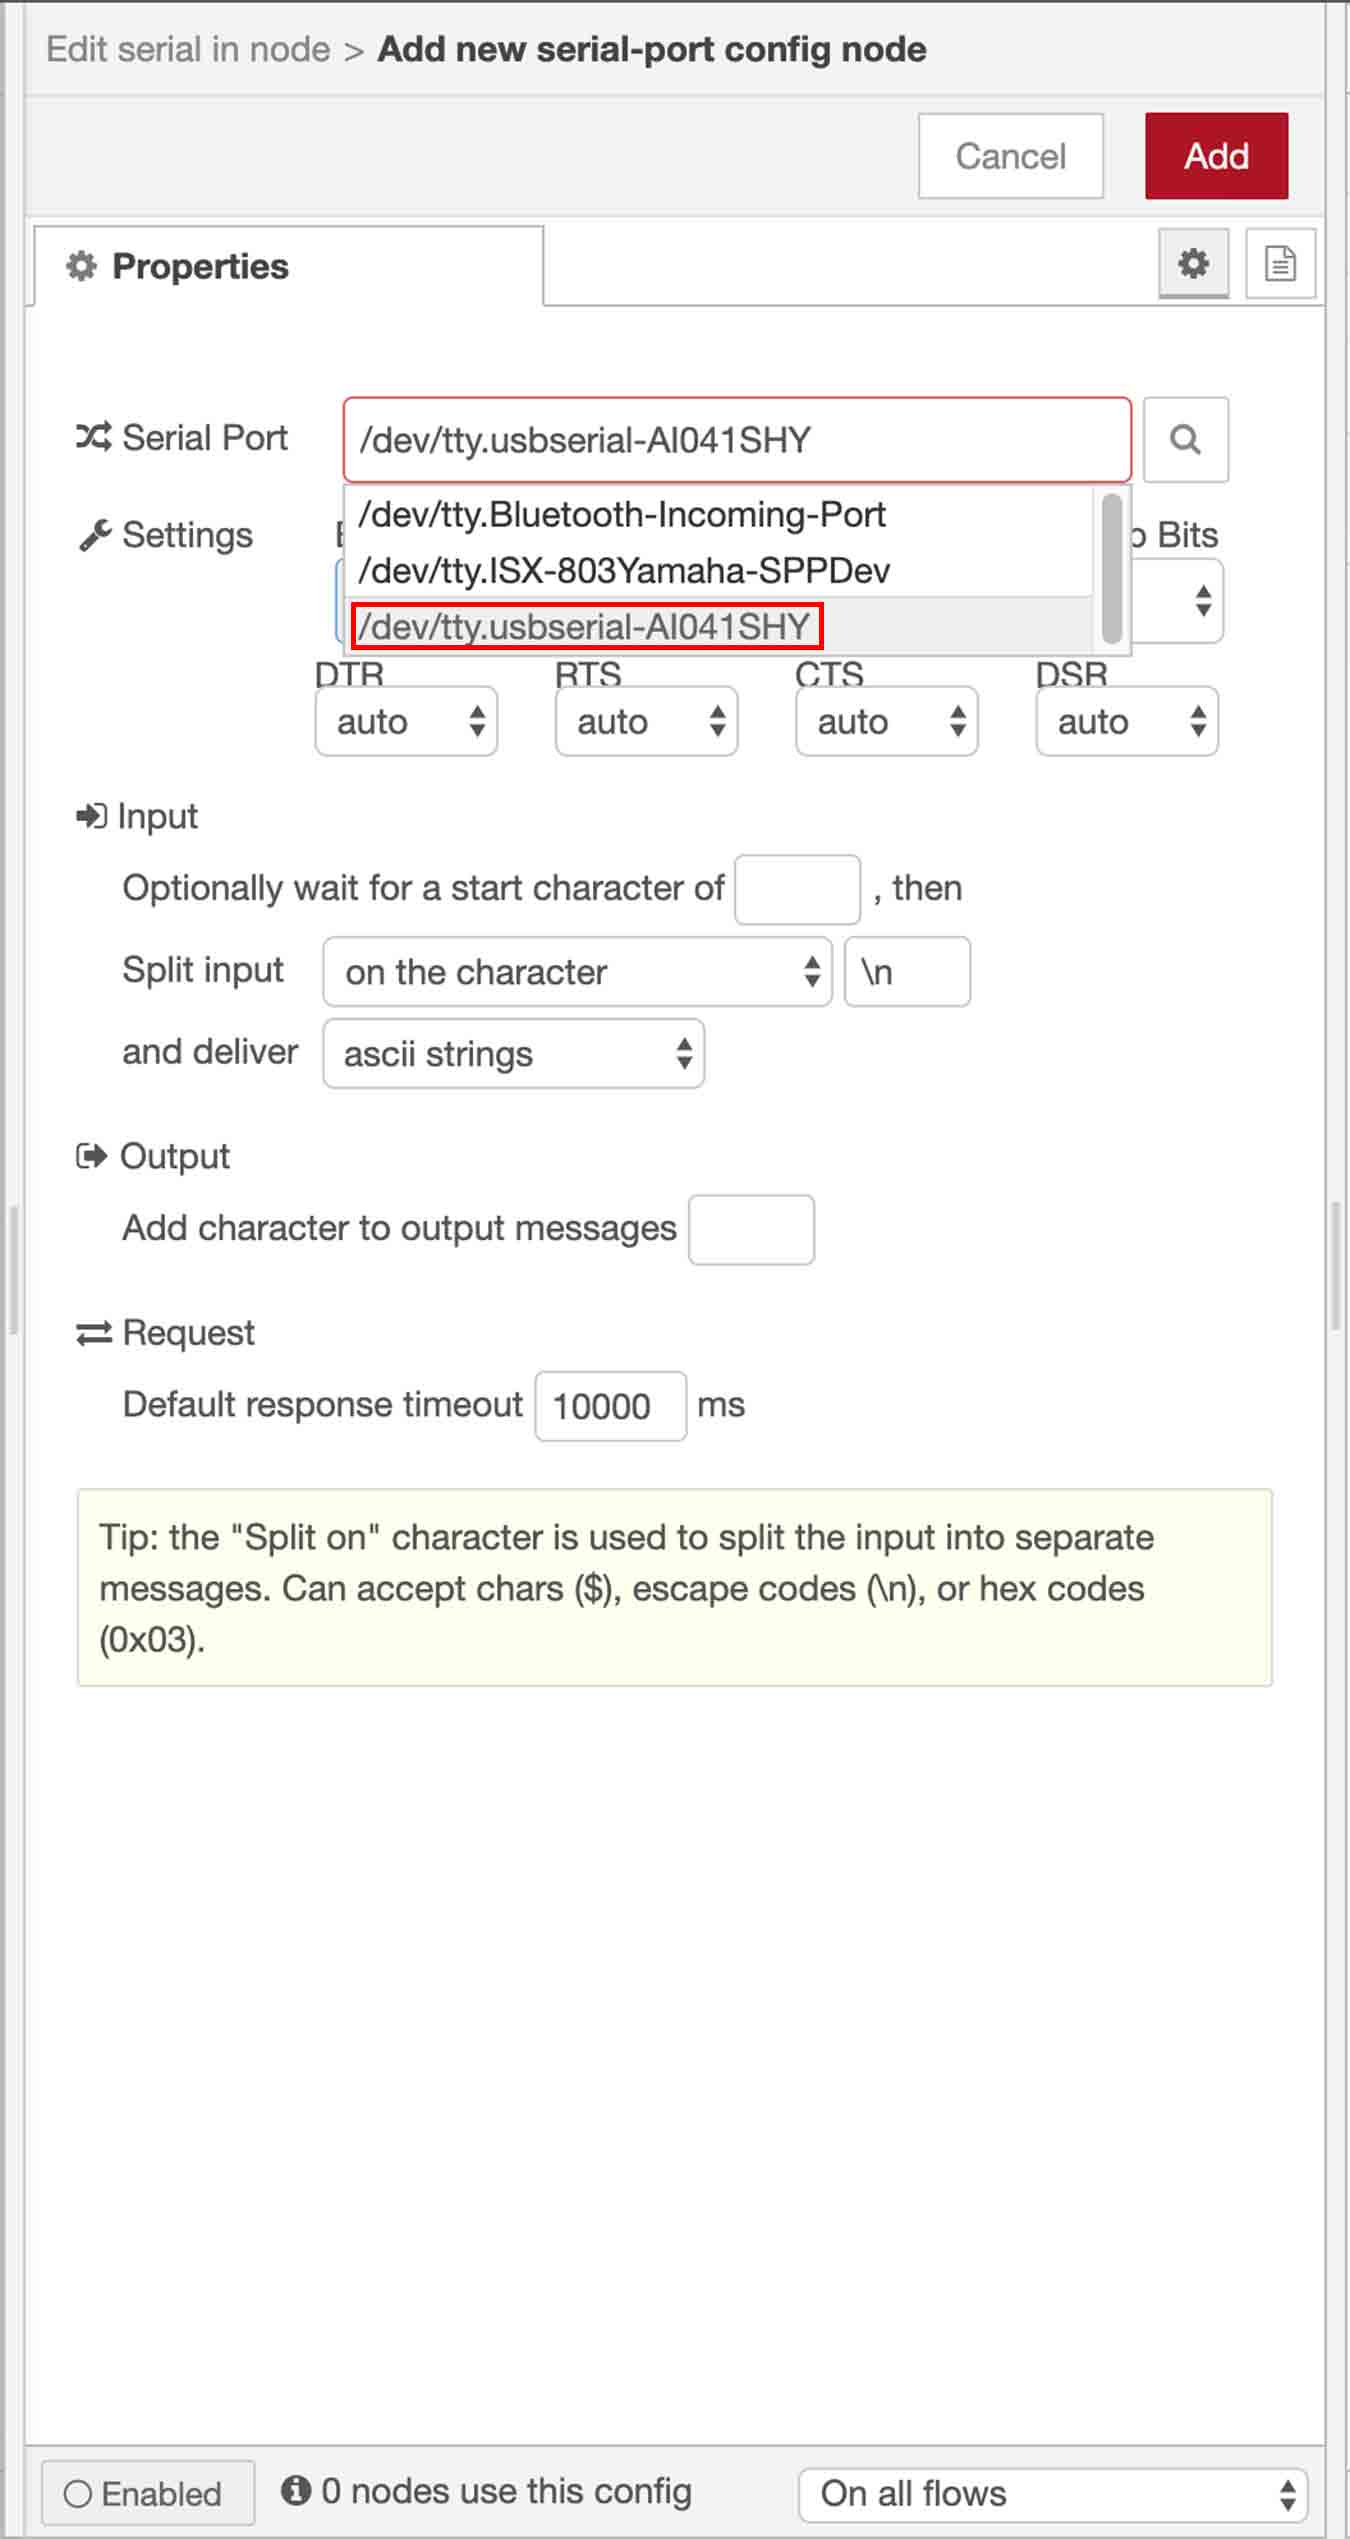
- Set the serial port of the connected board and check for other settings including the Baud Rate (9600...).
- Add the serial port of the Arduino code in order for the board and interface program to be linked. I had to add a serial port with 9600.
- Once "Connected" is confirmed under the serial in icon you added, click the debug icon on the right!
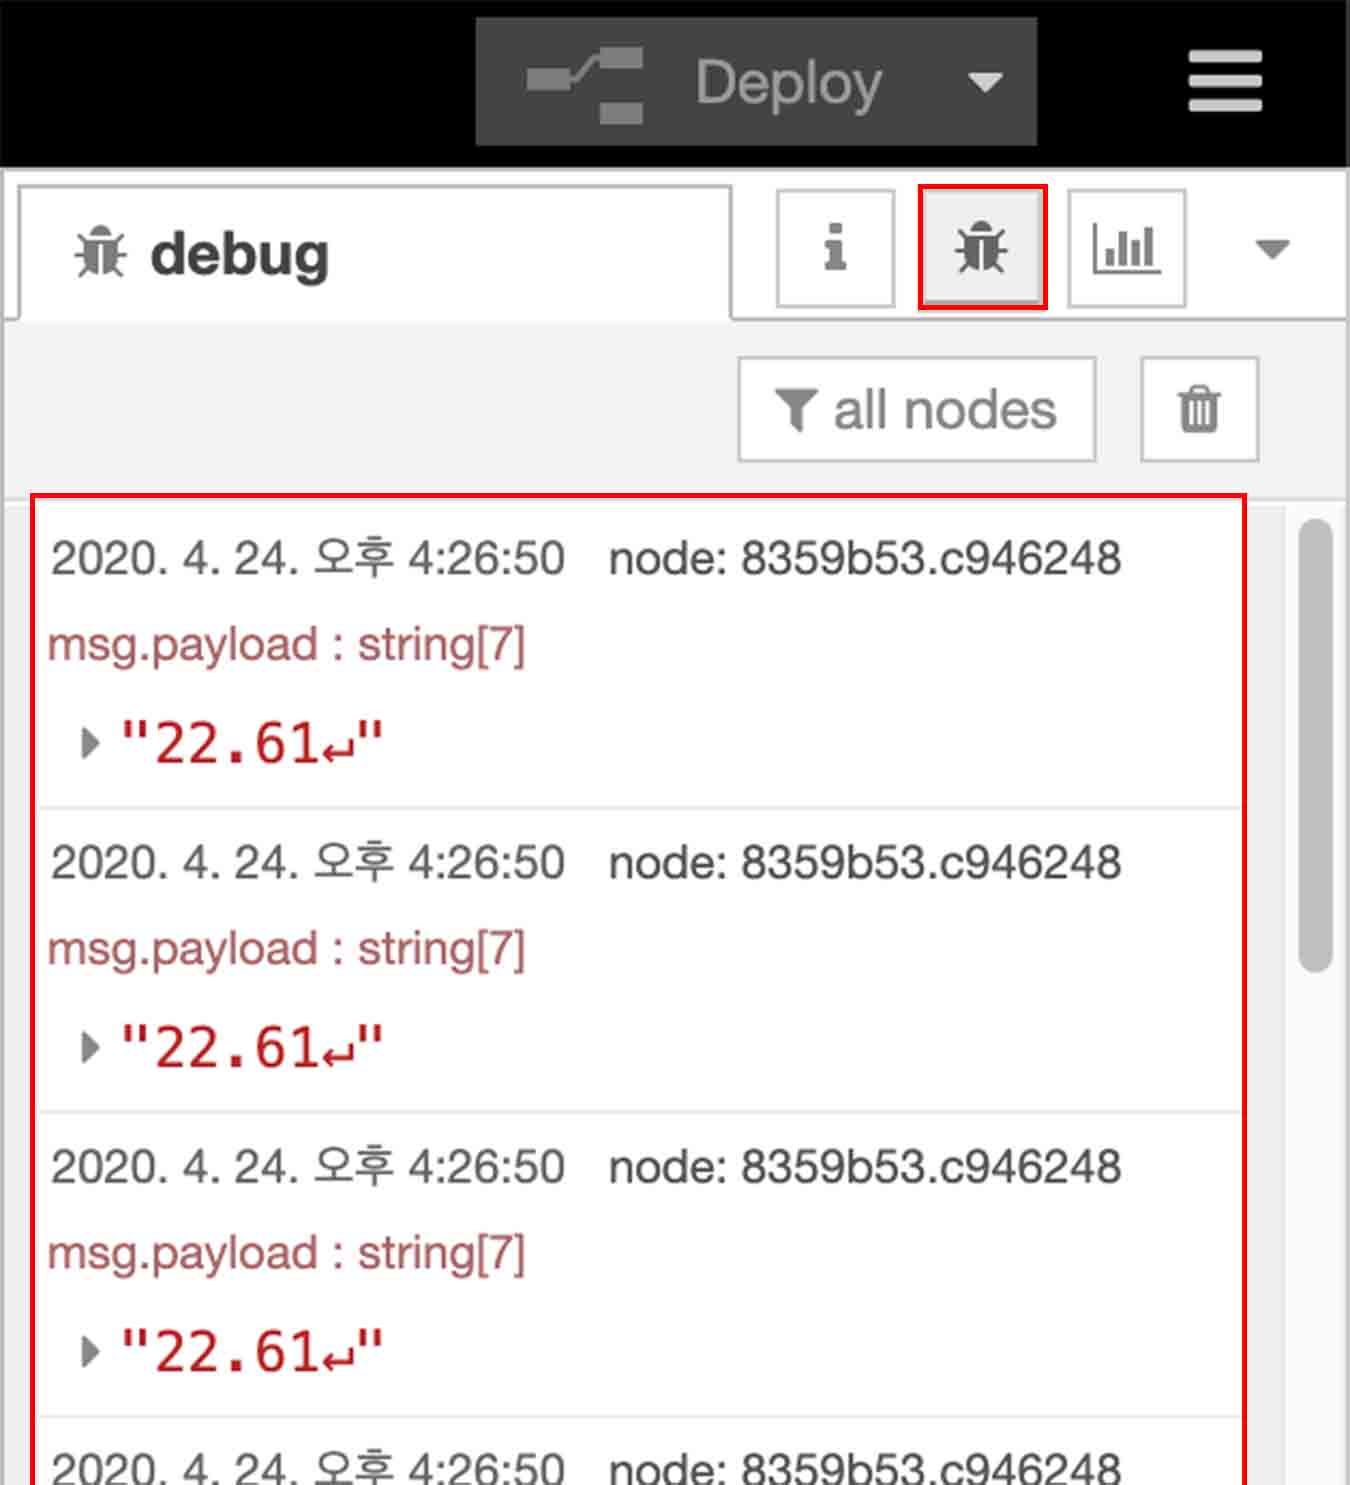
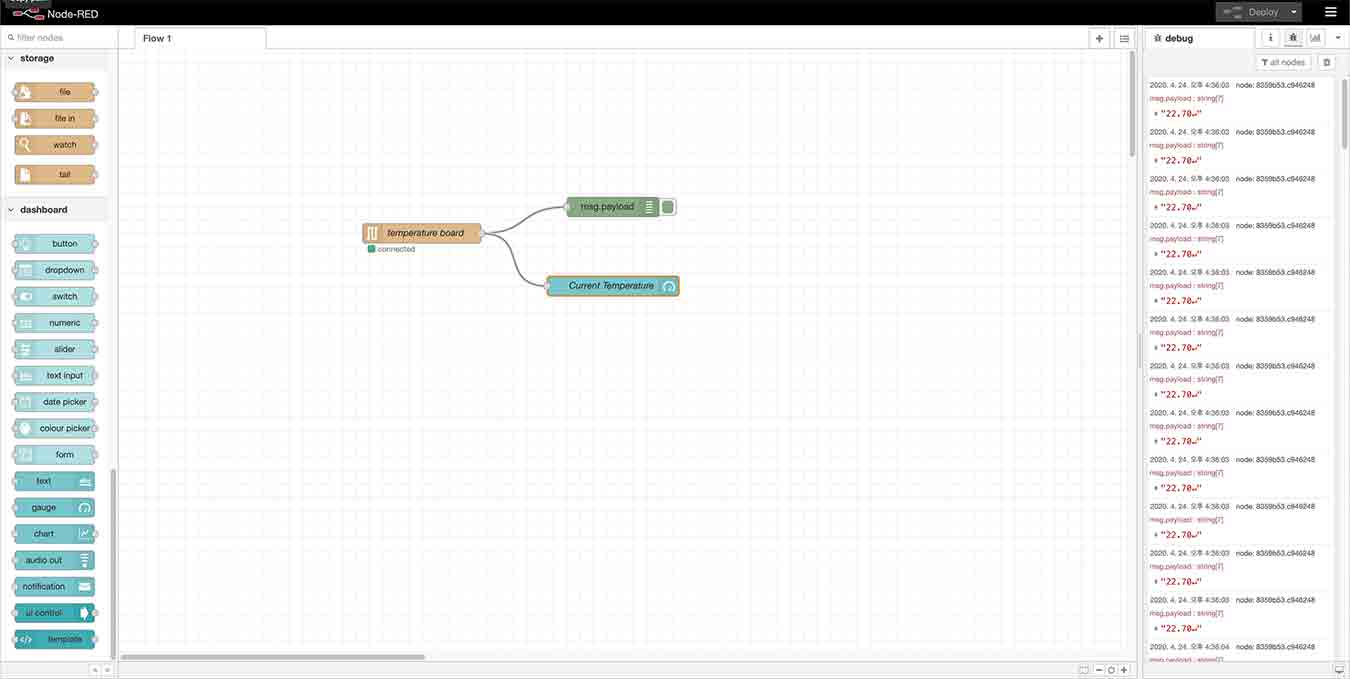
- Can see that the serials in the Arduino serial window appear in the node-red window.
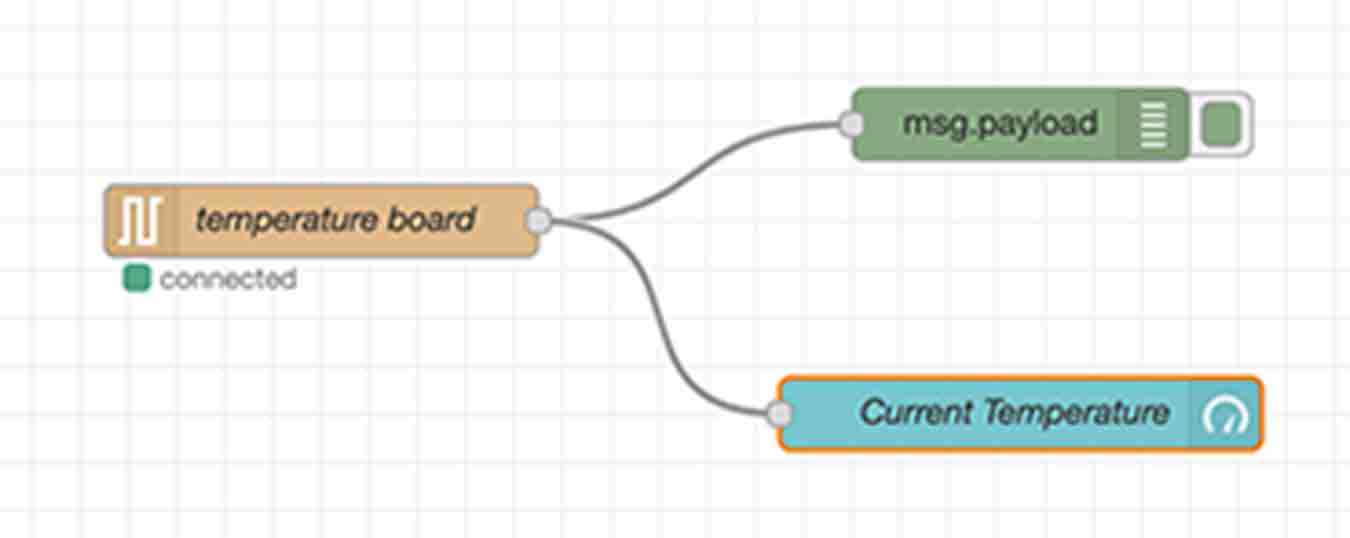
- Now it's time to show my serial values as a gauge to show them on the chart.
- Select a gauge from the dashboard category of the left nodes and connect it like this.
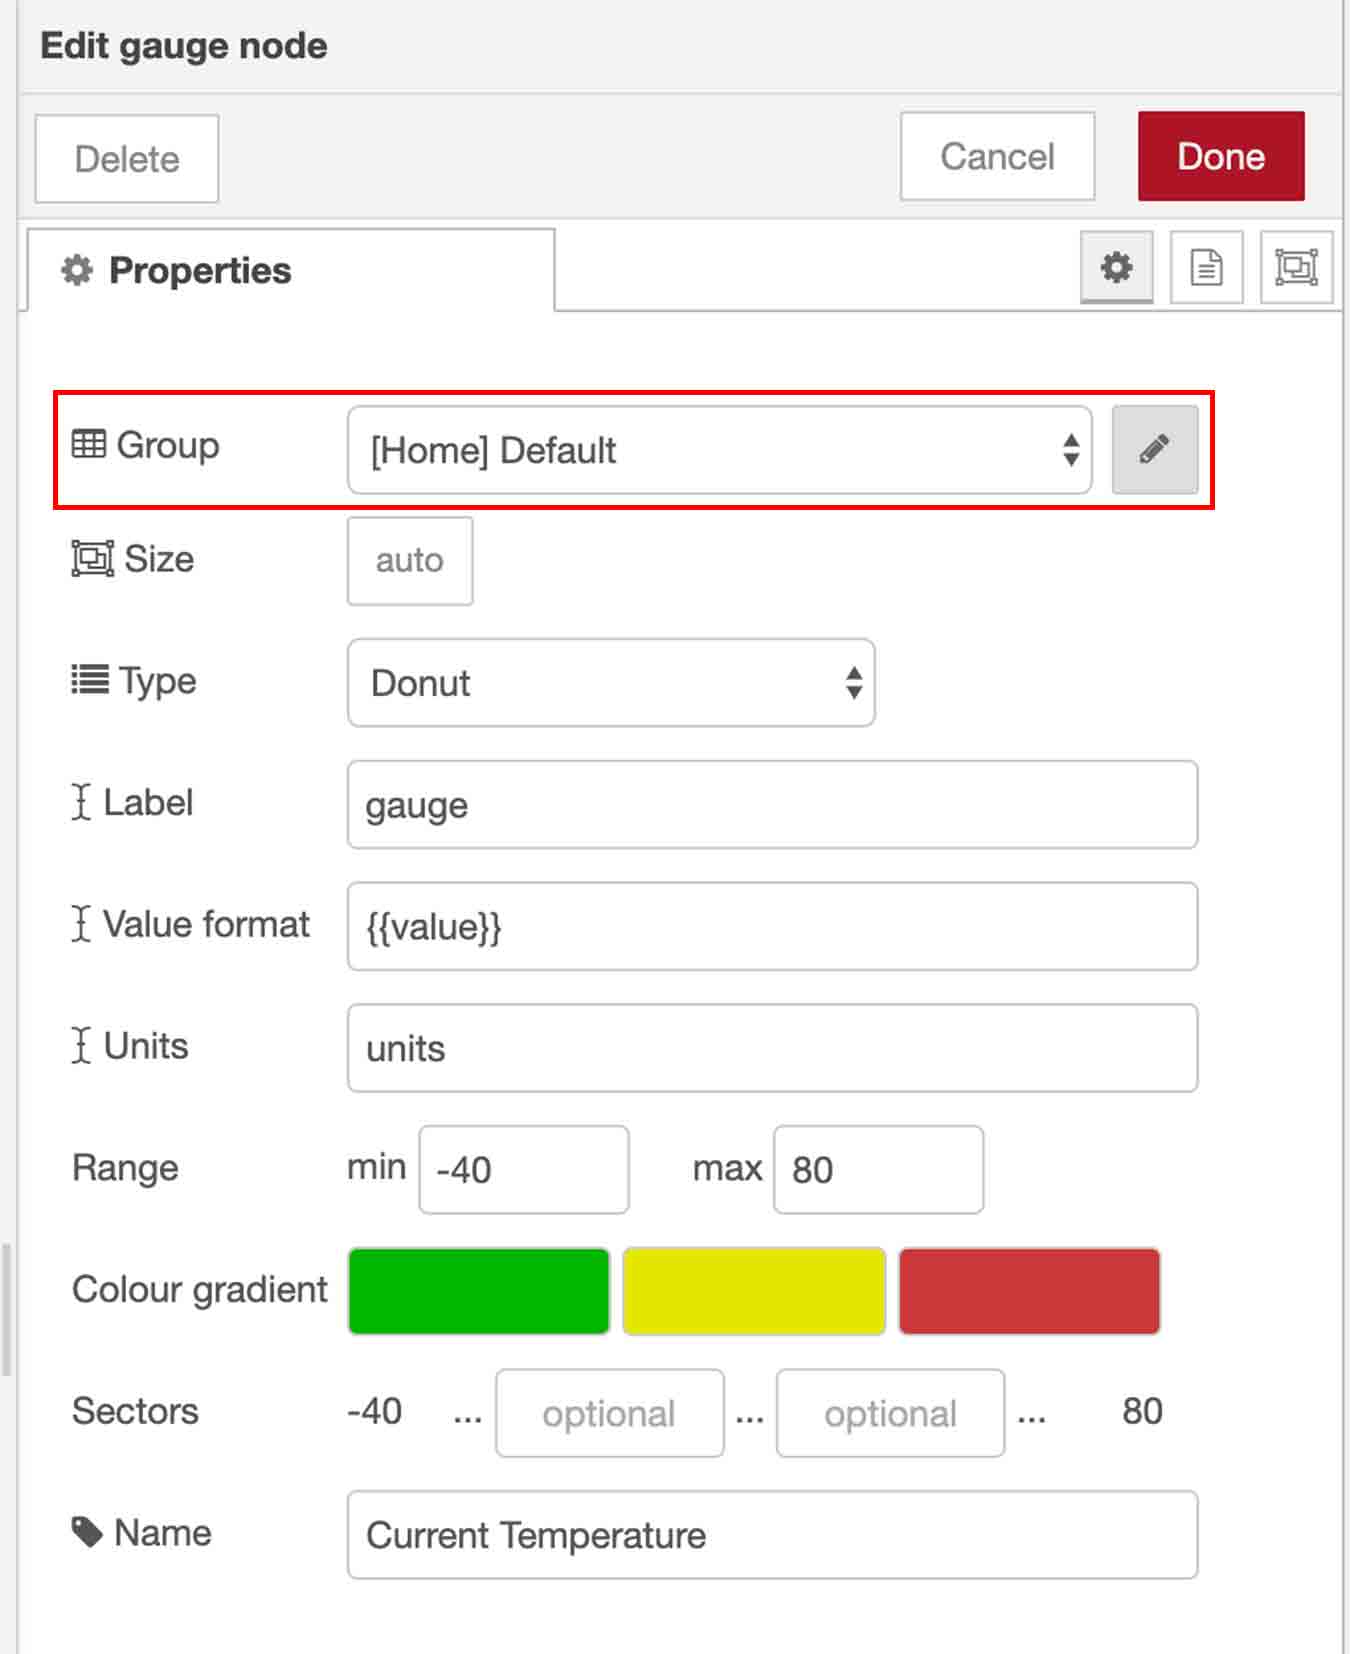
- And it changed the detailed properties of the gauge.
- The group must be set up.
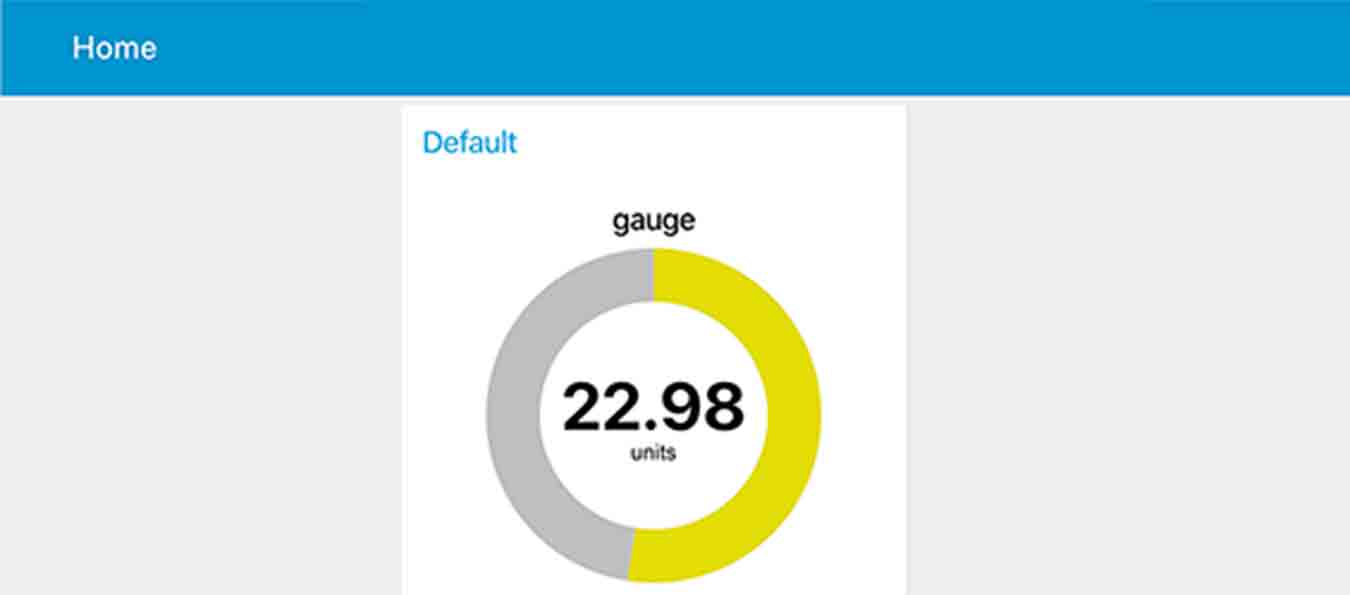
- Then, when you attach the ui to the back of the node-red link slash that first came in, the UI on the board appears.
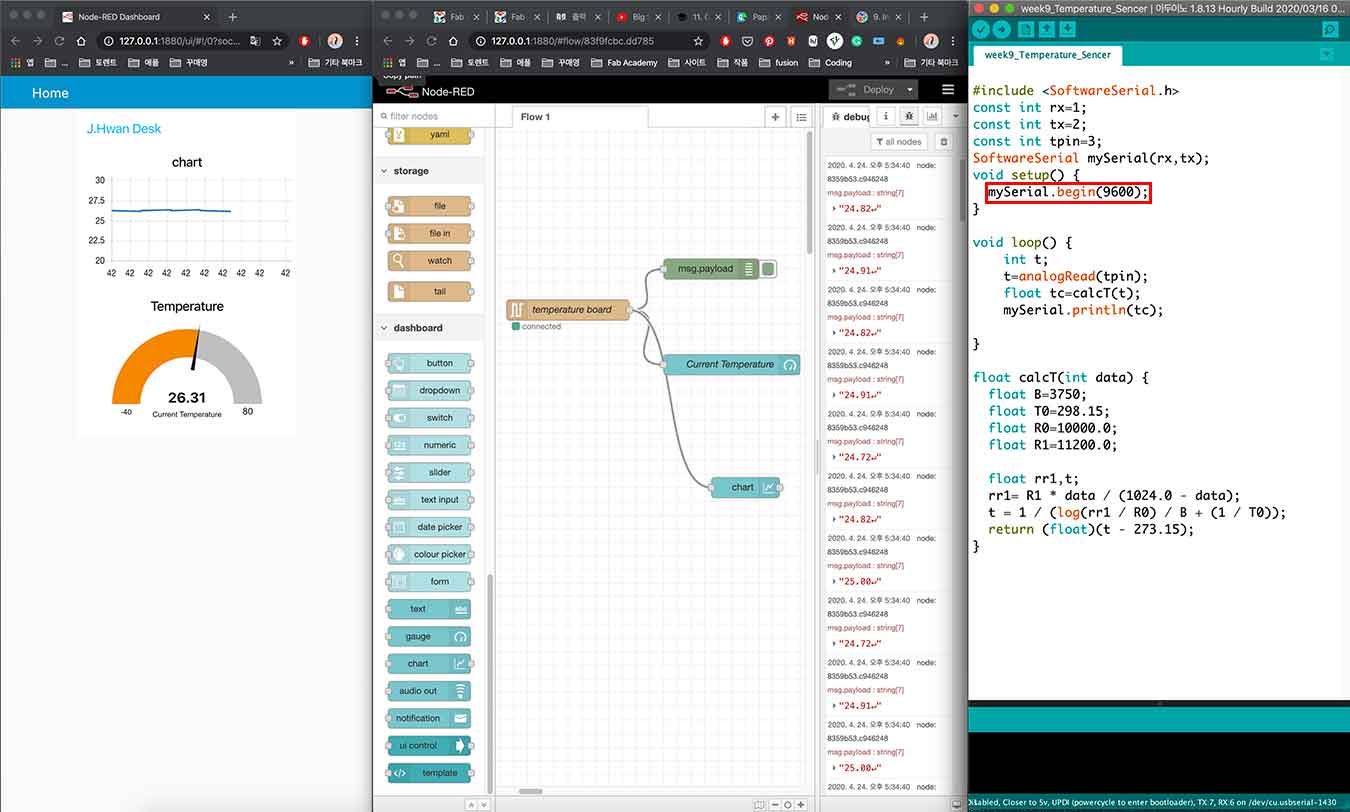
- It is a screen that has been added to the chart.

- When you place your finger on the temperature sensor, the screen changes immediately.
File
- Node-red File here
- Arduino File here