6. Electronics Design
- use the test equipment in your lab to observe the operation of an embedded microcontroller
Using oscilloscope
In Fablab Dillijan Mariam and Hrach used *** GW Instek GDS-1152A-U *** oscilloscope to observe microcontroller board operations.
This model is part of the *** GDS-1000A-U *** series and is known for its durable and user-friendly design.
Key features:
- MemoryPrime Technology: Maintains a high sampling rate (1 GSa/s) over longer time periods using a 2 Mega-point record length.
- Performance: 150 MHz bandwidth, 2 channels, and a 2.3 ns rise time.
- Display: 5.7-inch TFT color LCD with a resolution of 320 × 234.
- Connectivity: USB Host and Device ports for data logging and saving waveforms in formats such as CSV, JPEG, or video.
- Power: Supports universal 100–240 V AC input.

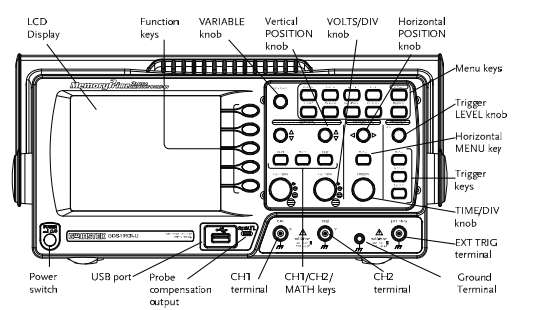
These are the main components from the oscilloscope explained (from this manual):
Observing I2C Communication
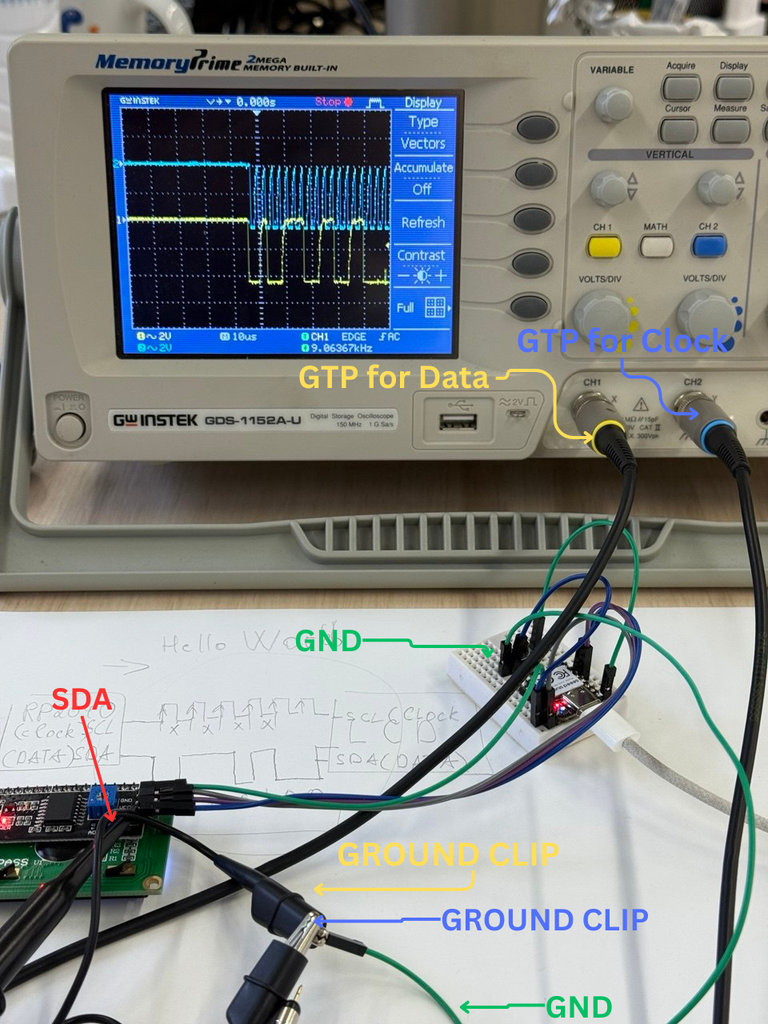
First, we wrote a simple program with Thonny for the XIAO RP2040 to send data via I2C to the LCD. It generates a counter signal. After uploading the code, we connected the RP2040 to the oscilloscope: the GND pin was connected to the probe’s Ground Connector, and the signal pin (SDA) was connected to the probe’s Grabber. This allowed us to observe the signal behavior and measure the timing directly on the oscilloscope.
Below is the code used for the test:
import machine
import time
from pico_i2c_lcd import I2cLcd # Ensure this file is on your Pico

# I2C configuration
I2C_ADDR = 0x27       # Common address; use i2c.scan() to confirm
I2C_NUM_ROWS = 2
I2C_NUM_COLS = 16

# Initialize I2C (Bus 0, SDA=GP0, SCL=GP1)
i2c = machine.I2C(0, sda=machine.Pin(0), scl=machine.Pin(1), freq=400000)
lcd = I2cLcd(i2c, I2C_ADDR, I2C_NUM_ROWS, I2C_NUM_COLS)

counter = 0

while True:
    lcd.clear()
    lcd.putstr("Counter: " + str(counter)) # Print current count
    print("Count:", counter)

    counter += 1
    time.sleep(1) # Wait 1 second
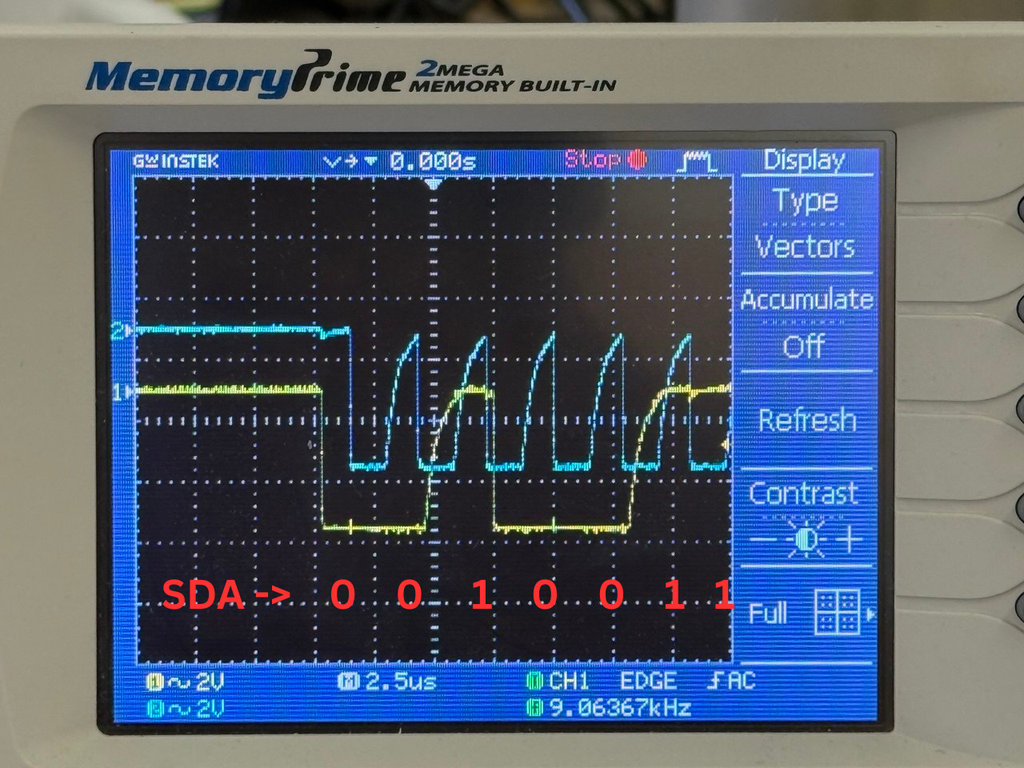
We manually decoded the data by looking at the diagram of the signals. The images above show the I2C communication signals as captured on the oscilloscope. This is a digital signal used to transmit data between the RP2040 and the LCD.
The pulses represent two synchronized signals:
Yellow trace (CH1): This is the SDA (Serial Data) line, which carries the actual data bits.

Blue trace (CH2): This is the SCL (Serial Clock) line. It acts like the “heartbeat” of the communication, telling the receiving device exactly when to read the data on the SDA line.
For example, the SDA data sequence (0 0 1 0 0 1 1) shows the binary interpretation of the pulses:
Logic 1 when the SDA pulse is high.

Logic 0 when the SDA pulse is low.

Note: SDA data is only considered valid and “counted” as a bit when the SCL clock signal is high.
In the bottom right corner, the oscilloscope shows a frequency of approximately 9.06 kHz, which is the rate at which these clock pulses are activated:
The full setup with labels:
Pin Toggle Test: Execution Speed
We also performed a pin toggle test, which is a standard benchmark used to measure the maximum execution speed of a microcontroller’s software and gives an idea of how fast the main loop runs.
In MicroPython, each line of code (for example, led.toggle()) must be interpreted by the processor. This introduces overhead, which limits how fast a pin can physically change its state. By toggling the pin as quickly as possible in a loop, we can measure the “raw” speed of the MicroPython interpreter on the RP2040.
Below is the MicroPython code used:
from machine import Pin, Timer

# Setup GPIO 15 as output
led = Pin(15, Pin.OUT)

# Define the toggle function
def toggle_pin(timer):
    led.toggle()
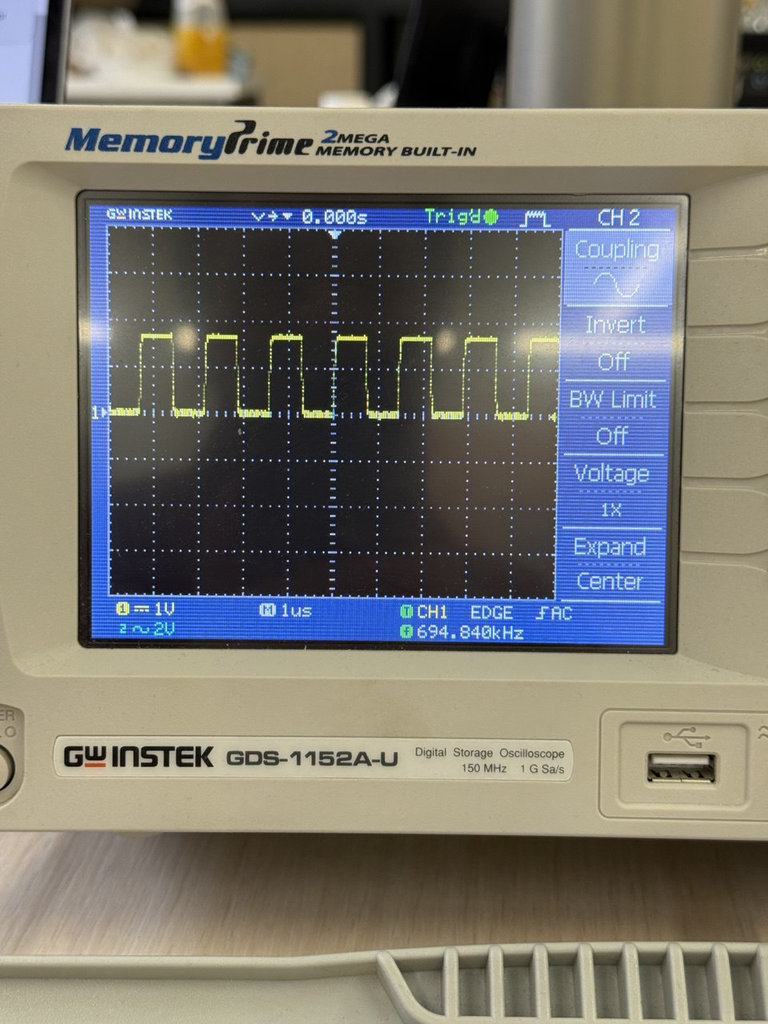
To compare, we performed the same toggle tests using C++ instead of MicroPython and achieved a maximum toggle speed of 1.55 MHz. This clearly demonstrates the difference in execution speed between interpreted MicroPython code and compiled C++ code on the RP2040.