FINAL PROJECT
EduCansat: The big picture
Below you’ll find the main slide that I prepared to present my EduCansat prototype. This summarizes the core of the project and what makes it unique. If you’re interested in the technical details, assembly steps, or educational resources, you can explore the other sections of this documentation.

EduCansat Project Video
Below you’ll find a short video that summarizes the essence of my EduCansat project. This video was created using AI tools to visually communicate the main features, educational impact, and hands-on spirit of the prototype. For more technical details and the complete development process, please check out the rest of this documentation.
Project Idea Sketch
What is EDUCANSAT?
A CanSat (short for Can-Satellite) is a miniature satellite built to fit within the size of a standard soda can (350-500ml). It is commonly used in educational settings to introduce students to space technology, satellite communication, and telemetry systems in a hands-on, cost-effective way.
Phases and Activities
Phase 1: Preparation and Initial Testing (April)
- April 24-28: Materials confirmation and workspace organization
- April 28-May 1: Schematic design and PCB design final adjustments
Phase 2: Integration and Software Development (May 8-20)
- May 1-5: Integration of GPS, solar radiation, temperature, pressure, humidity sensors
- May 3-9: Programming the Ground Station display and data acquisition
- May 7-12: Wireless communication setup between CanSat and Ground Station
- May 12-15: Initial complete system testing
Phase 3: PCB Fabrication and Prototyping (May 1-7)
- May 15-18: Fabrication of development board (PCB)
- May 18-20: Assembly and soldering
Phase 4: Testing, Debugging and Final Adjustments (May 21-27)
- May 20-24: Field testing and adjustments
- May 20-26: Final fixes, documentation, and backup plans
Phase 5: Contingency and Delivery (May 28 - June 2)
- May 26 - May 28: Target final delivery
- May 28-June 2: Contingency days for unexpected issues
-
📡 Real-World Applications
CanSats provide experience in data collection, telemetry, and satellite operations.
-
🛠️ Modular & Scalable
CanSats use real satellite principles but on a smaller scale, making them affordable and practical for students.
-
🚀 Launch & Recovery
CanSats are deployed using rockets, drones, or balloons to simulate real satellite missions. In my case I will use a ballon for deploy
-
Hands-on experience
Hands-on experience with electronics, sensors, programming, 3d design and data transmission
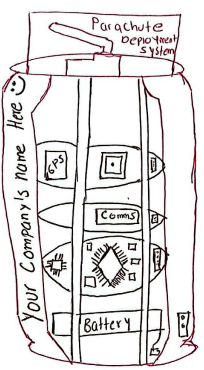
🛰️ CanSat Full Design
This is the preliminary design of the CanSat, including its modular structure and essential components. The design follows a compact form factor to fit within a standard soda can, ensuring lightweight and efficient deployment.
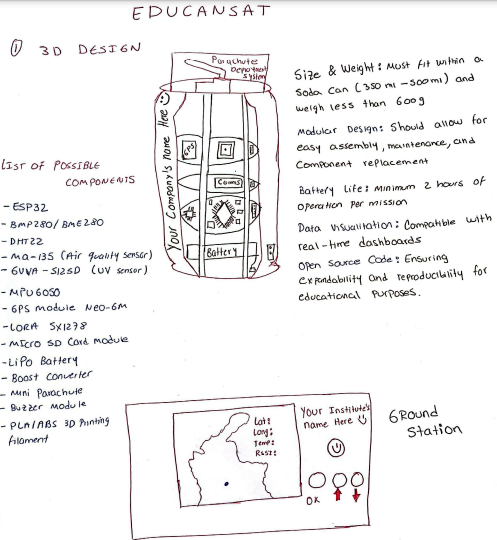
Cansat Module Structure
A compact satellite-in-a-can that collects and transmits data, including
- Temperature
- GPS Location
Designed with modular construction, allowing for easy assembly, maintenance, and component replacement.
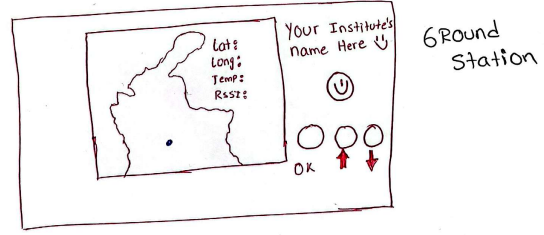
Cansat Ground Station
The Ground Station is a 3D-designed system that enables visualization of all environmental variables measured by the CanSat. It provides real-time tracking of the CanSat’s location in the field, ensuring accurate data collection and analysis.
Bill of Materials
| Component | Model/Type | Description | Quantity | Notes |
|---|---|---|---|---|
| Microcontroller | XIAO ESP32-C3 | Main control unit | 1 | For all logic, processing, and comms |
| GPS Module | NEO-M8N | Receives geographic position data | 1 | Connected via UART |
| Temperature Sensor | BMP280 | Used for temperature only | 1 | I2C connection, pressure not used |
| LoRa Module | RA-02 | Long-range wireless communication | 1 | SPI interface |
| Voltage Regulator | LM2596 | Buck converter for power supply | 1 | Steps down voltage for safe operation |
| Battery | BRC18650 (3.7V) | Lithium-ion battery cell | 2 | Connected in series for 7.4V |
| Custom PCB | - | Custom-made circuit board | 1 | Designed and milled for this project |
| 3D Printed Case | PLA | Custom enclosure for components | 1 | Provides mechanical protection |
| Foam Padding | - | Impact absorption | as needed | Bottom and sides of enclosure |
| Male & Female Headers | - | For modular stacking/connection | as needed | Used between CanSat stages |
| Fixed Battery Connector | - | Secure connector for battery | 1 | Prevents accidental disconnection |
| Wiring & Assembly | - | Internal wiring and fasteners | as needed | For secure assembly |
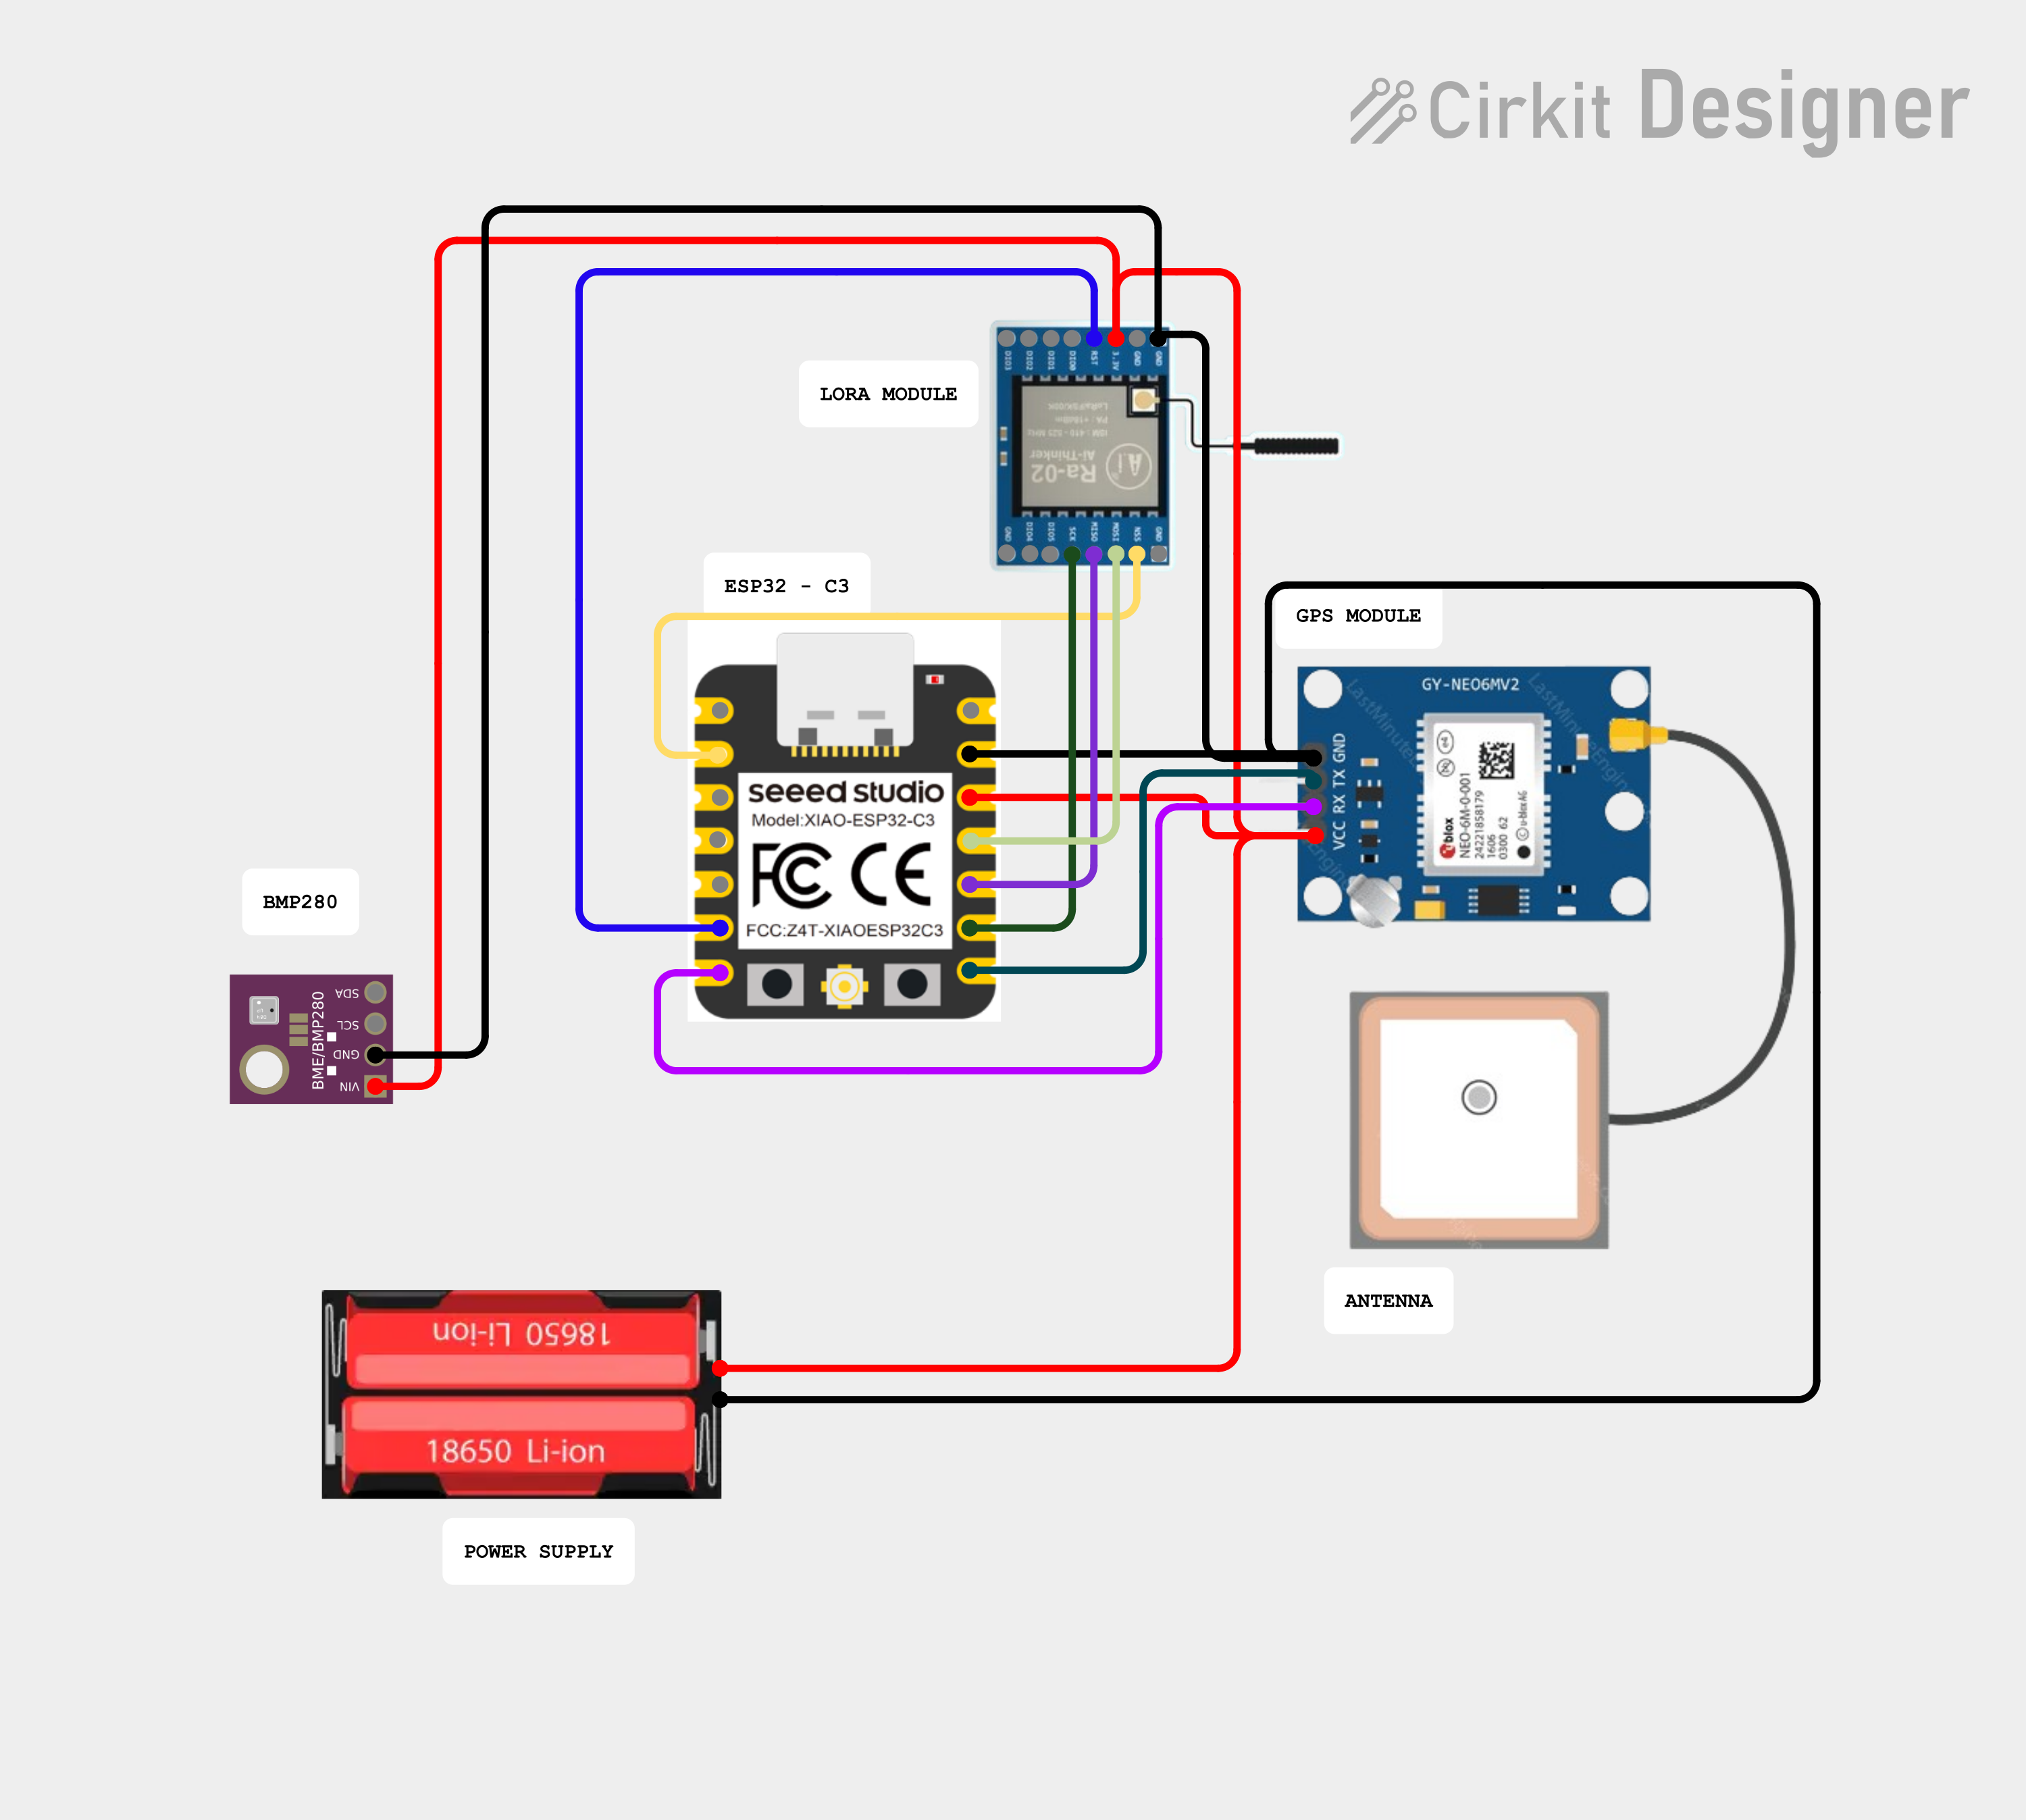
System Diagram
System integration involved connecting all the electronic modules of EduCanSat: the microcontroller, sensors (such as temperature, pressure, and GPS), LoRa communication, and the power supply. Each component was tested individually, and then as part of the complete system to ensure seamless operation.
Weekly Contributions to the Final Project
Throughout the course, each week's activities have significantly contributed to the development of the EDUCANSAT project. Below is a summary of how the skills and knowledge acquired have been integrated:
- Week 1: Defined the preliminary idea for EDUCANSAT, planned the project structure, and organized documentation.
- Week 2: Modeled early versions of the CanSat and ground station in 2D and 3D design tools.
- Week 4: Manufactured the first PCB to gain experience for later custom boards.
- Week 5: Designed basic circuits and PCB layouts for sensor integration. Included circular pcb for CanSat.
- Week 6: Practiced embedded programming, debugging, and microcontroller interaction.
- Week 7: Acquired skills in CNC machining for structural components.
- Week 9: Integrated input devices. It Will be useful for integrate CanSat's Sensors
- Week 10: Worked with output devices for visual feedback and actuation.
- Week 11: Learned about networking and communications between multiple devices.
- Week 14: Learned about interface and application programming
- Week 15: How I can integrate all the components in a same system
Each assignment progressively strengthened the technical foundation required to implement the EDUCANSAT project successfully.
Design and Fabrication of the PCB
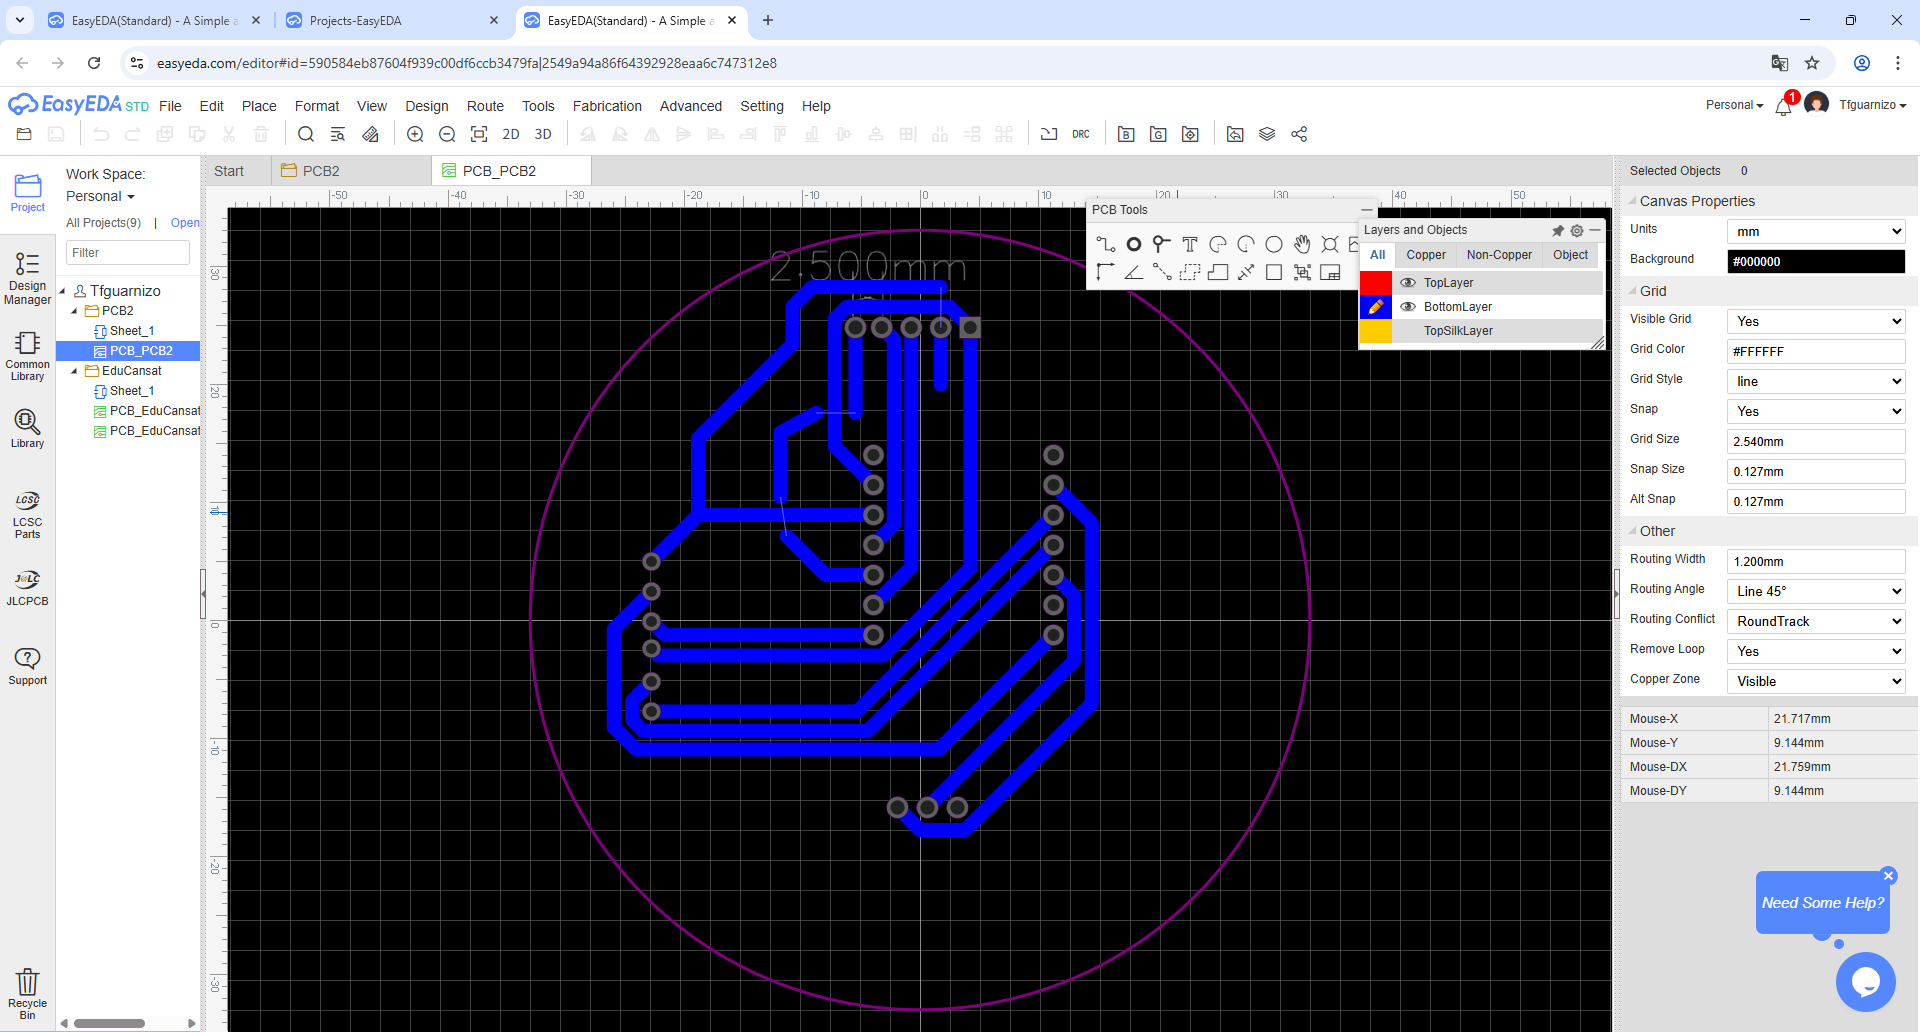
a. Electronic schematic and PCB layout
The PCBs for EduCanSat were designed using EasyEDA and, in some cases, directly in Fusion 360. The board layout features only the necessary traces and holes for the components, focusing on minimizing size and maximizing modularity. Each PCB is single-sided and was designed to be stackable using L-shaped female connectors and matching male headers. This allows the entire assembly to remain compact and easy to integrate with the rest of the system.
b. PCB milling or manufacturing
The PCBs were manufactured in-house using the Makera Carvera CNC milling machine. I prepared the G-code from the design files and carefully set up the milling process, ensuring proper alignment for each board. Throughout the process, I took several photos and videos to document key steps, including the setup of the CNC, the milling in progress, and the final result just after cutting.
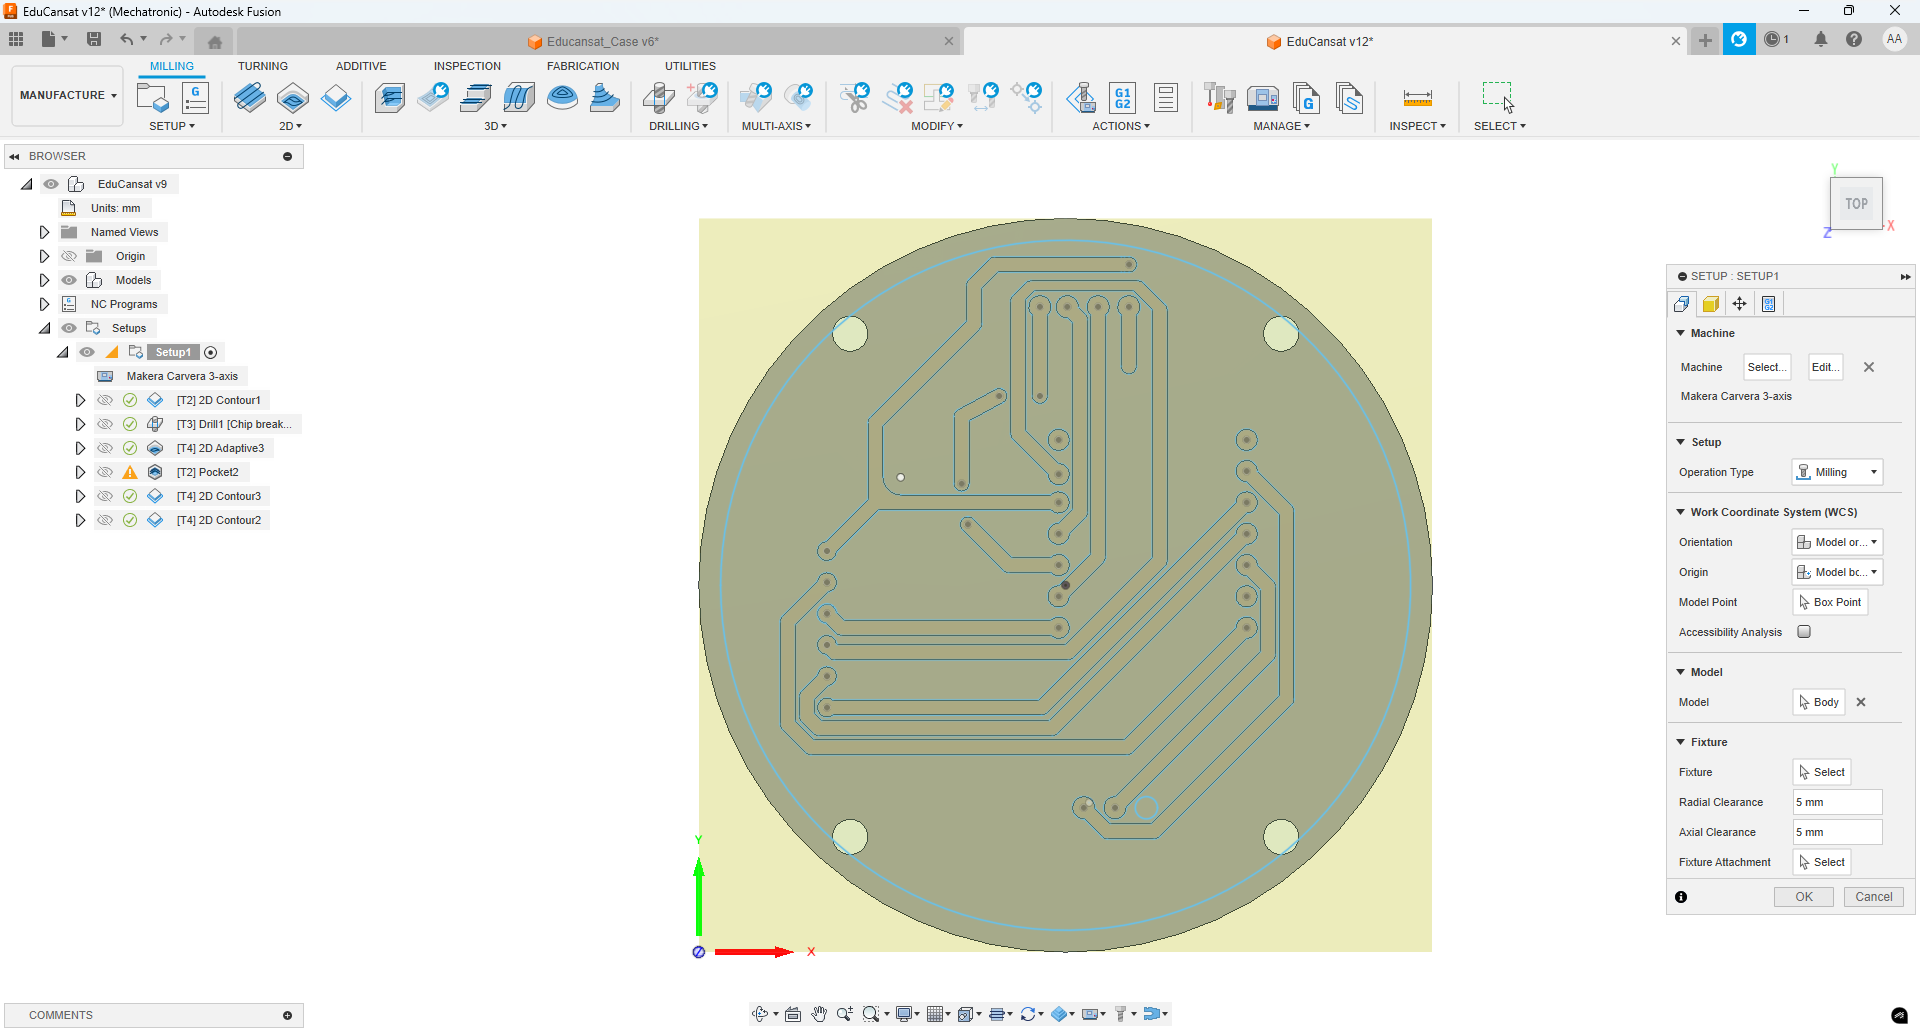
This simulation in Fusion 360 demonstrates the complete PCB milling process. It visually represents how the CNC tool moves along the board, accurately removing the unwanted copper areas and leaving behind the final tracks and pads according to the design.
The following video shows a simulation of the PCB milling process in Fusion 360. In the video, you can see how the CNC machine gradually removes all the excess copper from the board, leaving only the tracks needed for the circuit.
c. Soldering and assembly of components
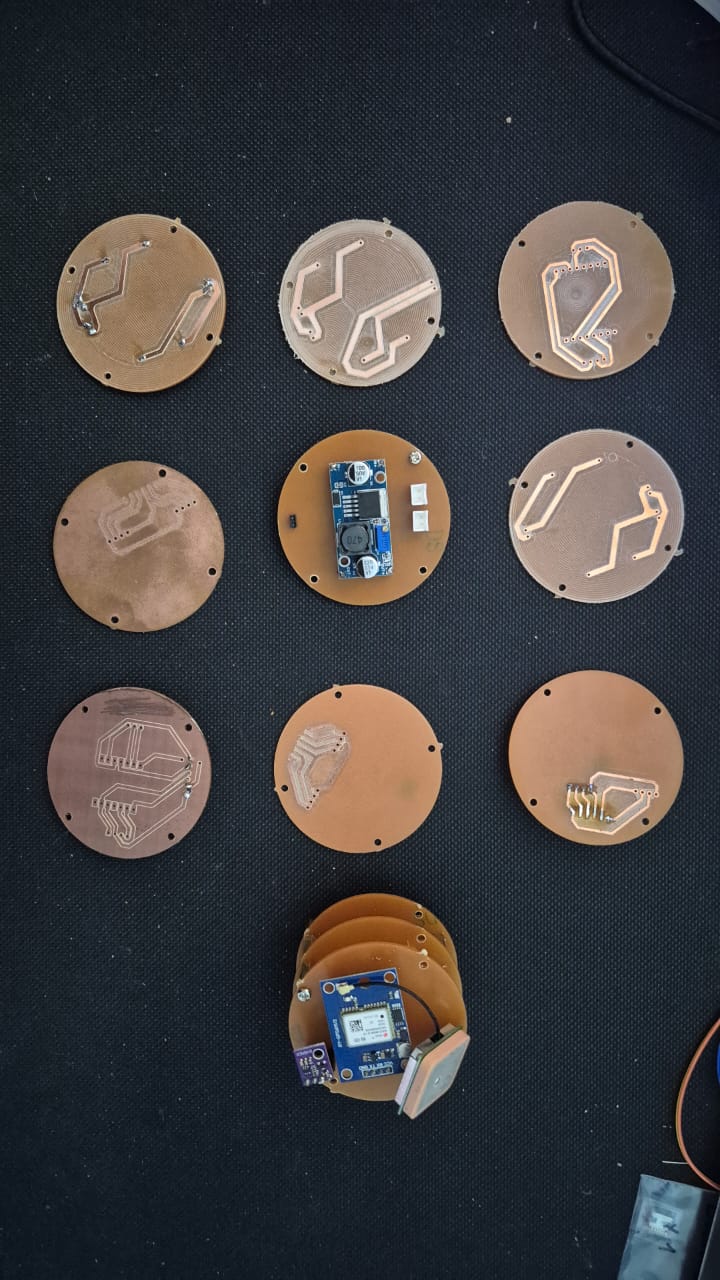
Soldering was done manually using a soldering iron and tin. I produced several PCBs in order to perfect the alignment between them and ensure that all headers and connectors fit properly for modular stacking. Images and videos show the step-by-step process of soldering and assembling the components on each board, as well as the final assembled stack. The main challenge was aligning the PCBs so that all connections were reliable and the stack remained robust.
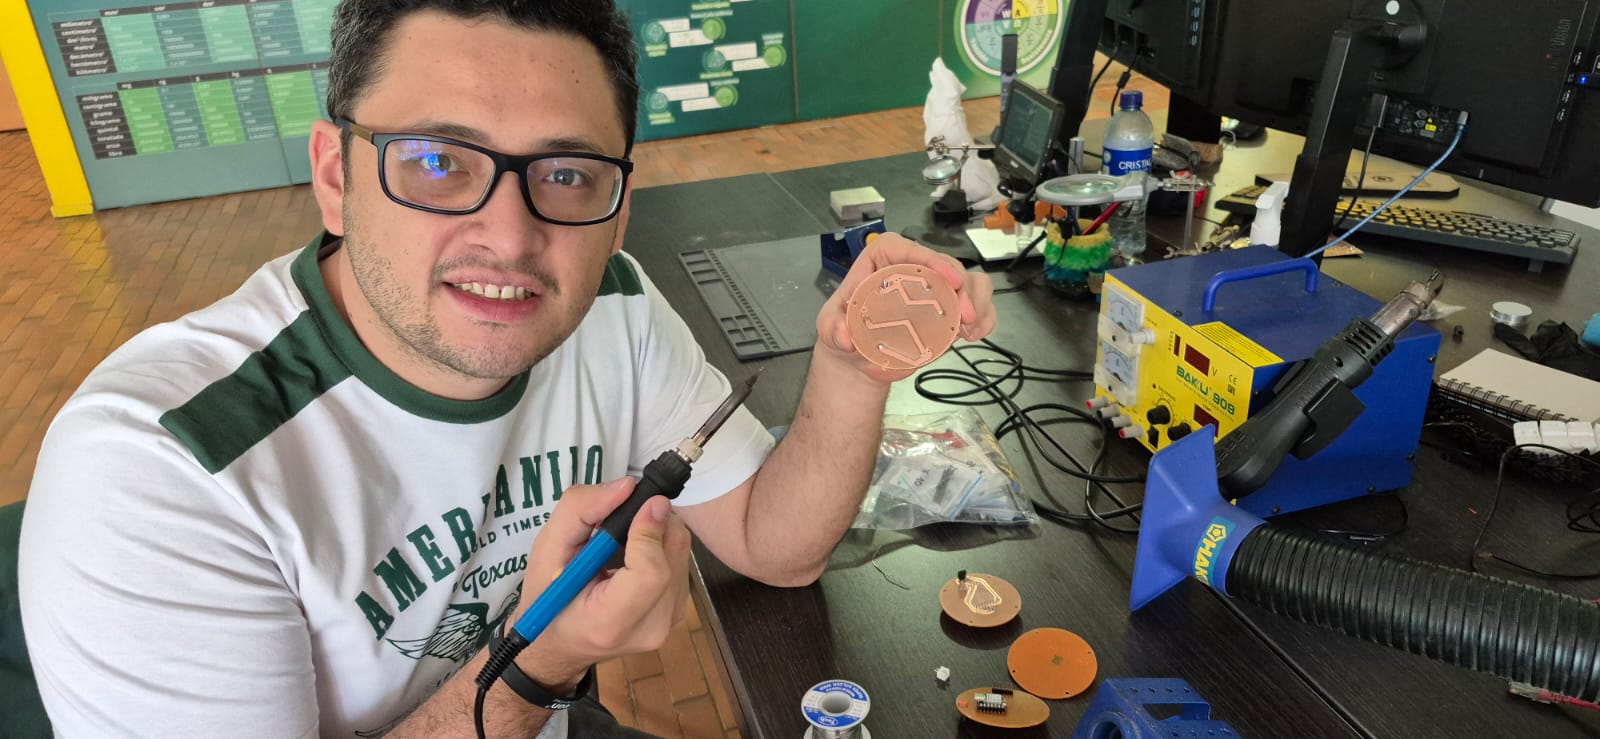
In total, I fabricated more than 24 PCBs in order to understand how they could be properly aligned. Once finished, it was necessary to rotate each board 180 degrees so that the components on every PCB would always be oriented upwards.
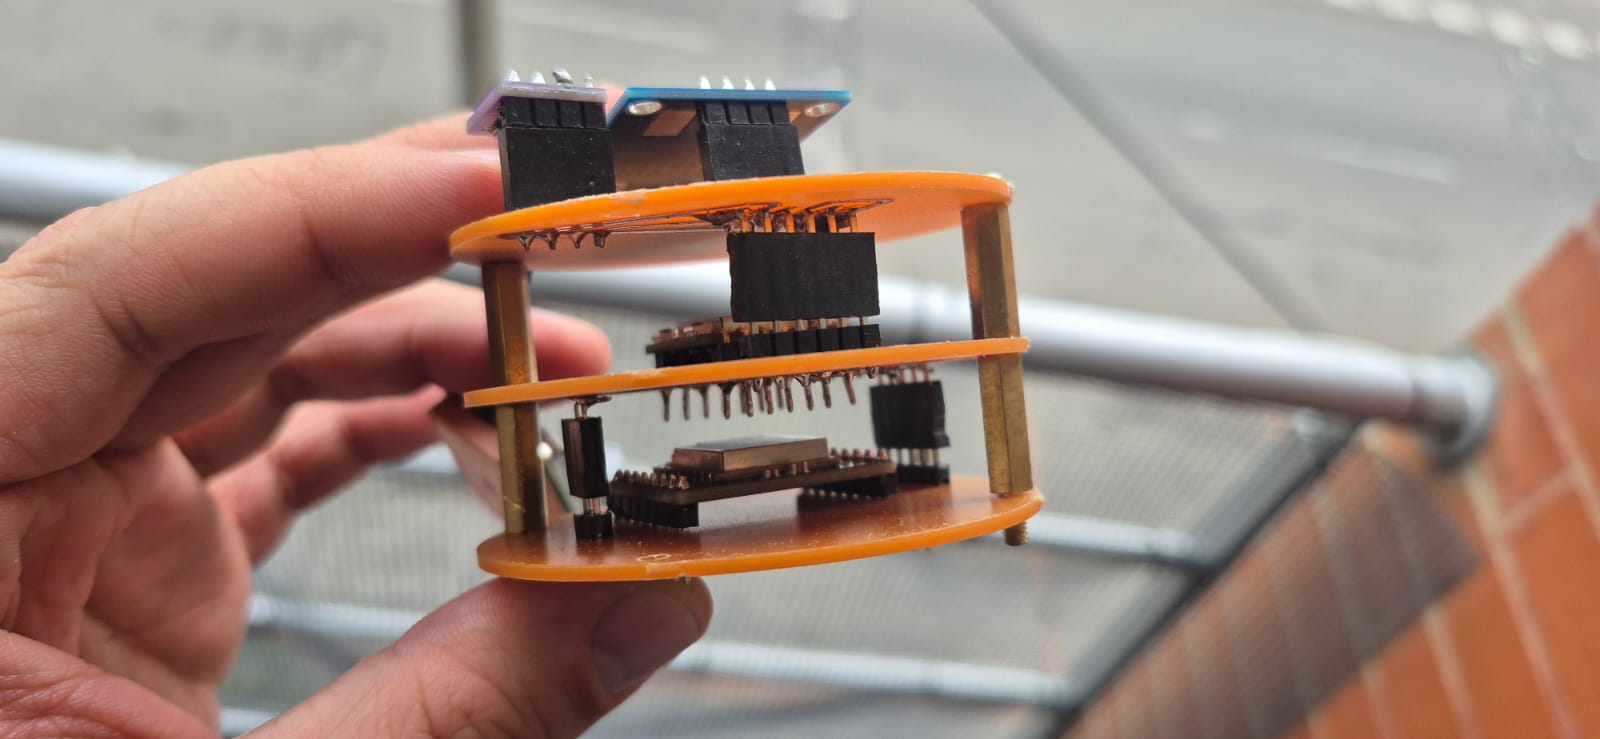
Here you can see the entire electronic system assembled and interconnected. This image shows only the physical design of the CanSat.
Case/Enclosure Design and Construction
a. 3D design and modeling
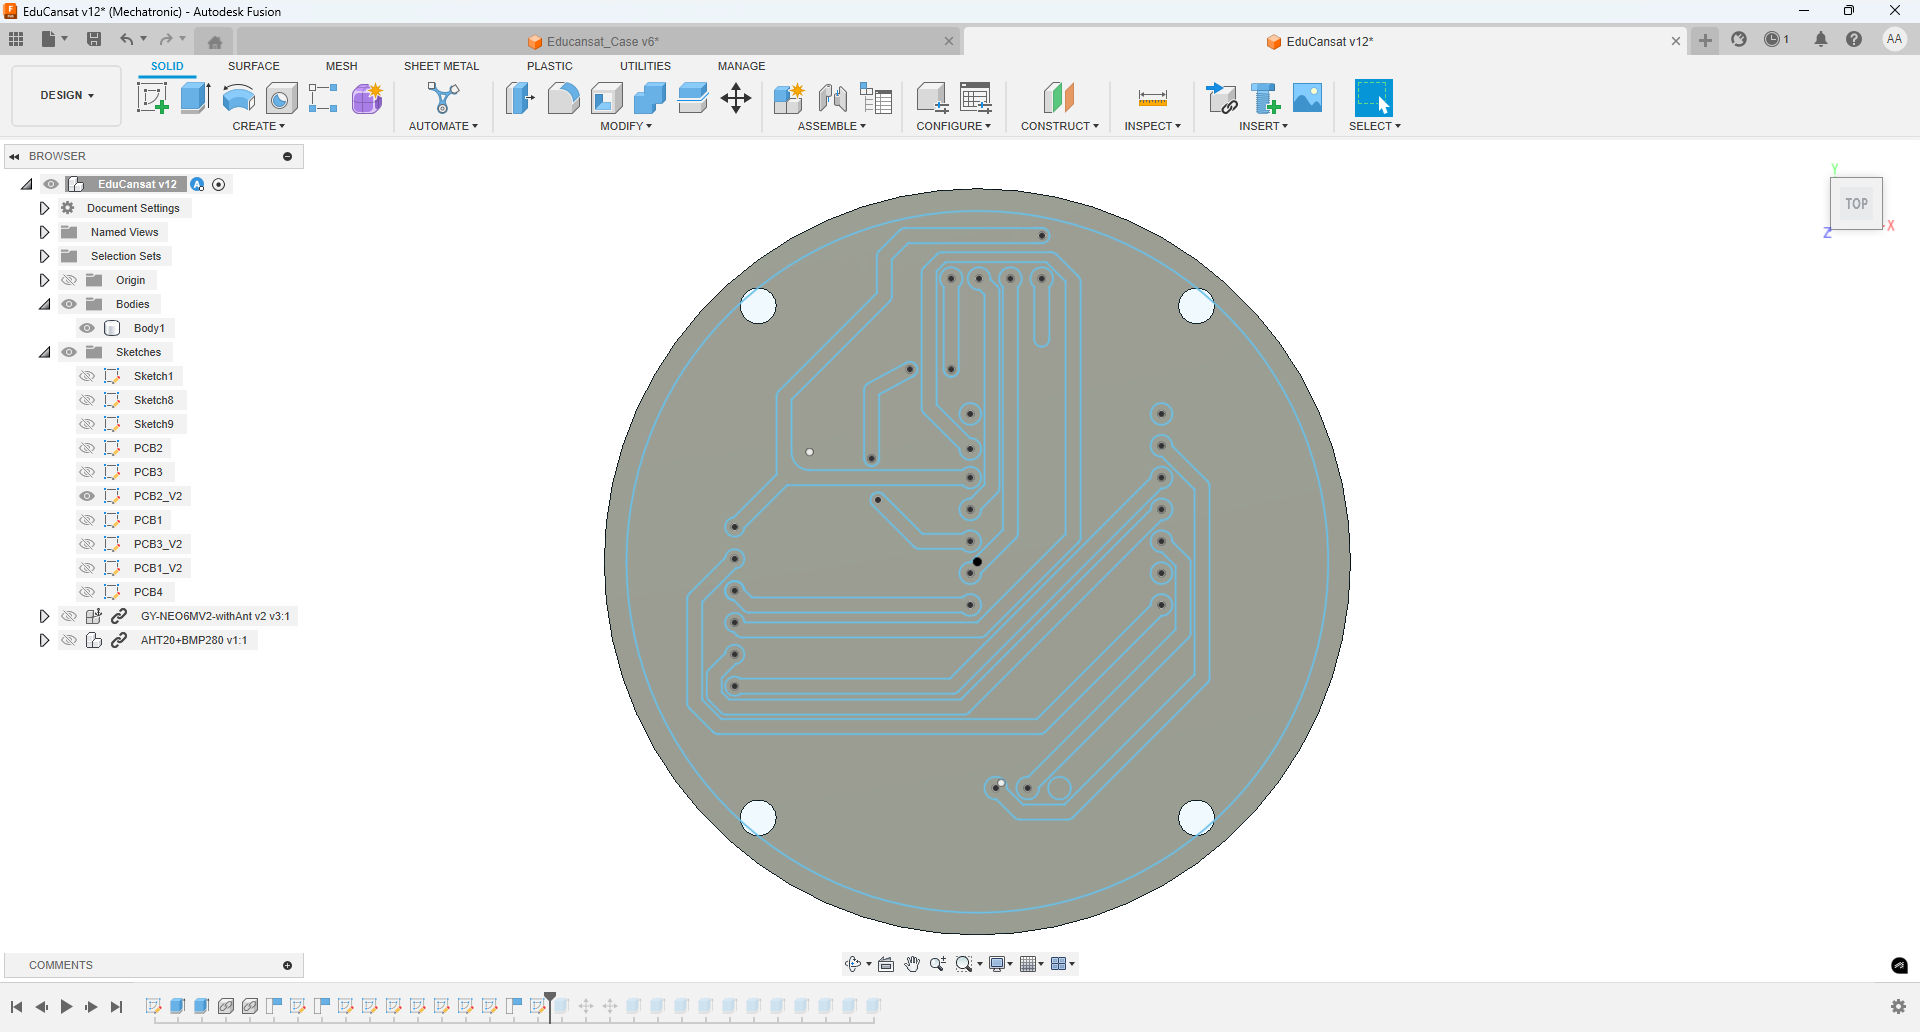
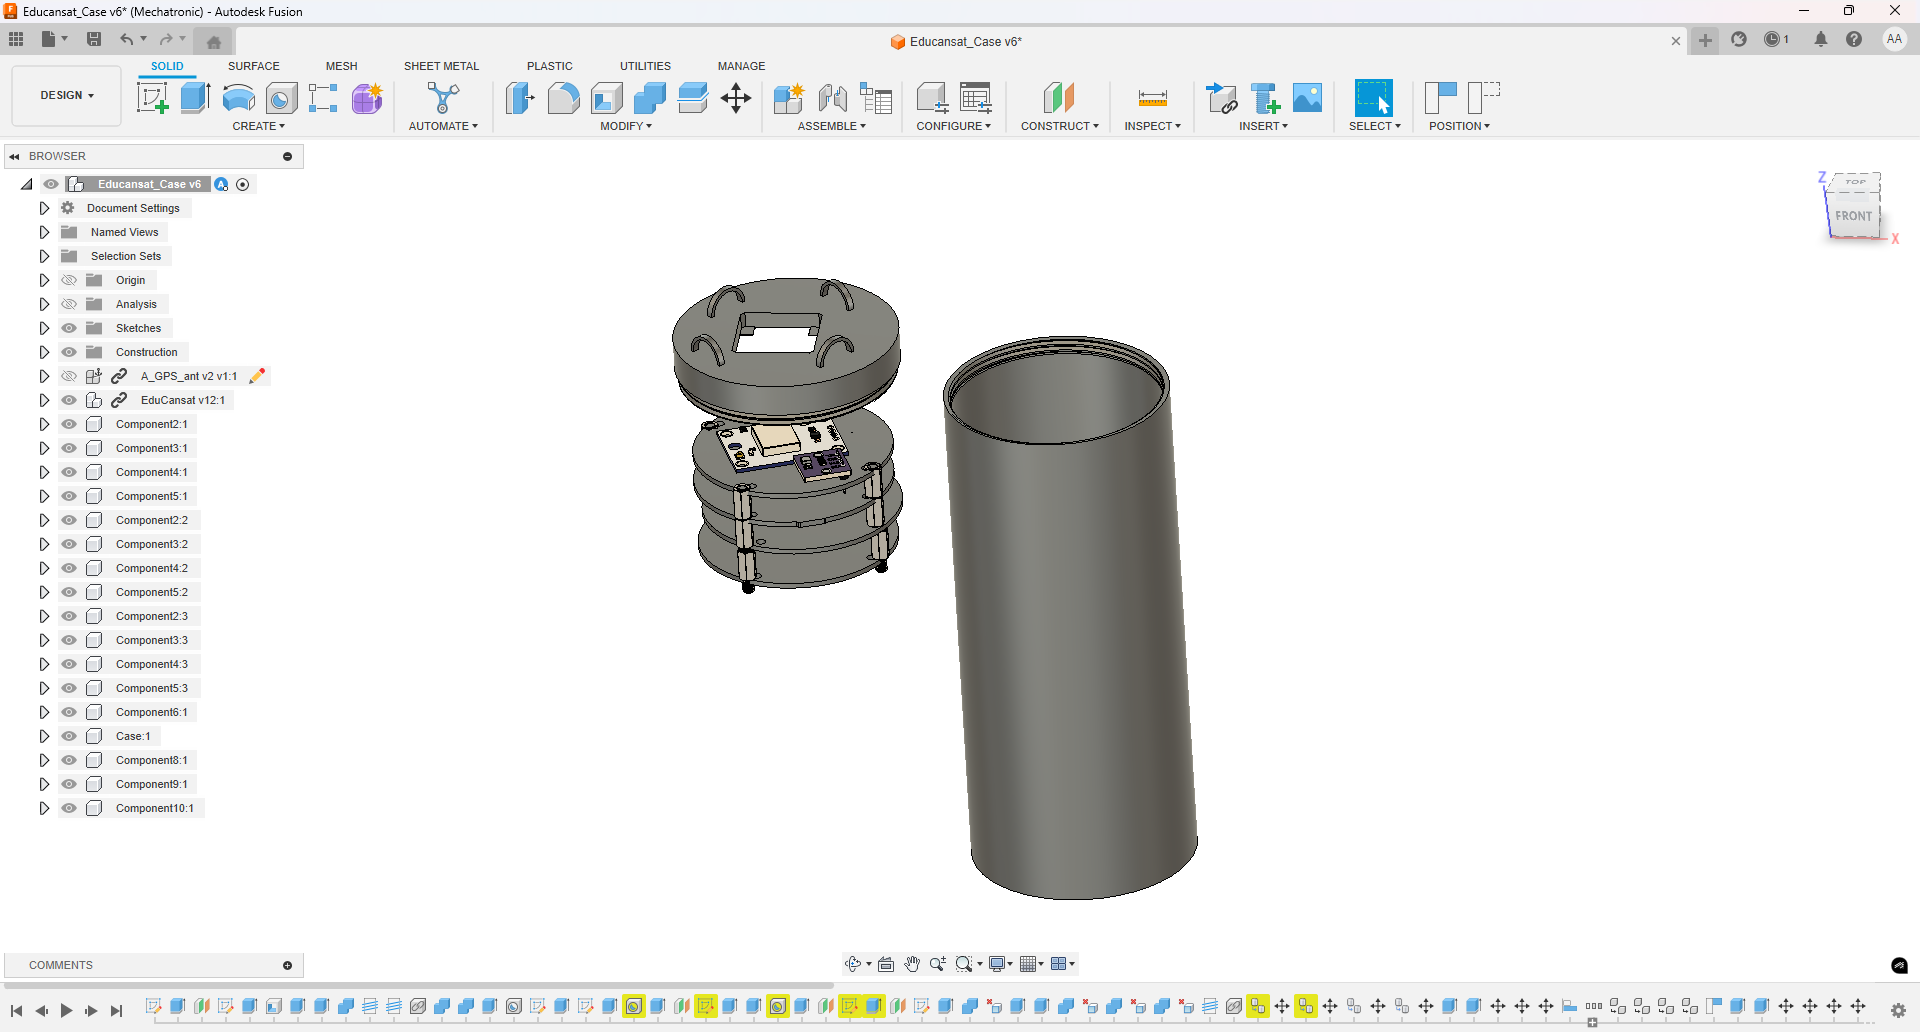
The case for the CanSat was designed in Fusion 360. The 3D model was created to fit all the electronic modules and the battery, with special attention to compactness and protection. The bottom part of the case was made thicker to help absorb impacts. I designed internal tabs, located about halfway up the enclosure, to ensure that the electronics and PCBs would not collide with the batteries. The final design also includes external exits for the GPS and LoRa antennas.
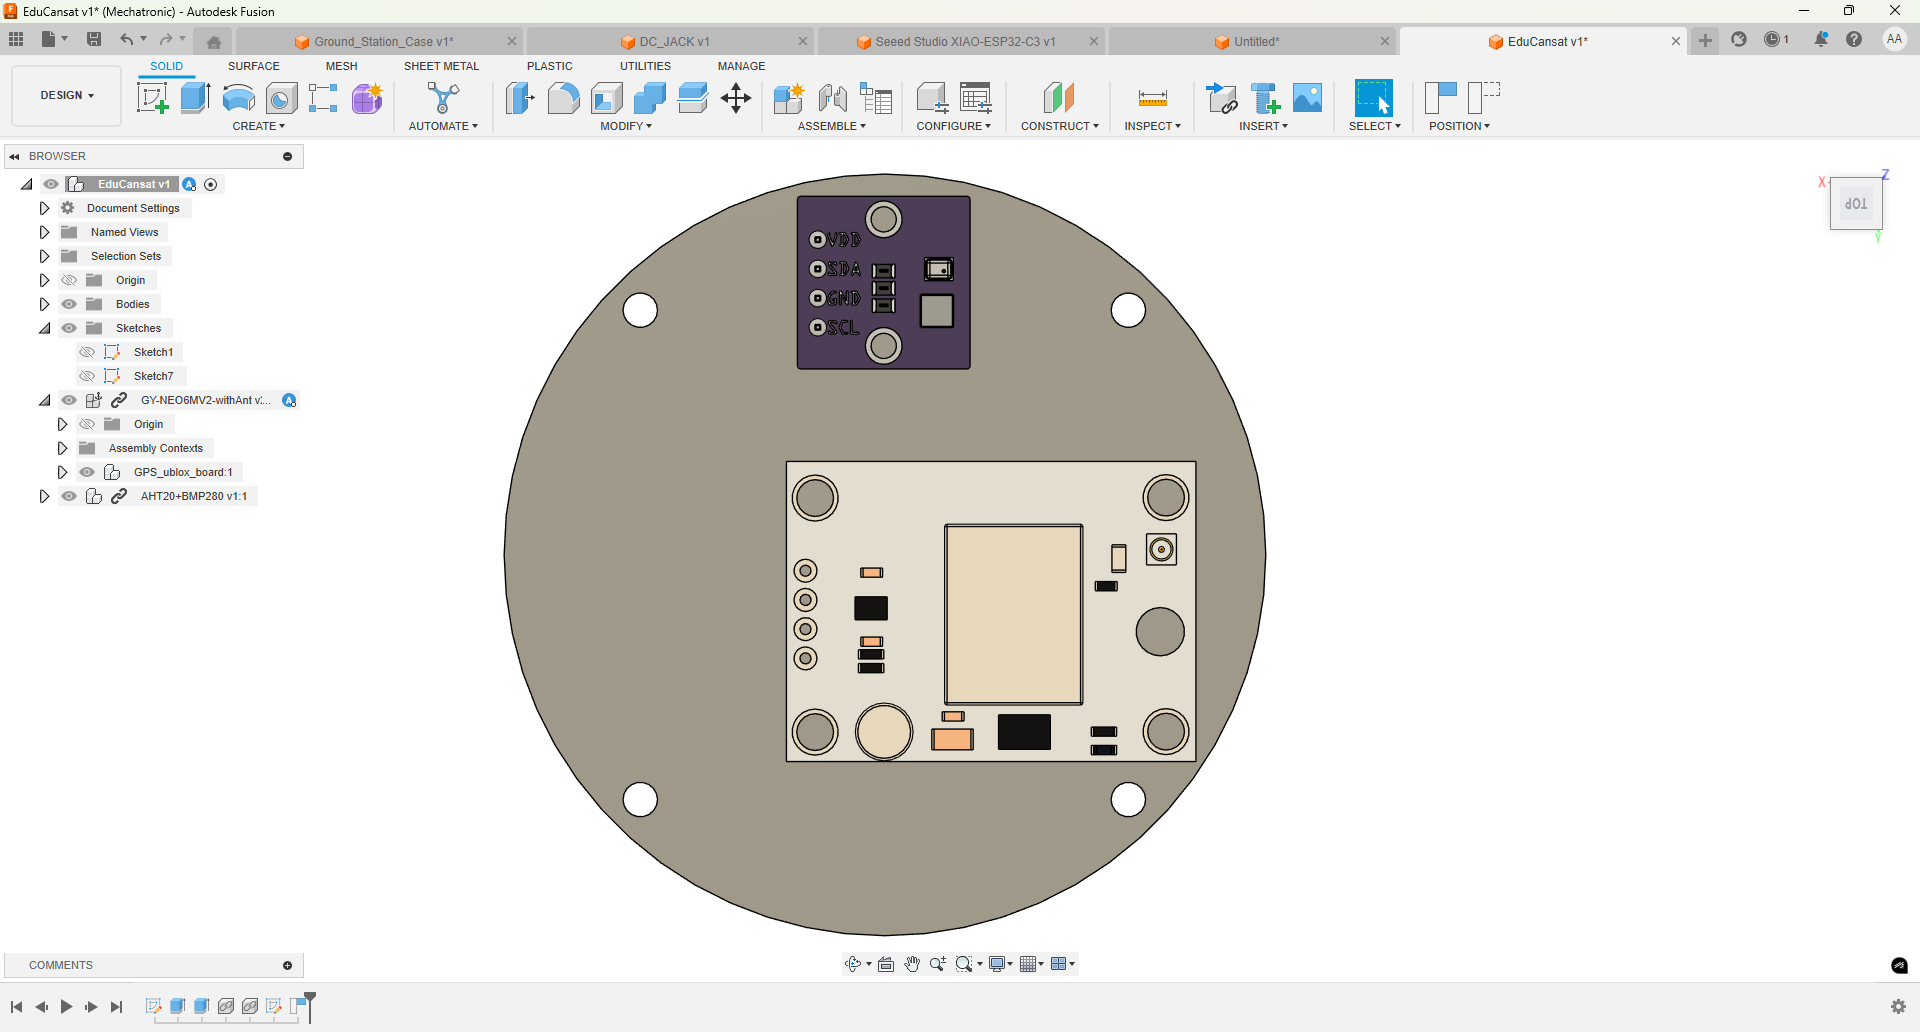
In this image, you can see the integration of all the PCBs within the enclosure. I also used 3D models to accurately measure and project the possible heights of the electronic components on the PCBs, ensuring a precise and reliable fit inside the case.
b. 3D printing or fabrication
The enclosure was 3D printed using PLA material on an Ender 3 V2 printer. Maintaining the correct tolerances was essential to ensure that all parts fit together precisely. The main challenge was to guarantee that the slots for the PCBs and internal components matched the actual dimensions. During testing, students added an extra foam insert at the base to further cushion impacts.
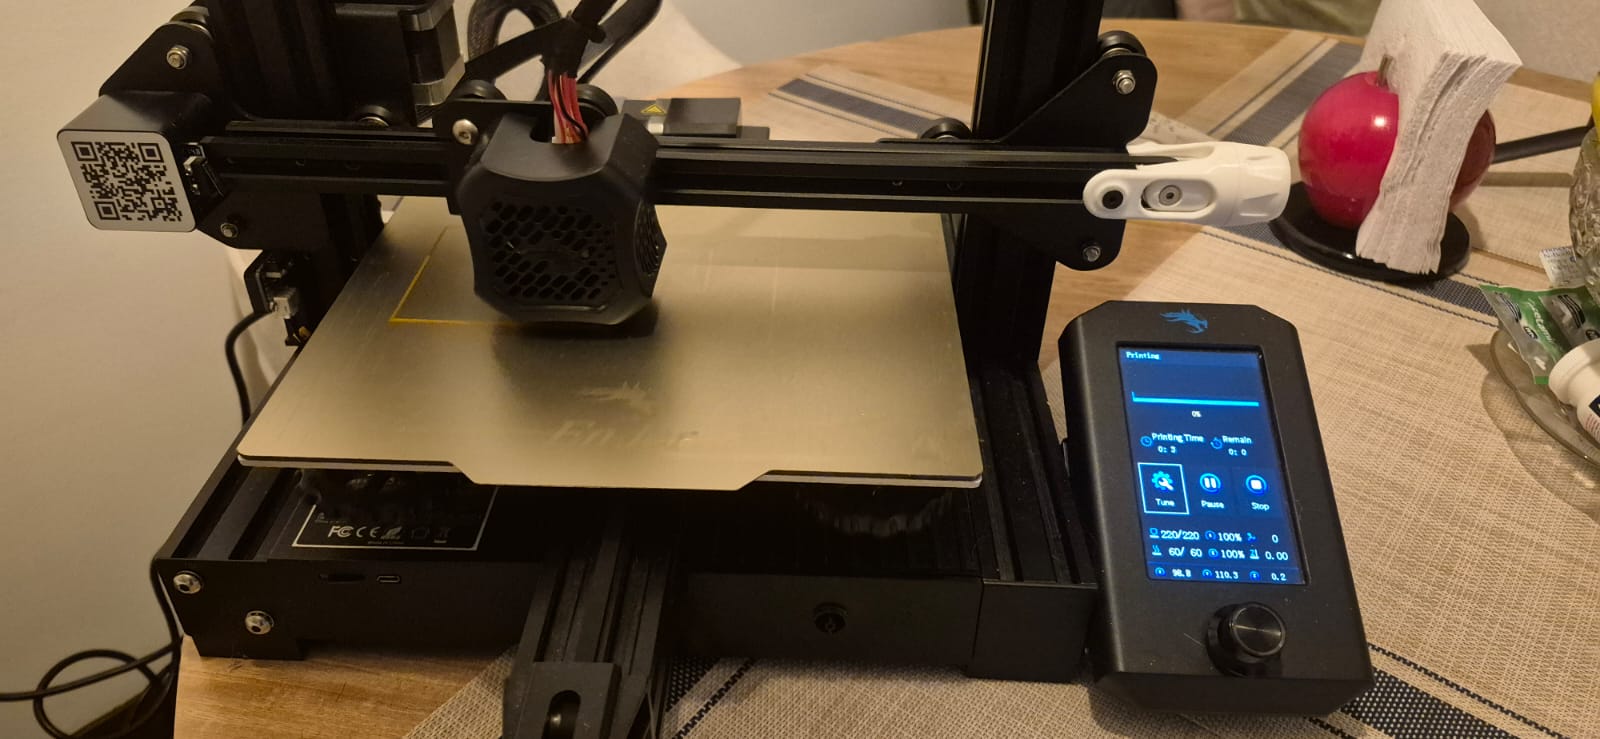
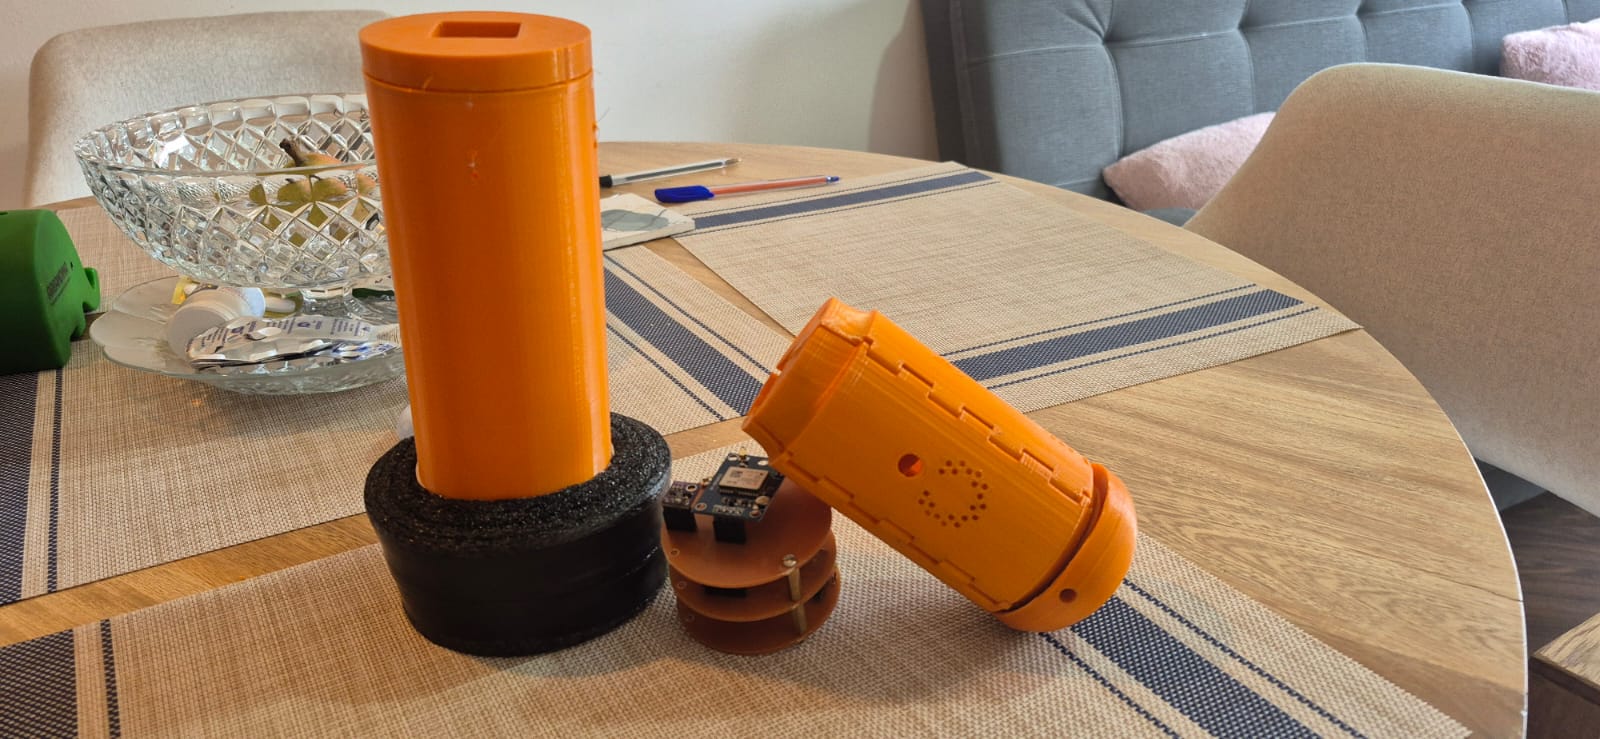
The final printed CanSat is shown here. On the right side of the image, you can see a previous prototype, which was tested but found to be too small—it could only fit a low-capacity battery and required even smaller components. The final design allows for a larger battery and full integration of all the main modules, providing greater autonomy and robustness.
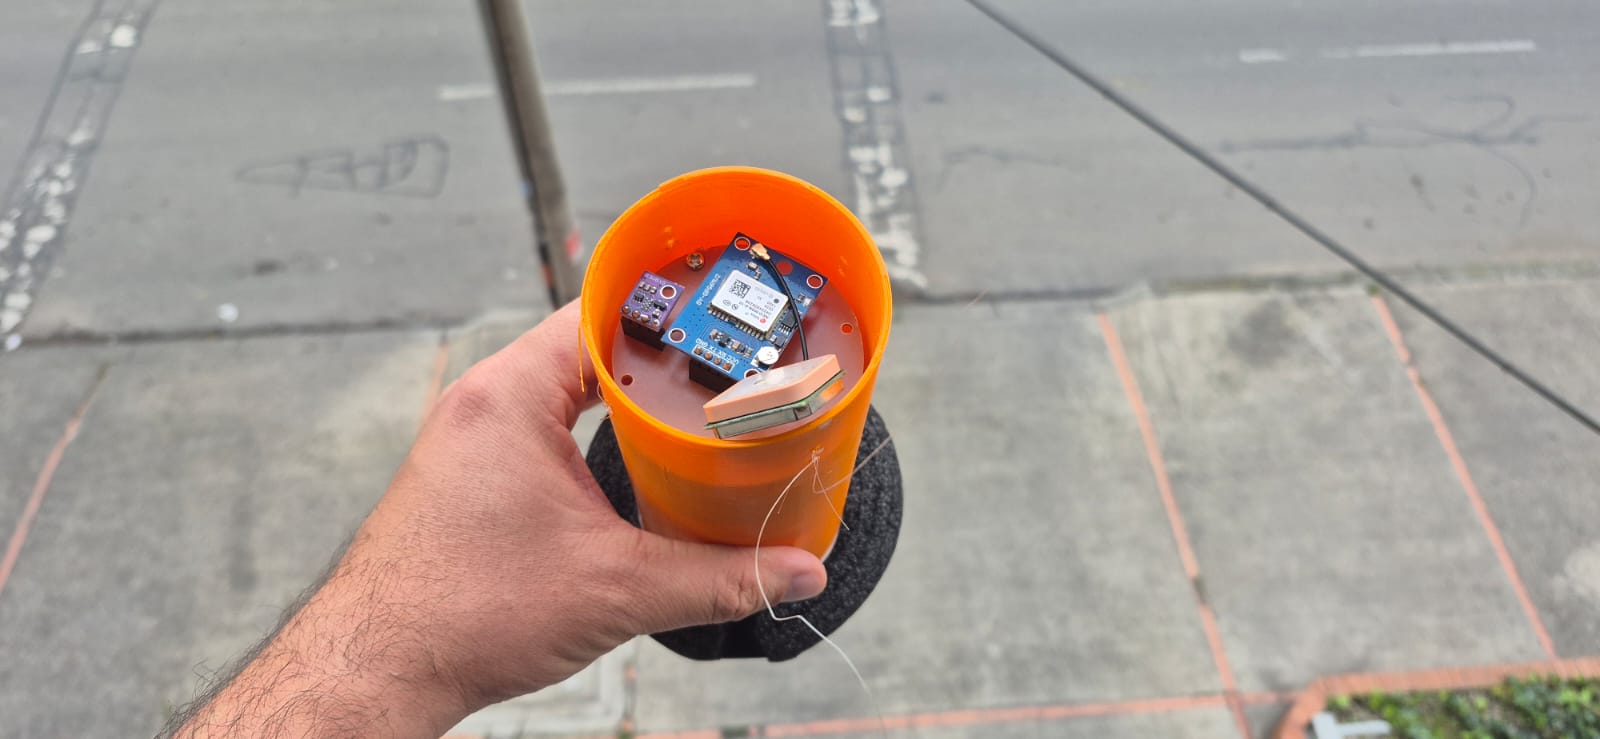
c. Assembly and fitting with electronics
The electronics and PCBs are secured inside the case by the internal tabs, which prevent movement and protect the components. The enclosure is closed with a screw-on cap, allowing easy access to the interior for maintenance or upgrades. The design keeps the antennas of both the GPS and LoRa modules accessible and external for optimal communication performance. Images and videos show the fully assembled system with all electronic modules and batteries securely in place.
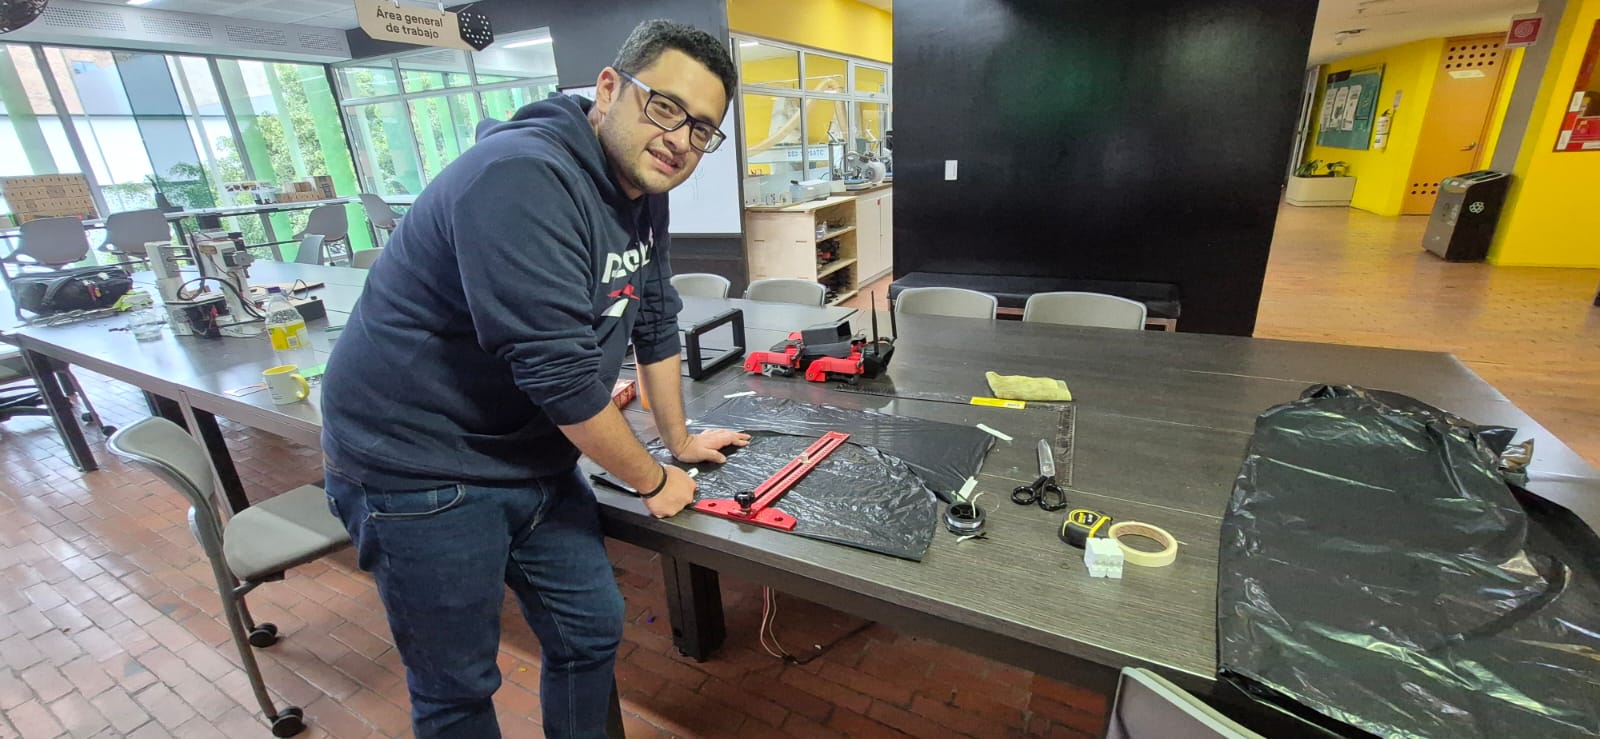
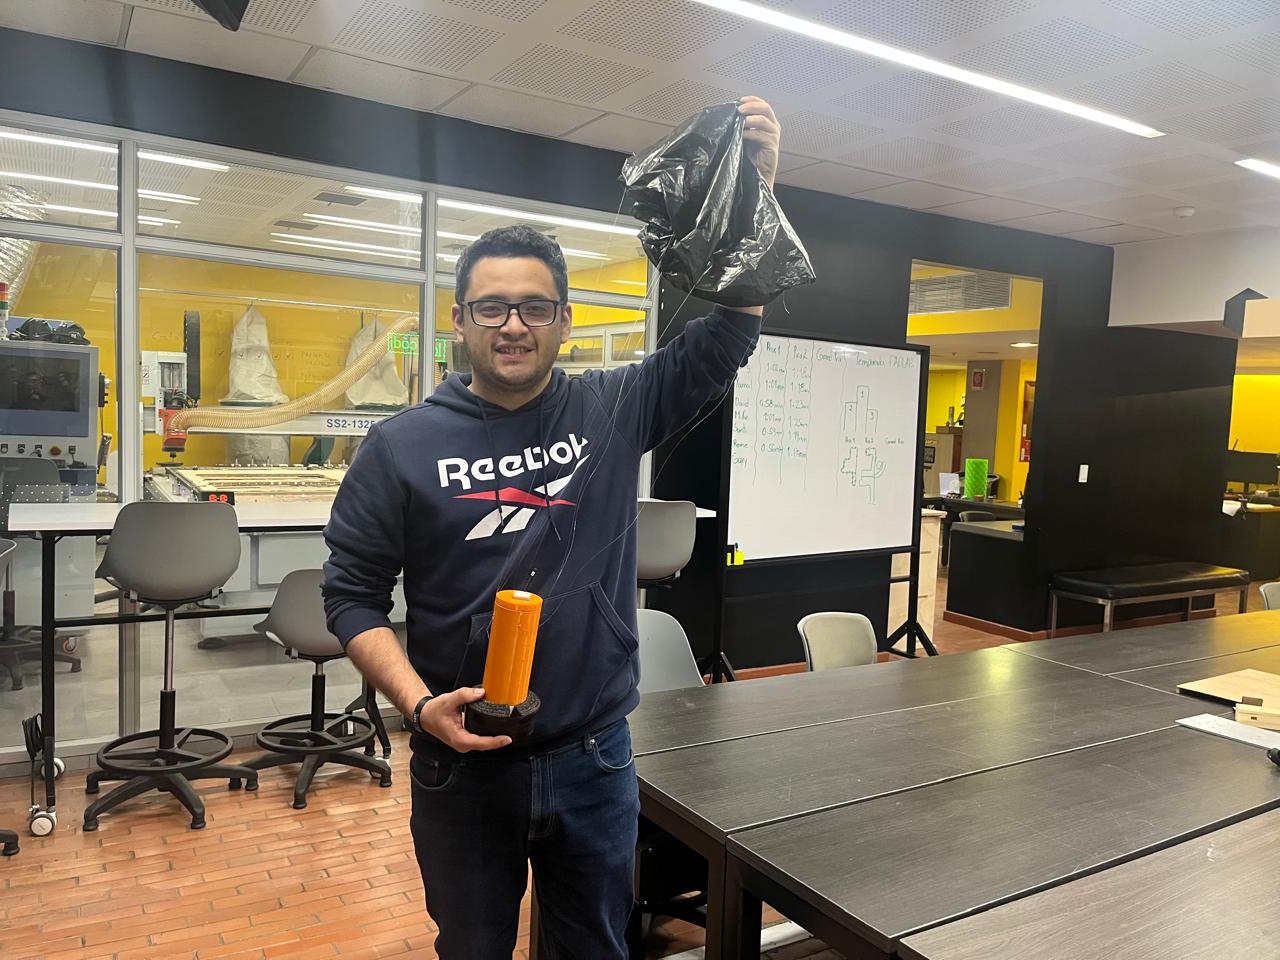
To help slow down the descent of the CanSat, it was necessary to design a parachute. Since the idea is for schools and communities to be able to use easily accessible materials, I built the parachute using a simple plastic bag. I was assisted by my student, Juan Diego Romero, who skillfully used the right tools to create a perfectly shaped semicircle for the canopy.
In this video, you can see part of the assembly process of the system. At this stage, each PCB and component is connected intuitively to ensure correct integration and a reliable fit inside the enclosure.
Once both the electronic system, the case, and the parachute have been integrated, this is how the fully assembled CanSat system looks.
Georeferencing and Image Integration
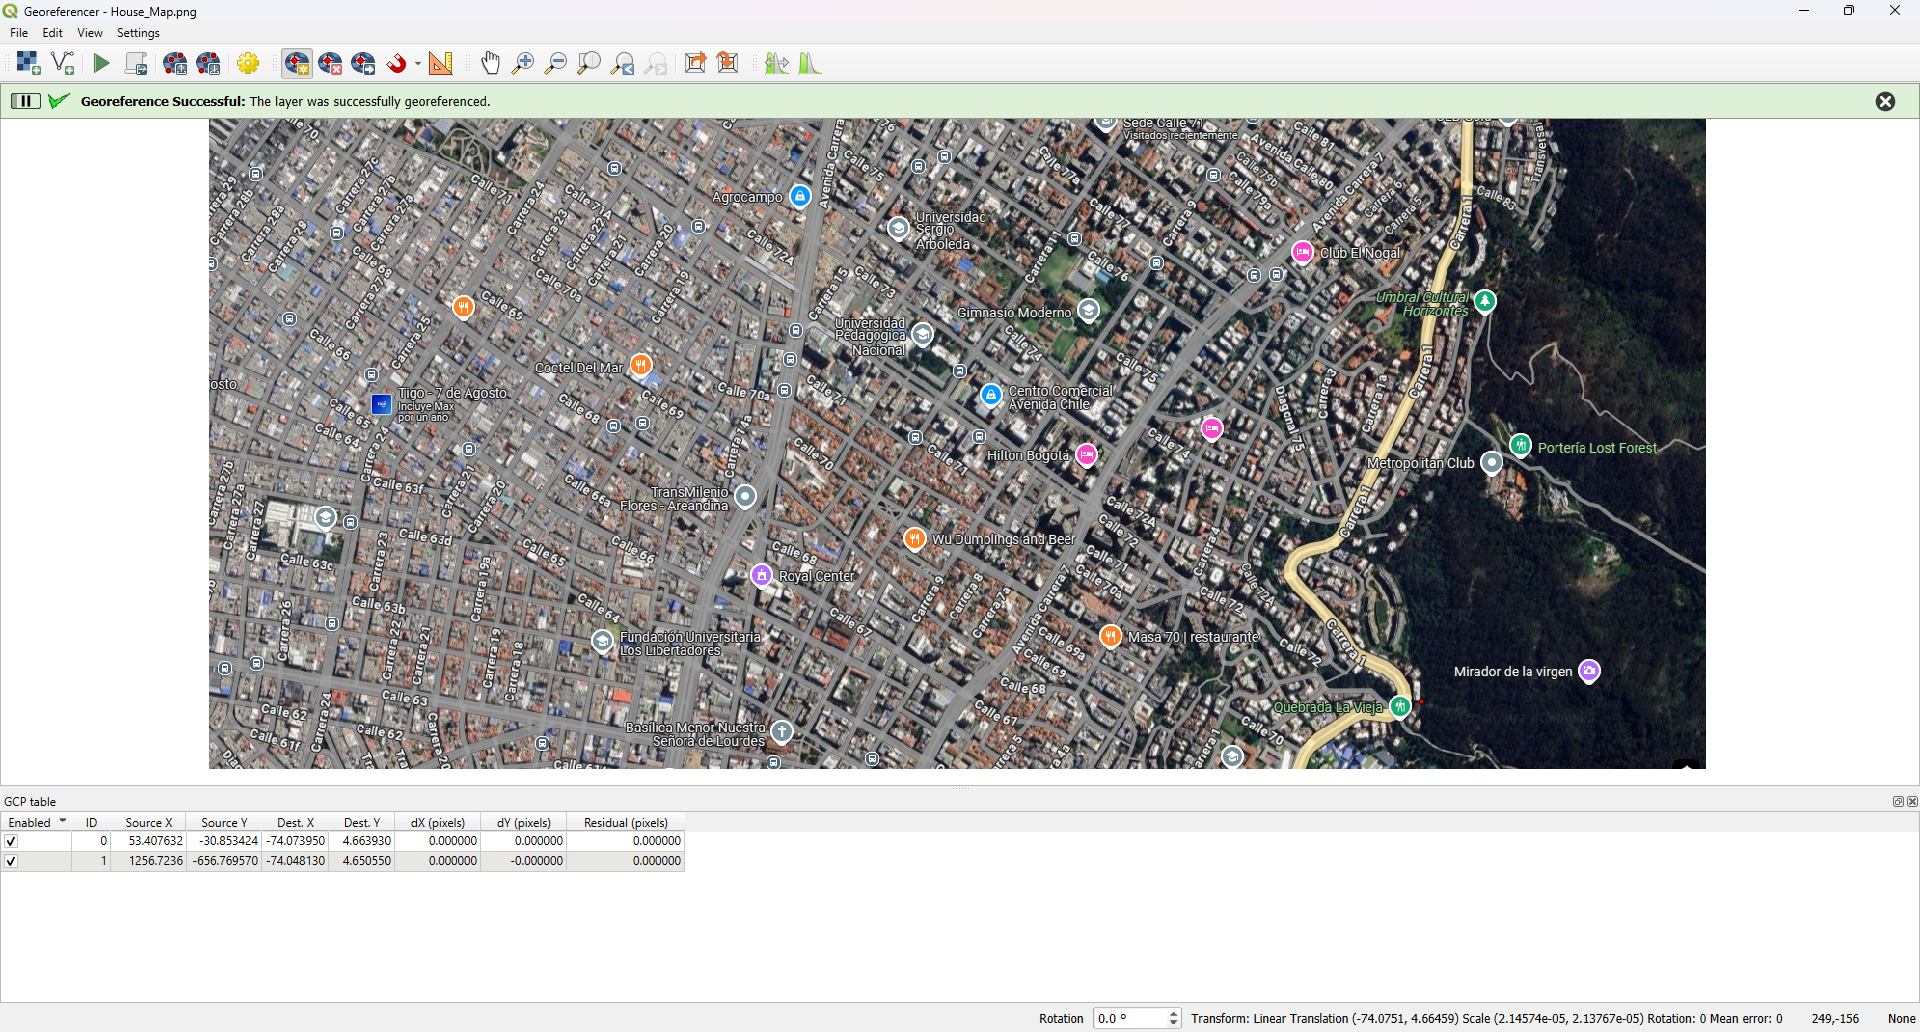
For the mapping functionality, I started by capturing an image from Google Photos. Using QGIS and its georeferencing tool, I selected multiple reference points on the image and assigned their corresponding latitude and longitude values. After completing the process, I exported the image as a GeoTIFF file (.tiff) to make it compatible with my application.

Here you can see the data from the two reference points used to georeference the image. It is possible to use many more points, which will make the process much more precise and help reduce the error in locating the position of the CanSat.
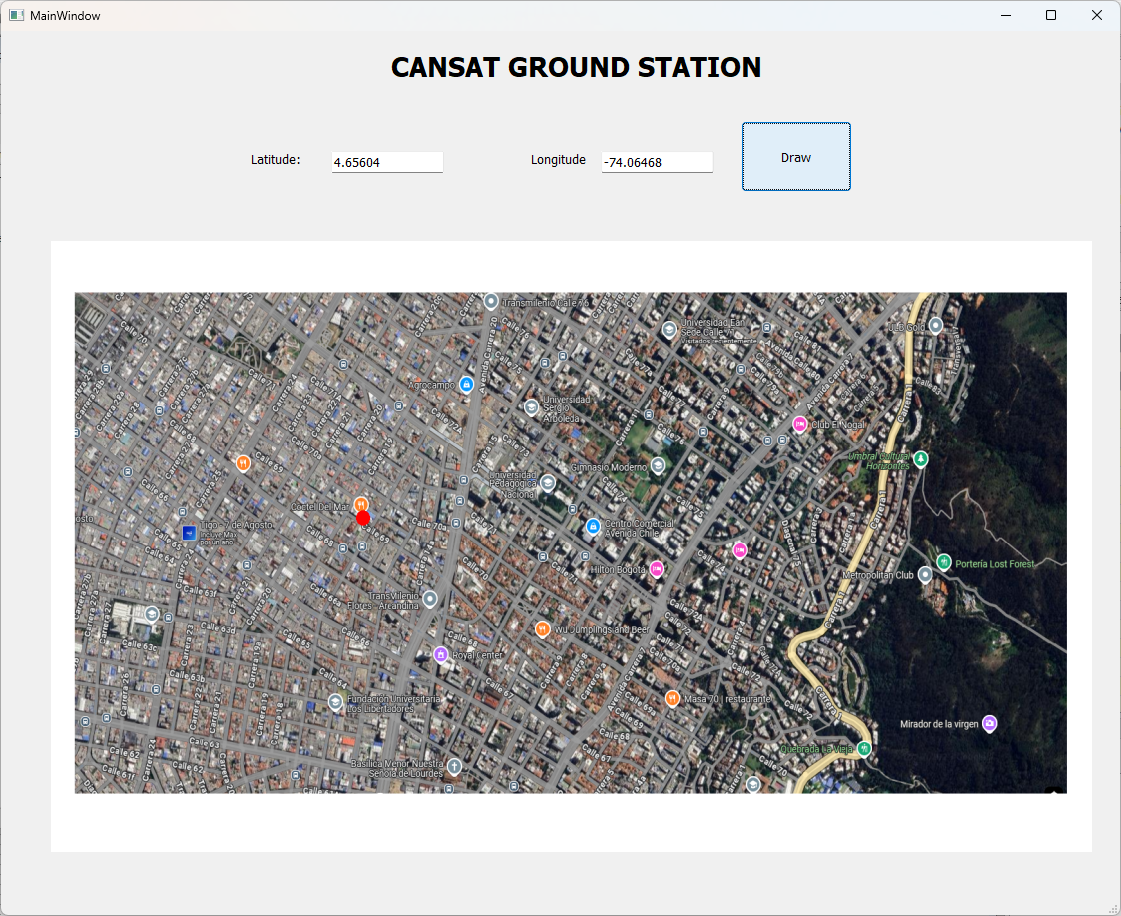
In the Python application, the workflow began with designing the user interface in Qt Designer, carefully assigning names to each field. I then loaded the .ui file within the Python script, along with the .png map image and the .tiff georeferenced file. Using the Rasterio library, I was able to display the map in the interface and plot the CanSat's real-time position based on the received GPS coordinates.
Application Development
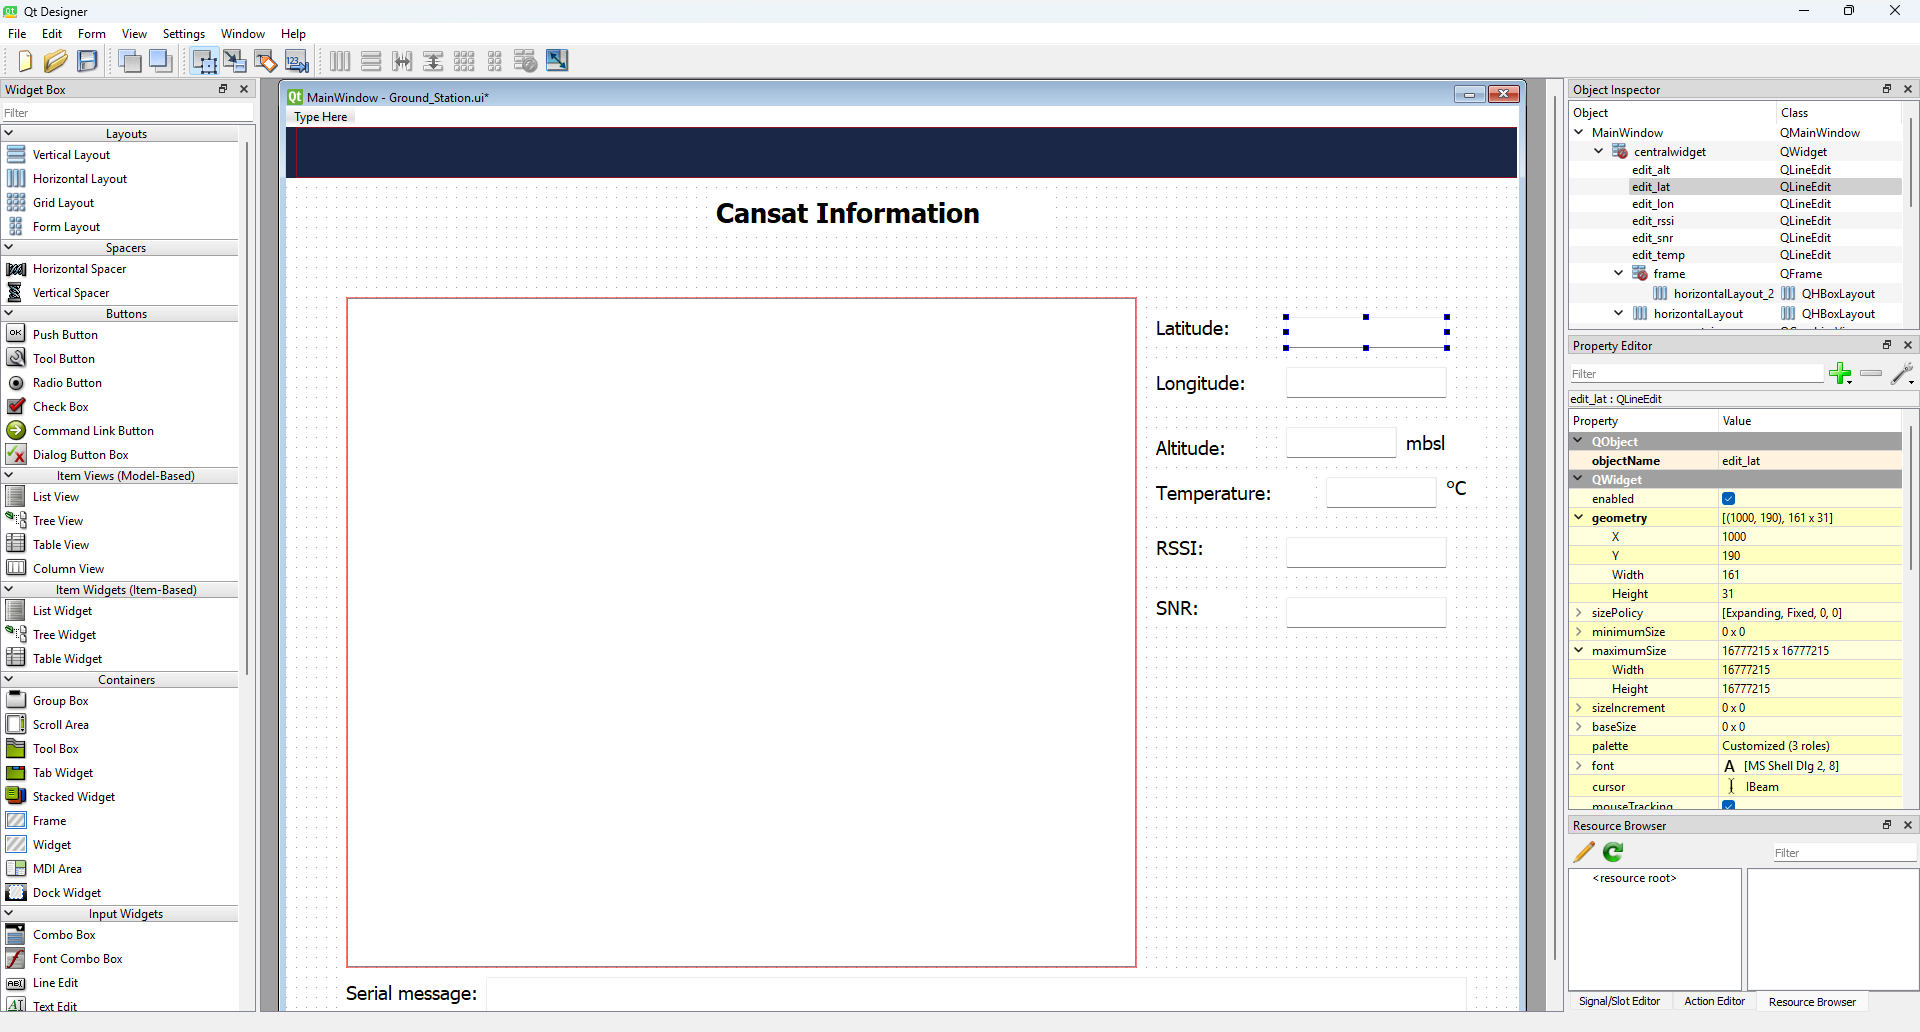
GUI design in Qt Designer
The user interface was designed using Qt Designer. The design is straightforward and functional, displaying all the necessary data fields for monitoring the CanSat's status and position.
Detailed Testing Logs
Below is a sample of the raw data log collected during a field test of the EduCanSat system. This test was carried out in a residential area of Bogotá at around 11:30 pm, with an average temperature of 16 °C. The procedure consisted of leaving the receiver on the balcony of a second floor and then walking in a straight line with the CanSat up to an approximate distance of 150 meters. The available data in the log file reflect the real-time transmission and reception of all measured parameters during this process.
The full log file is available for download here: Download full testing log
Sample Extract:
Received line: 📥 Received: Lat=4.656445,Lng=-74.064677,Sat=3,Alt=2547.1,T=16.24C | RSSI: -65 dBm | SNR: 11.5
Received line: 📥 Received: Lat=4.656445,Lng=-74.064677,Sat=0,Alt=2547.1,T=16.23C | RSSI: -62 dBm | SNR: 13.5
Received line: 📥 Received: Lat=4.656445,Lng=-74.064677,Sat=3,Alt=2547.1,T=16.22C | RSSI: -62 dBm | SNR: 13.5
Received line: 📥 Received: Lat=4.656445,Lng=-74.064677,Sat=3,Alt=2547.1,T=16.21C | RSSI: -61 dBm | SNR: 15.3
Received line: 📥 Received: Lat=4.656445,Lng=-74.064677,Sat=3,Alt=2547.1,T=16.20C | RSSI: -60 dBm | SNR: 14.8
Received line: 📥 Received: Lat=4.656445,Lng=-74.064677,Sat=3,Alt=2547.1,T=16.21C | RSSI: -61 dBm | SNR: 12.8
Received line: 📥 Received: Lat=4.656445,Lng=-74.064677,Sat=3,Alt=2547.1,T=16.21C | RSSI: -61 dBm | SNR: 11.5
Received line: 📥 Received: Lat=4.656445,Lng=-74.064677,Sat=3,Alt=2547.1,T=16.21C | RSSI: -55 dBm | SNR: 12.3
Received line: 📥 Received: Lat=4.656445,Lng=-74.064677,Sat=3,Alt=2547.1,T=16.21C | RSSI: -55 dBm | SNR: 13.8
Explanation of each variable:
Lat: The latitude where the CanSat is located, expressed in decimal degrees.
Lng: The longitude where the CanSat is located, expressed in decimal degrees.
Sat: Number of GPS satellites used for positioning at that moment.
Alt: Altitude of the CanSat above sea level, measured in meters.
T: Temperature measured by the onboard sensor, in degrees Celsius (°C).
RSSI: Received Signal Strength Indicator, representing the power of the radio signal received by the ground station, in decibels-milliwatts (dBm).
SNR: Signal-to-Noise Ratio, indicating the quality of the received signal compared to background noise. Higher values mean better signal quality.
The Arduino IDE was used to program the XIAO ESP32-C3 boards and verify the correct operation of the system. The serial monitor allowed me to check that the communication between the CanSat and the ground station was effective.
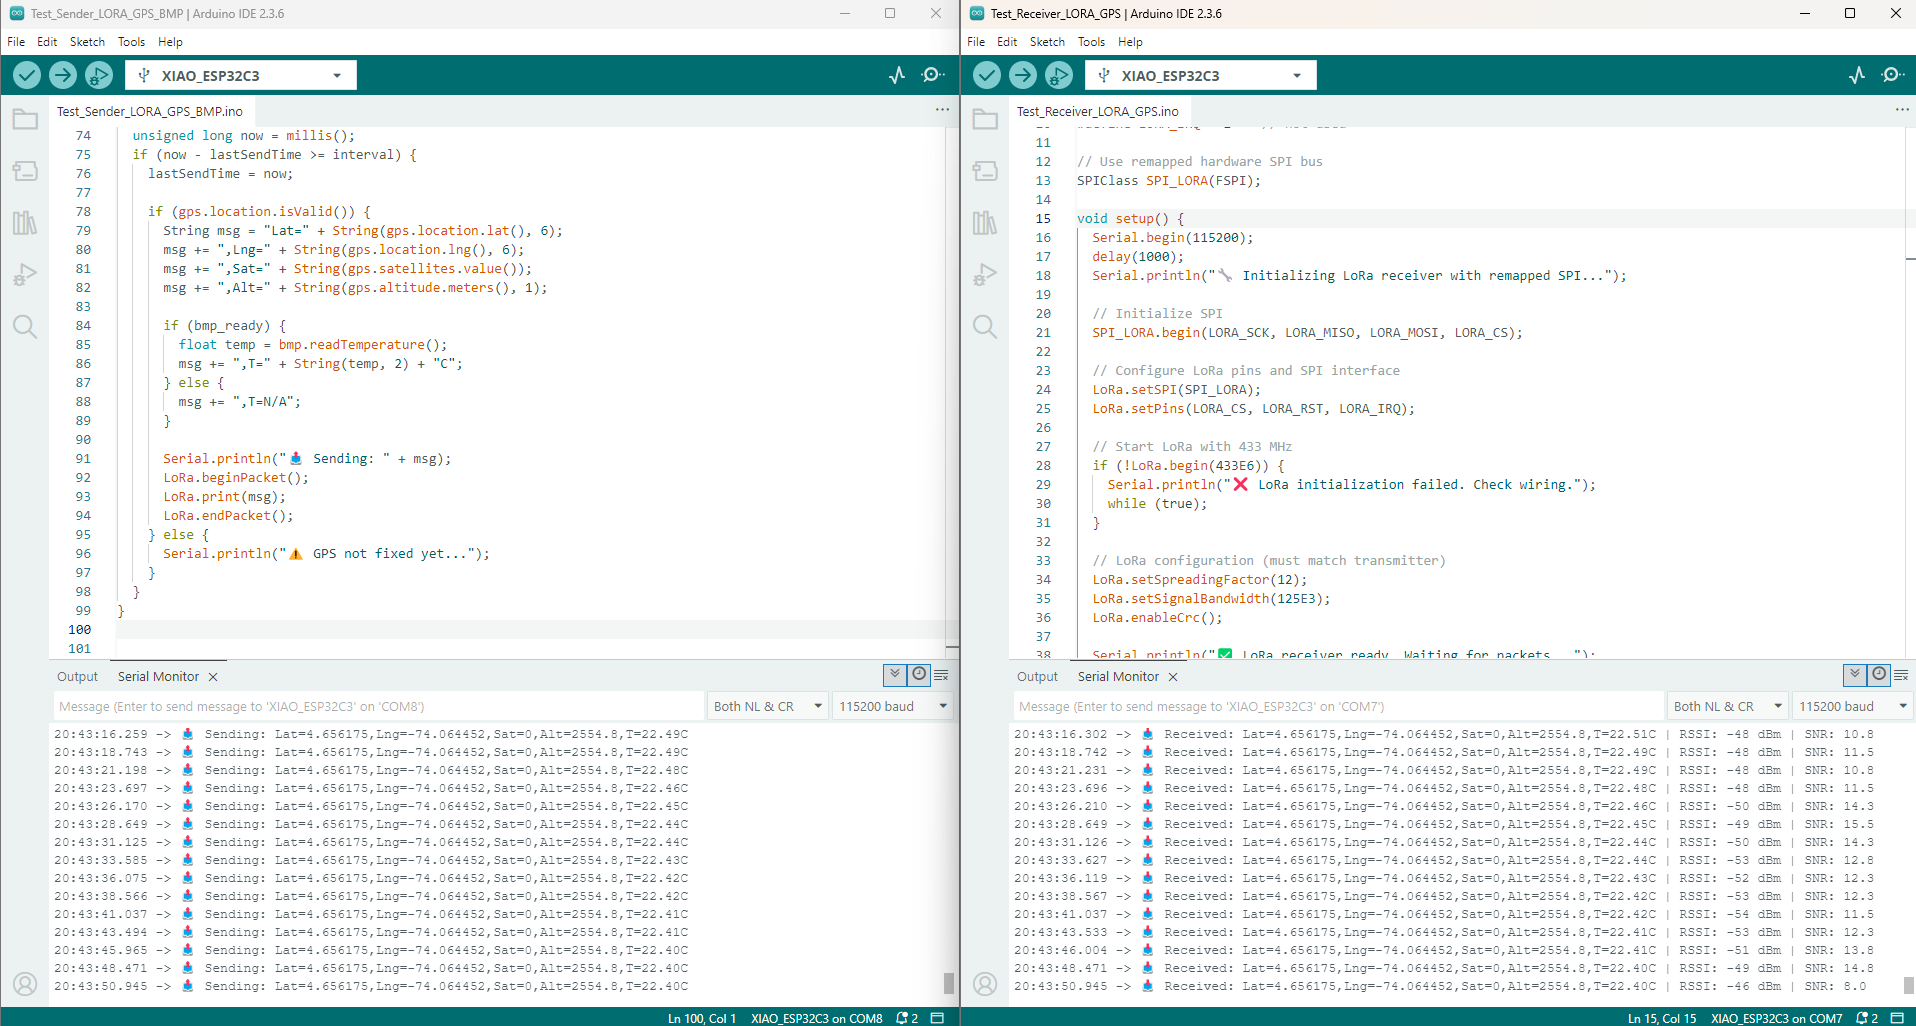
Once the communication between the ground station and the CanSat was verified, the Python code was developed and can be found at the bottom of this page. This script opens the serial port where the XIAO is connected, and the data readings obtained in the terminal are shown in the image below.
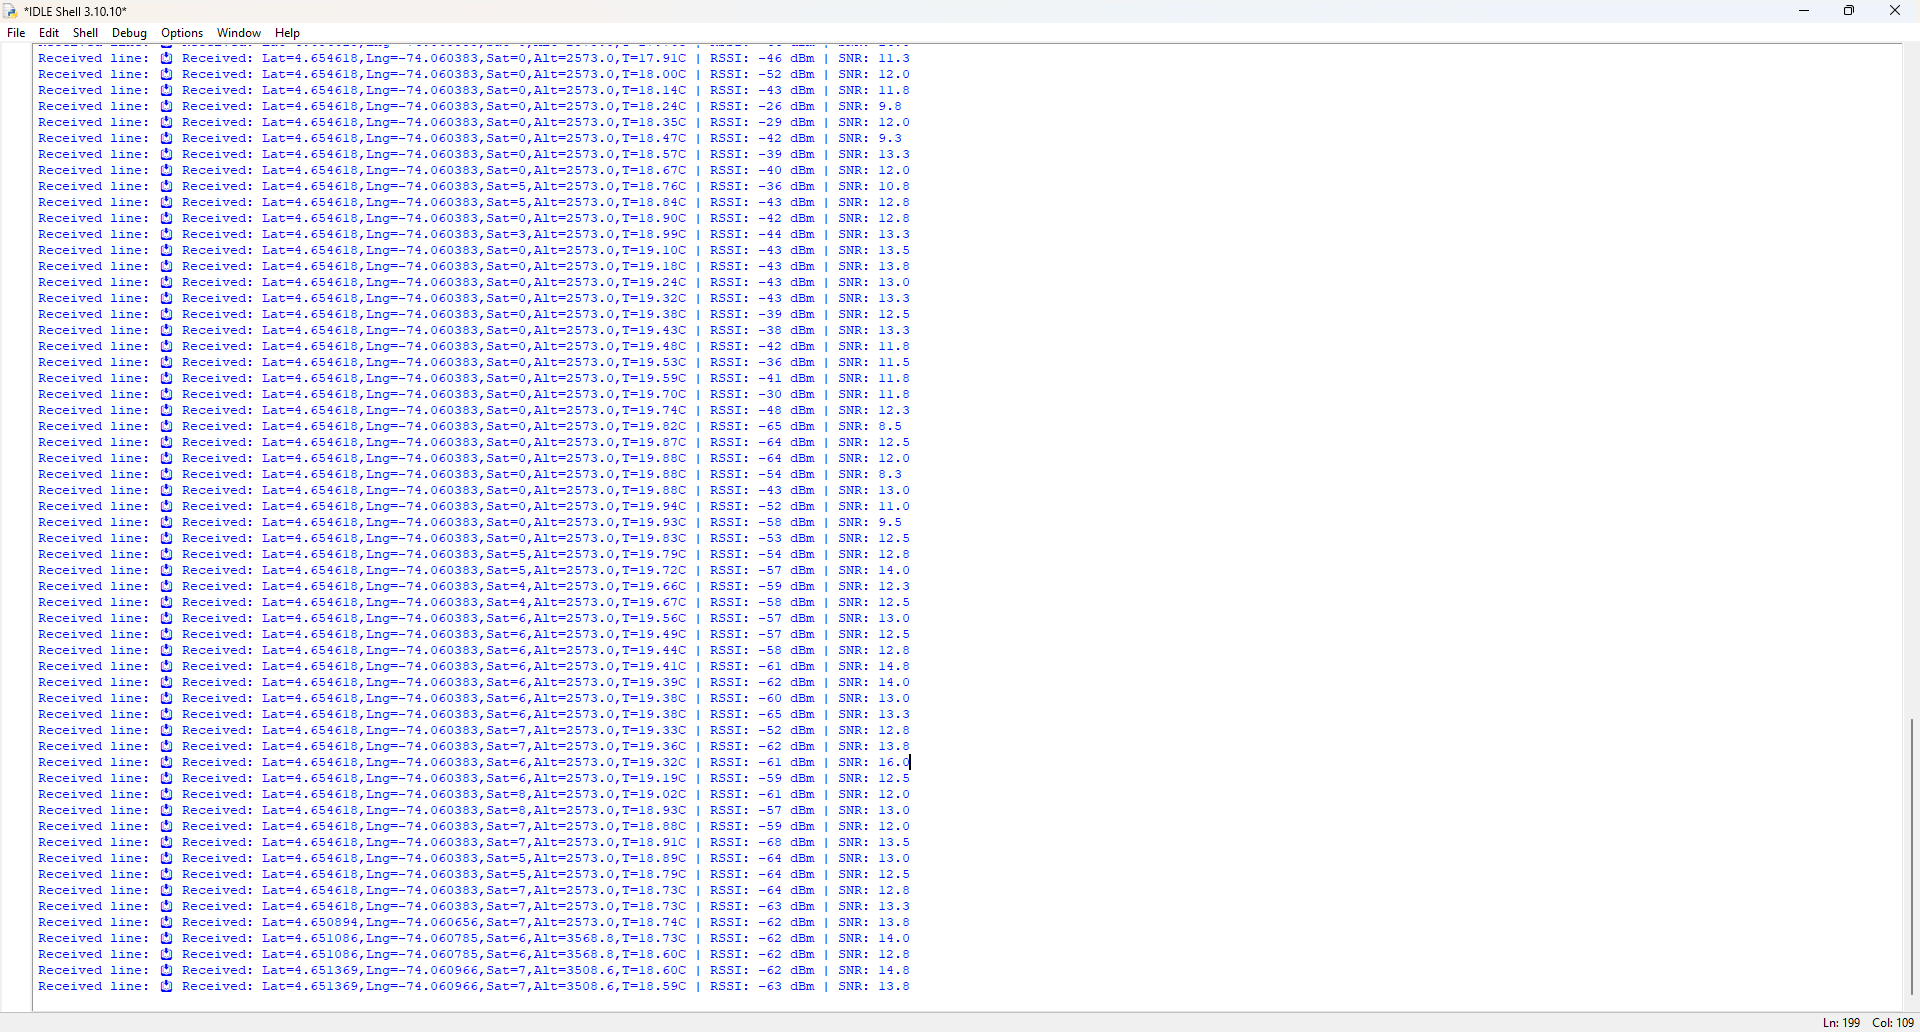
Serial data parsing and visualization
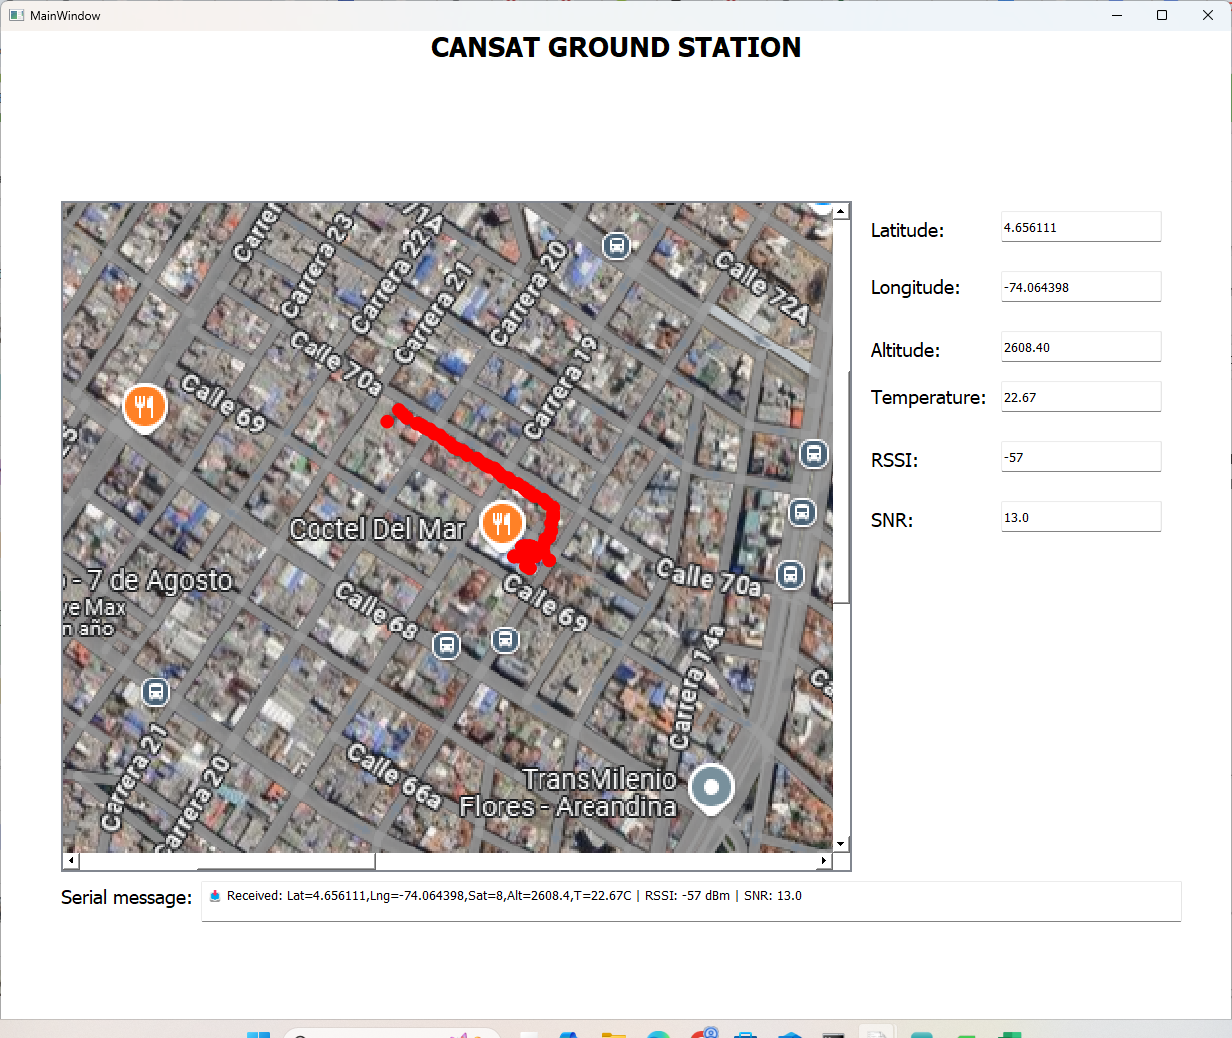
The application processes incoming data in real time, displaying all relevant fields such as latitude, longitude, altitude, temperature, RSSI, and SNR. Only the most recent data is shown for each field, ensuring that users can quickly monitor the current state of the CanSat.
The map in the application updates automatically as new data is received, marking the current location of the CanSat. The application can also display all previous positions, allowing users to visualize the entire trajectory followed by the CanSat during its flight or descent.
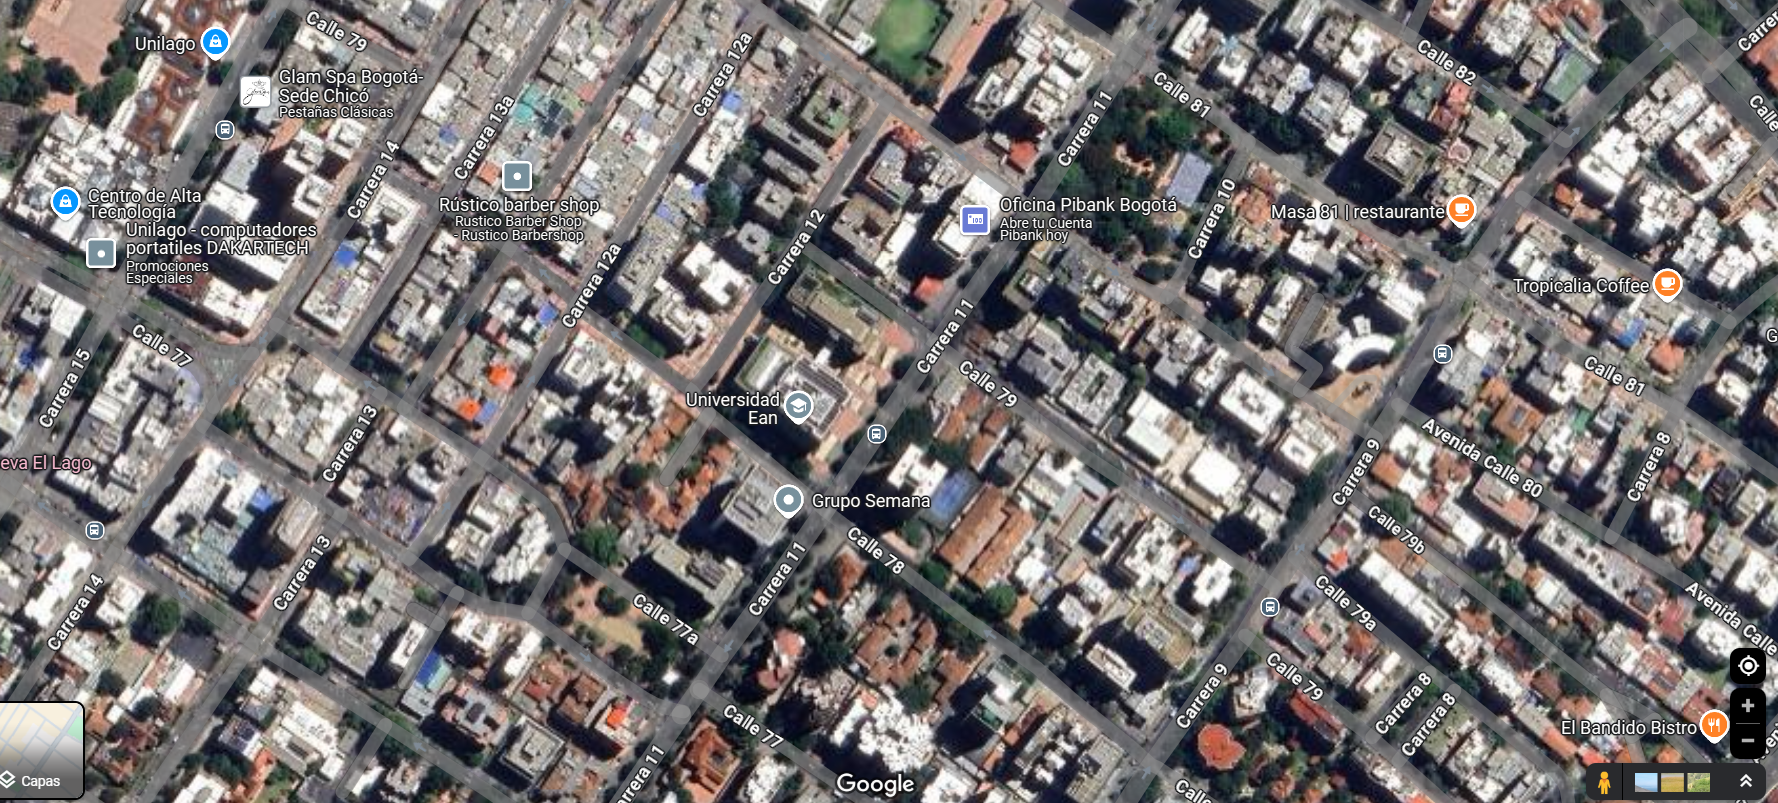
To achieve the final result, I first developed several preliminary logical processes in an inductive way. For example, the initial version of the interface was designed to plot coordinates that I manually entered based on Google Maps, as shown in the image.
Lessons Learned / Challenges Overcome
The greatest technical challenge was achieving reliable communication and alignment between the stacked PCBs and soldering all the components properly. There was a point when I thought the project would not work: I had incorrectly connected the LoRa communication module, forgetting that the XIAO ESP32-C3 requires specific pins for SPI communication. This caused repeated initialization failures until I corrected the wiring and connected the components properly.
Through this process, I learned a lot about system integration—how important it is to plan how each stage and component will be connected. Integration is a key concept that defines the structure and flow of the entire project.
More than technical errors, the biggest obstacles were budget constraints. For example, I initially wanted to include a standalone visualization (without a computer) using a Raspberry Pi and a touchscreen, but due to high costs I had to opt for visualization through a computer application instead.
Improvements / Future Work
For future versions of EduCanSat, I would implement better connectors between the PCBs and focus on improving the finish and professional labeling of the boards. I would also work on a modular approach, allowing sensors and development boards to be swapped or upgraded without the need for additional soldering—making the system even more flexible and user-friendly.
My vision is for diverse communities to have access to a CanSat development kit that they can easily incorporate into their classes, expanding the reach and impact of hands-on STEM education.
Acknowledgements
I would like to thank all my instructors from the Peru node, who always gave feedback aimed at improving the quality of my work and supported me throughout this challenging journey. Balancing my responsibilities as a program director, pursuing a specialization and a second master’s degree, handling program accreditation renewal, working on study units, and dealing with health issues was not easy. Overcoming all these circumstances, always guided by true mentors, has been deeply gratifying.
I especially want to thank Silvana and LuisMi, who always accompanied and guided me along the way, no matter the hour, always offering options, solutions, and a genuine desire to contribute to my growth.
I also want to thank Pradnya Shindekar, my global instructor. Her feedback was always an opportunity not just to improve, but also to recognize what was going well. At Fab Academy, assessment and quality matter, but what truly makes a difference is the support, encouragement, and trust that an entire community can provide.
!GRACIAS TOTALES!
Downloads
Here you can download all the source code files used in the EduCanSat project, including the CanSat firmware, the ground station firmware, and the Python visualization app.