14. INTERFACE AND APPLICATION PROGRAMMING
Assignment
-
Group assignment:Compare as many tool options as possible.
-
Individual assignment: Write an application that interfaces a user with an input and/or output device that I made.
For Group Assignment we can find in HERE

In this week assignment, I learnt how to plot the data on a graph is used to observe and subsequently describe the visible patterns that exist within the data. The main aim of this assignment is to show, how to plot a variable graph using processing environment and my board (using ATtiny 3216).
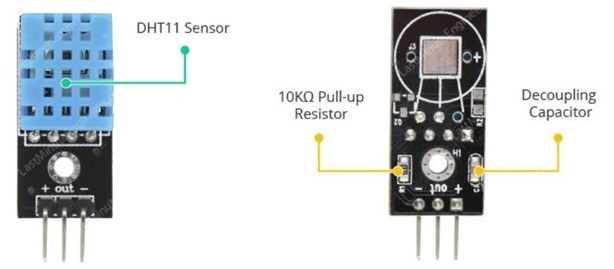
Temperature and humidity data from DHT11 sensor were plotted on the processing graph.
Processing environment is quite similar to Arduino but the difference is that in the former I can plot the graph whereas in the latter we can’t plot any type of graph. Processing Environment is very useful in cases of plotting Analog graphs.Processing Environment is very useful in cases of plotting Analog graphs. For this project reader need to know how to start with my board.
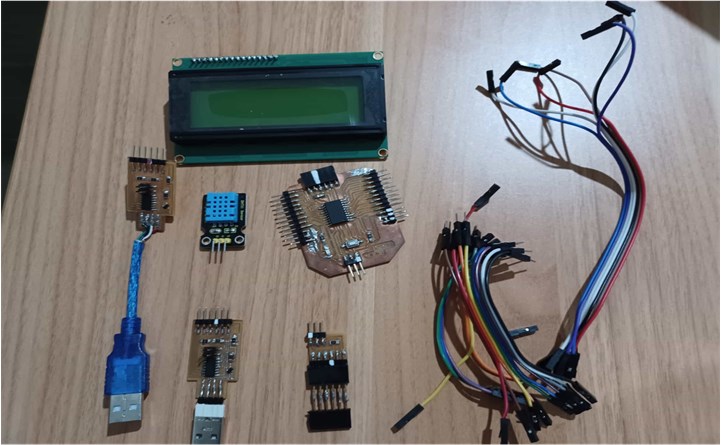
In this assignment I plotted temperature and humidity visualization on computer or laptop using Processing Environment. Circuit of reading temperature and humidity are plotted to show the results. In this system only one circuit DHT11 temperature and humidity Detector / Reader is used and directly connected with Analog pin number A0 of my board.
And a 20×2 LCD interfaced with arduino were connected with this circuit for displaying temperature. See the block diagram given below to understand the working of this project.
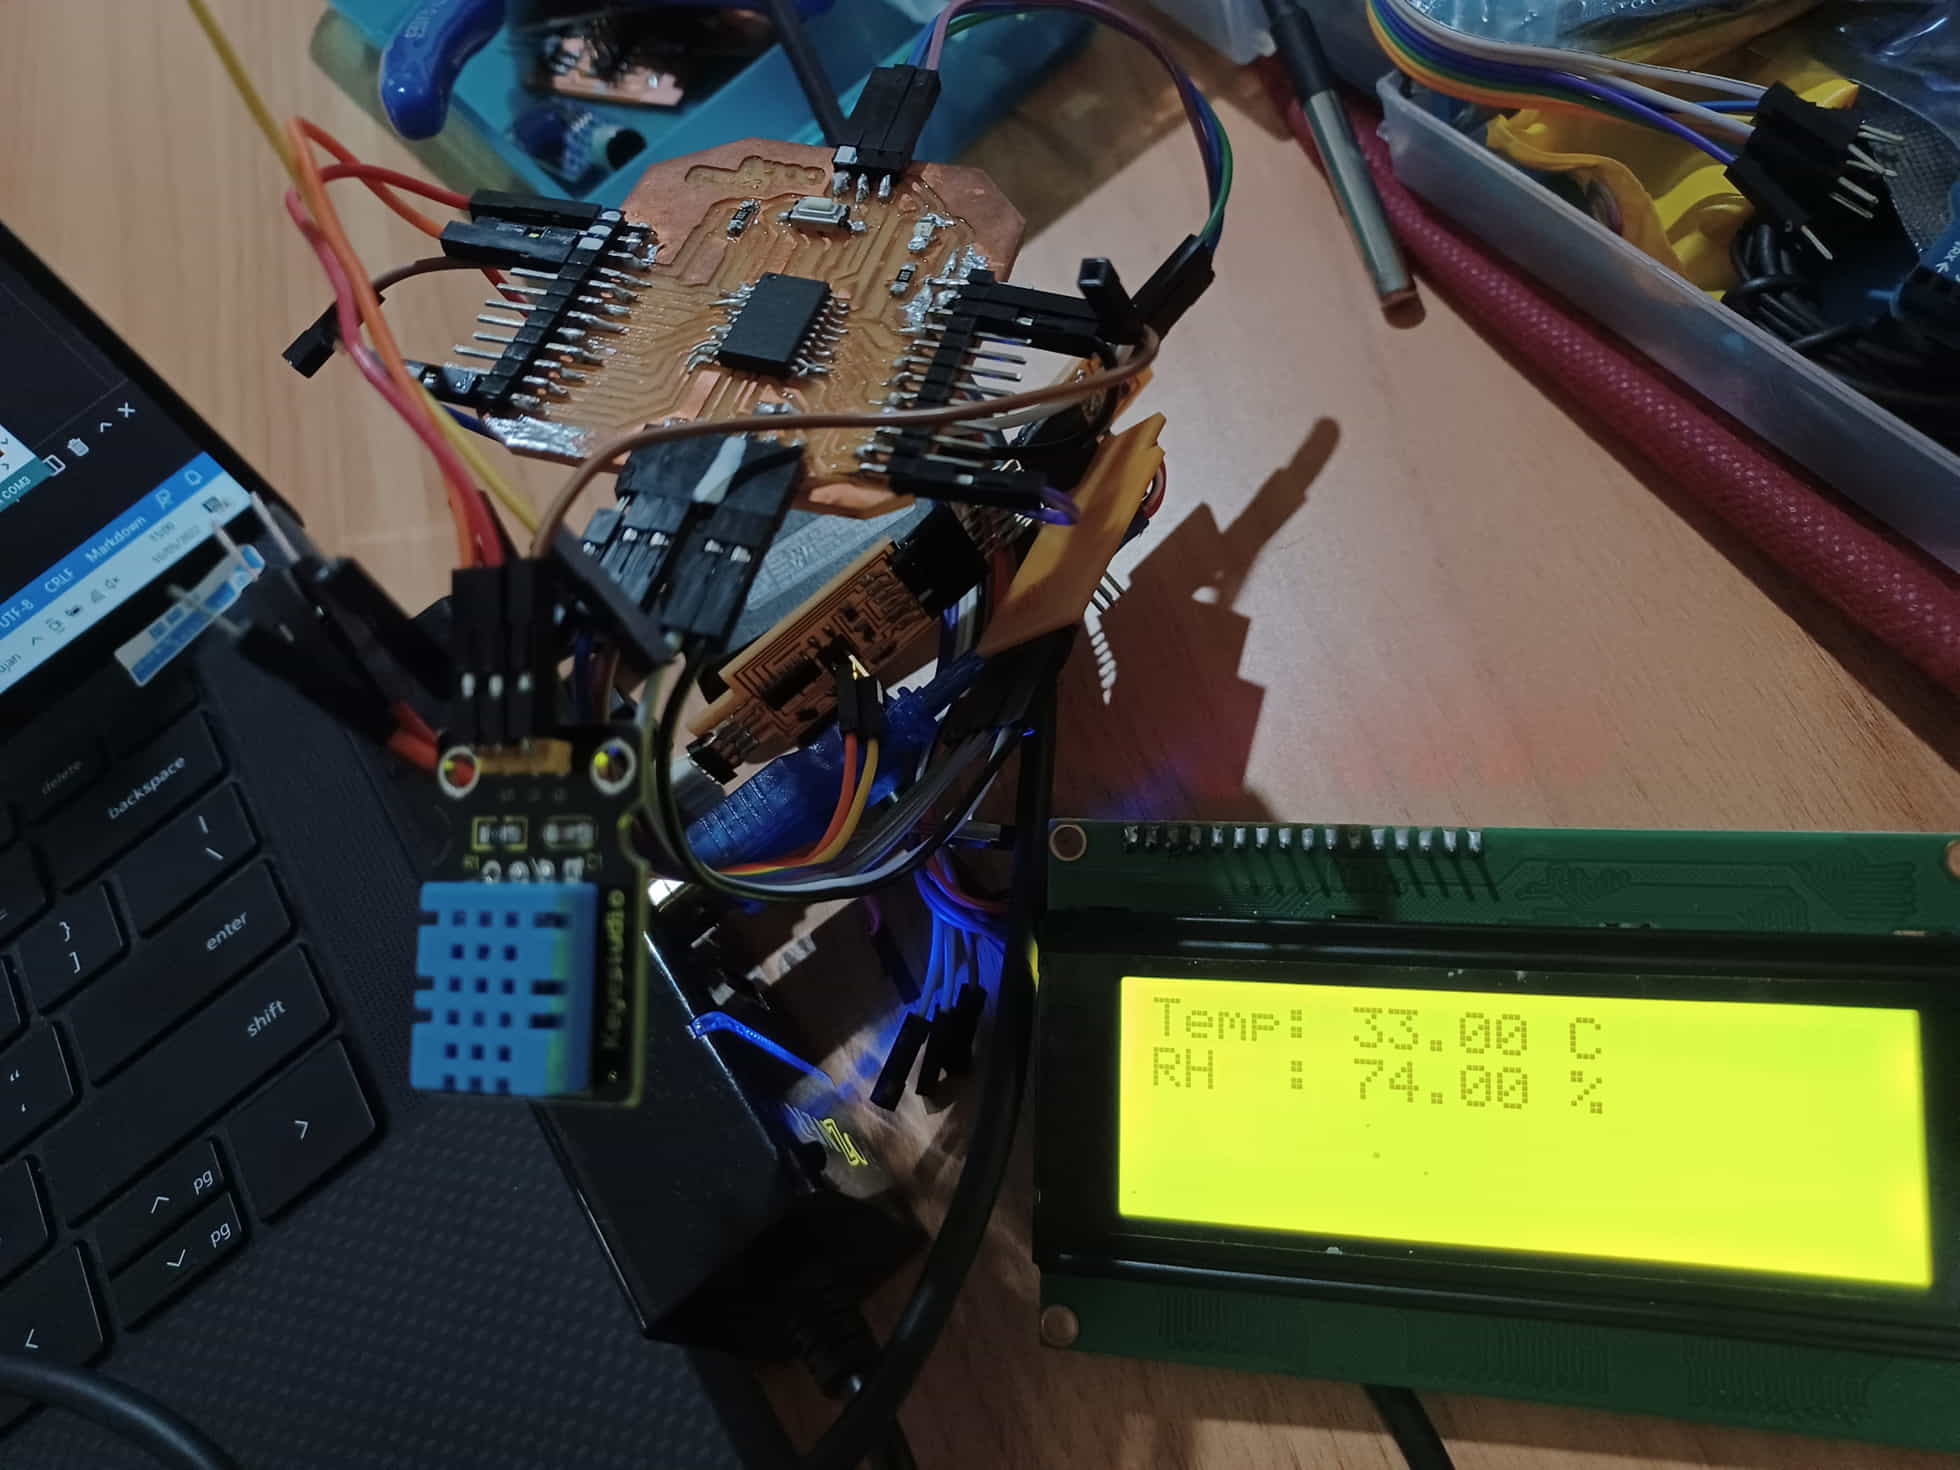
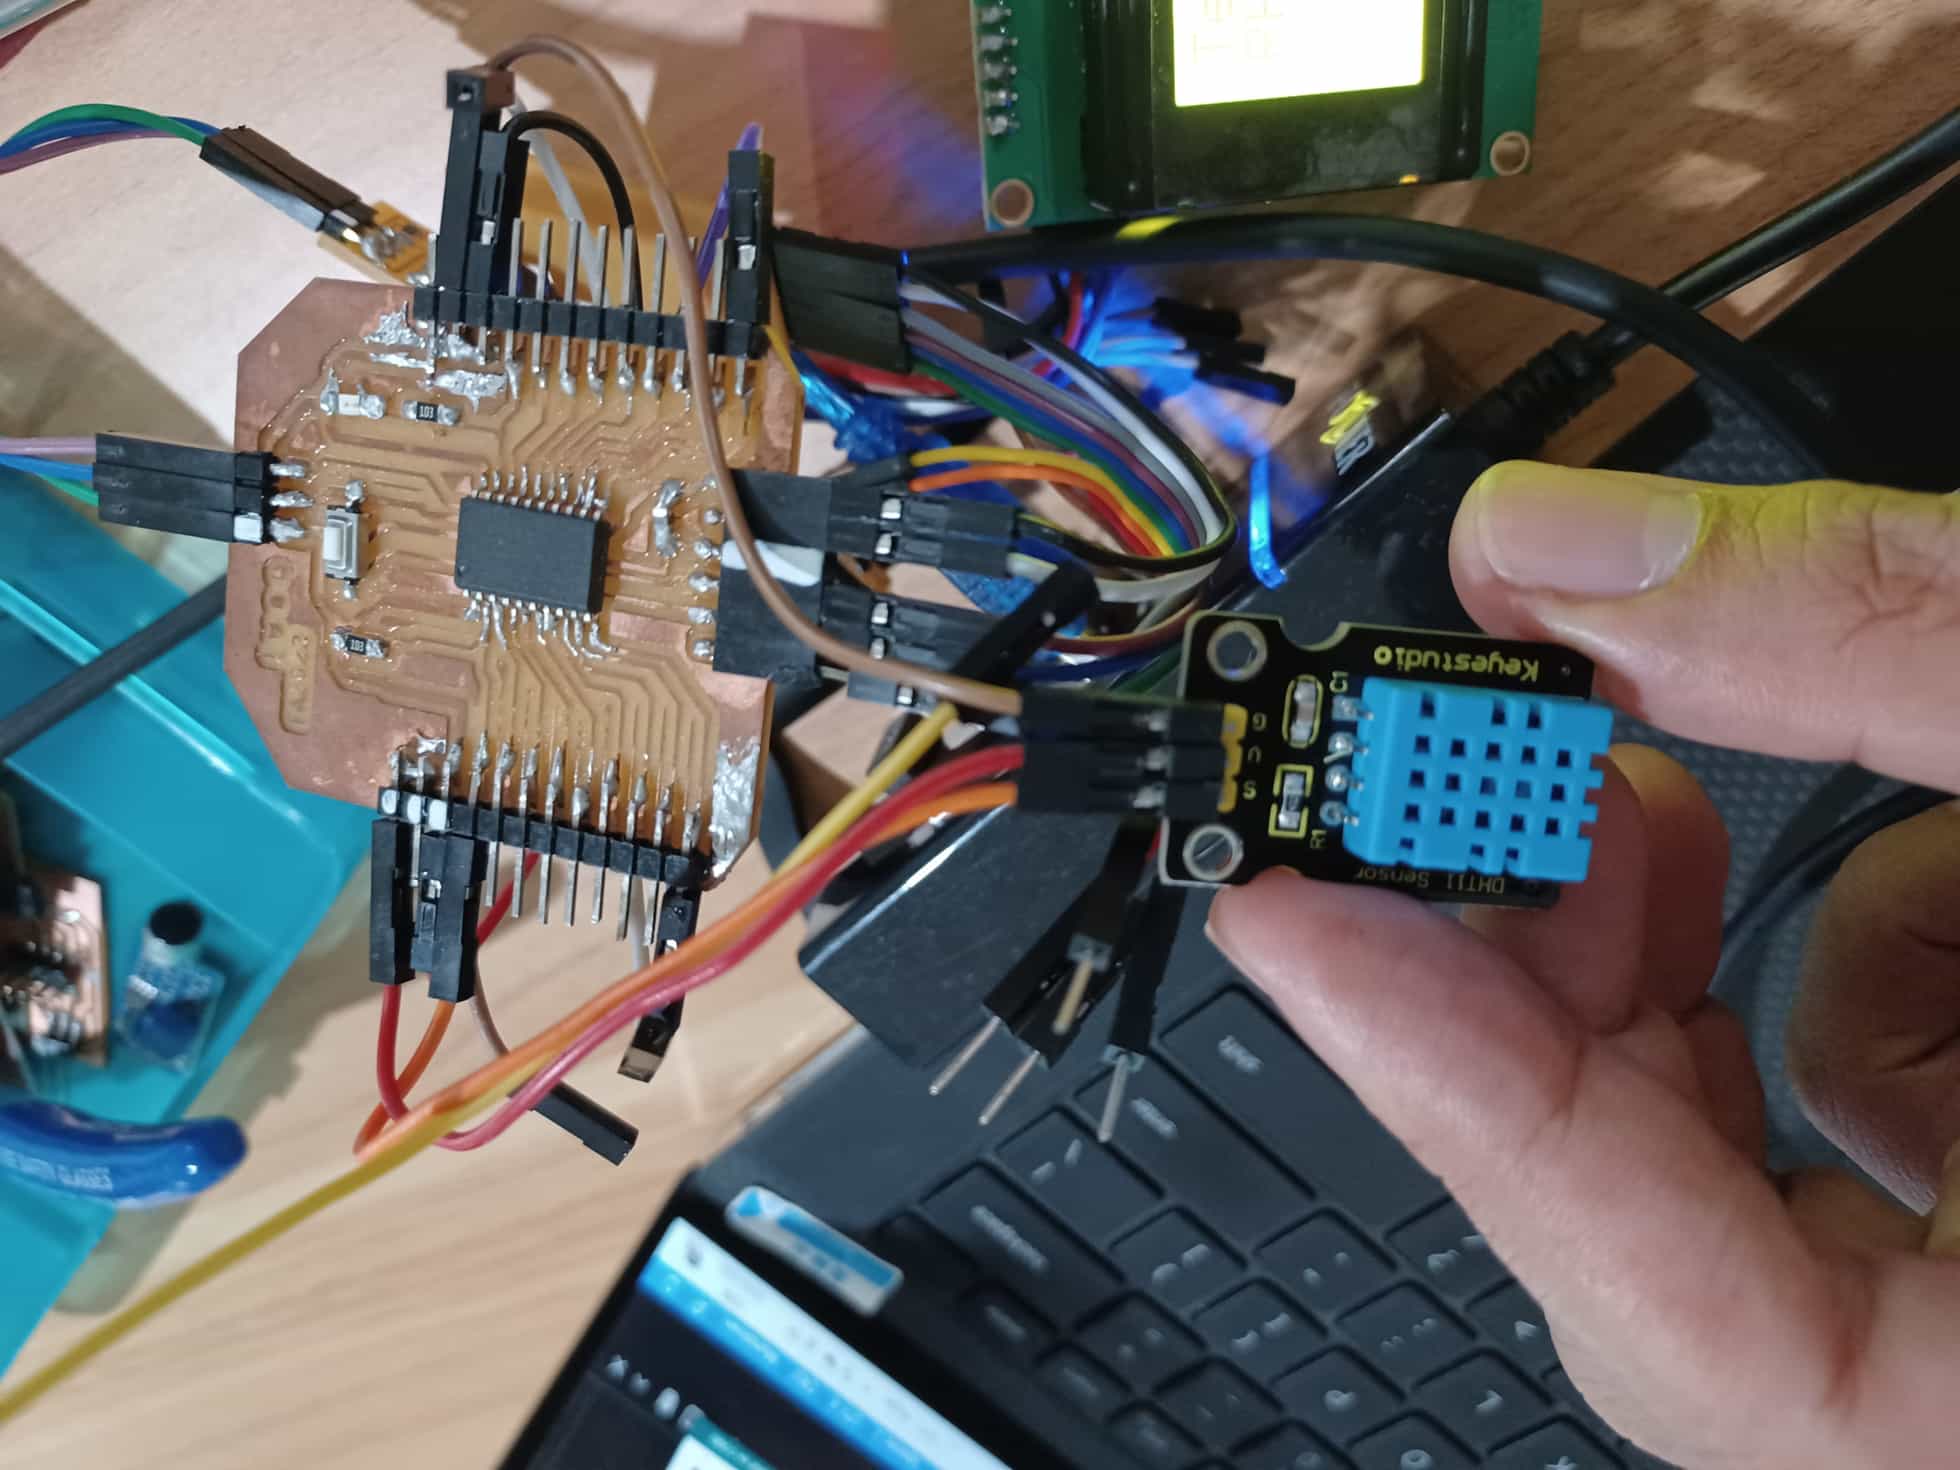
From my board (with ATtiny3216), I just read Analog output of temperature sensor and after some calculations my boards sends data for Processing by using FTDI basic breakout. But you can use any of TTL logic converters to communicate with Desktop or Laptop with my board. Using my board, I configured with logic converter or used Arduino UNO and TTL Logic Converter.
Working with DTH11 Temperature and Humidity Sensor
This video showed how my simulation works to measure the ambient temperature.
The formula for calculation of temperature given below:
// DHT11 train
#include <dht11.h>
#include <Wire.h>
#include <LiquidCrystal_I2C.h>

dht11 DHT11;
#define DHT11PIN 0
float value;
LiquidCrystal_I2C lcd(0x27,20,4);  // set the LCD address to 0x27 for a 16 chars and 2 line display


void setup()
{
   Serial.begin(9600);
   lcd.init();                      // initialize the lcd
   lcd.backlight();
    lcd.setCursor(3,0);
  lcd.print("Initialization");
  // Serial.println("Initialization");
  lcd.clear();
}

void loop()
{
  float chk = DHT11.read(DHT11PIN);
  value = DHT11.humidity;
  lcd.setCursor(0, 0);
  lcd.print("Temp: ");
  lcd.print((float)DHT11.temperature, 2);
  lcd.print(" C");
  // Serial.print("Temp: ");
 // Serial.print((float)DHT11.temperature, 2);
  Serial.println(value, DEC);
  // Serial.println(" C");

  lcd.setCursor(0, 1);
  lcd.print("RH  : ");
  lcd.print((float)DHT11.humidity, 2);
  lcd.print(" %");

  // Serial.print("RH  : ");
  // Serial.print((float)DHT11.humidity, 2);
  // Serial.println(" %");
  delay(200);
}
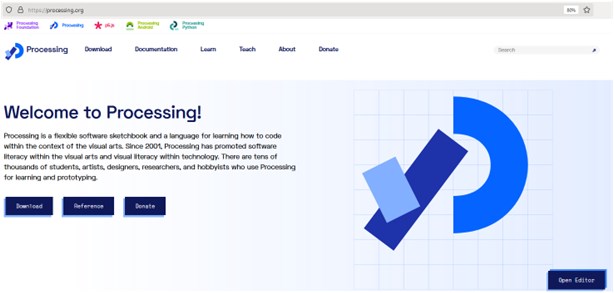
Working with Processing
Processing is a flexible software sketchbook and a language for learning how to code within the context of the visual arts. Since 2001, Processing has promoted software literacy within the visual arts and visual literacy within technology. There are tens of thousands of students, artists, designers, researchers, and hobbyists who use Processing for learning and prototyping.
My instructors from Fablab Kamakura give great examples to learn how to use processing by these steps:
- Getting Started with Processing
then…
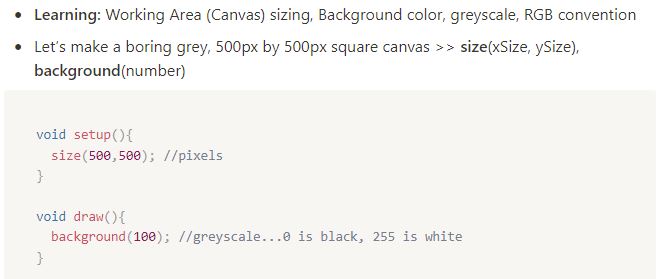
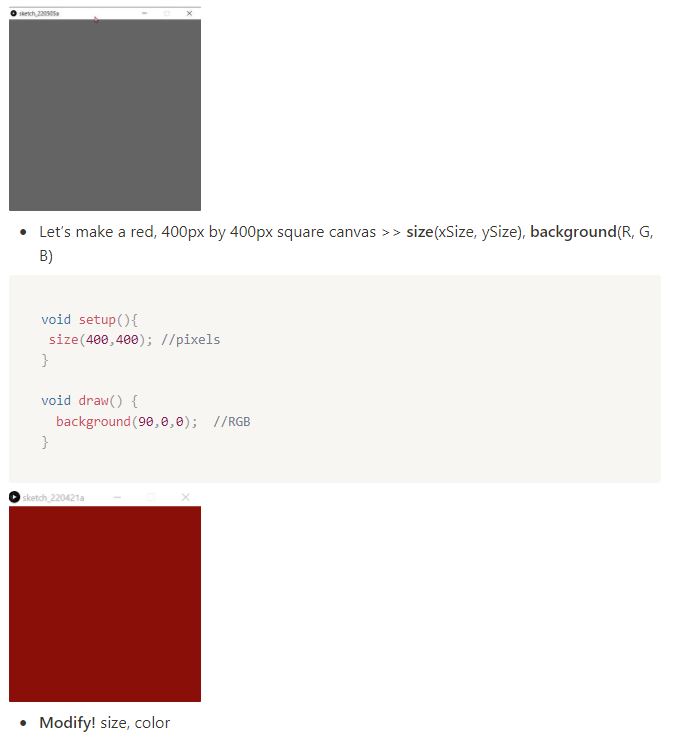
- Make a Colorful Canvas
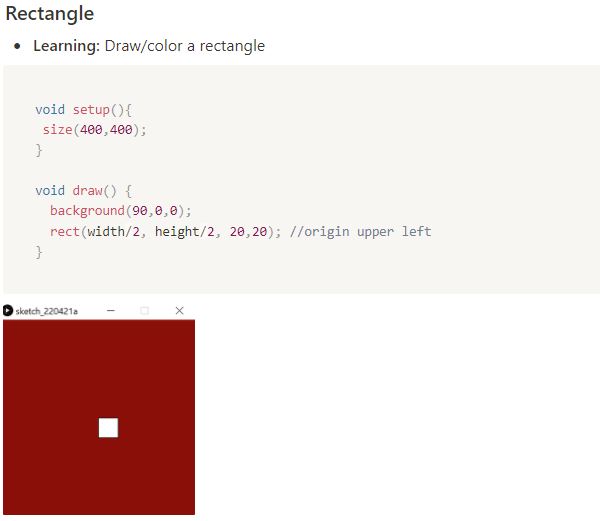
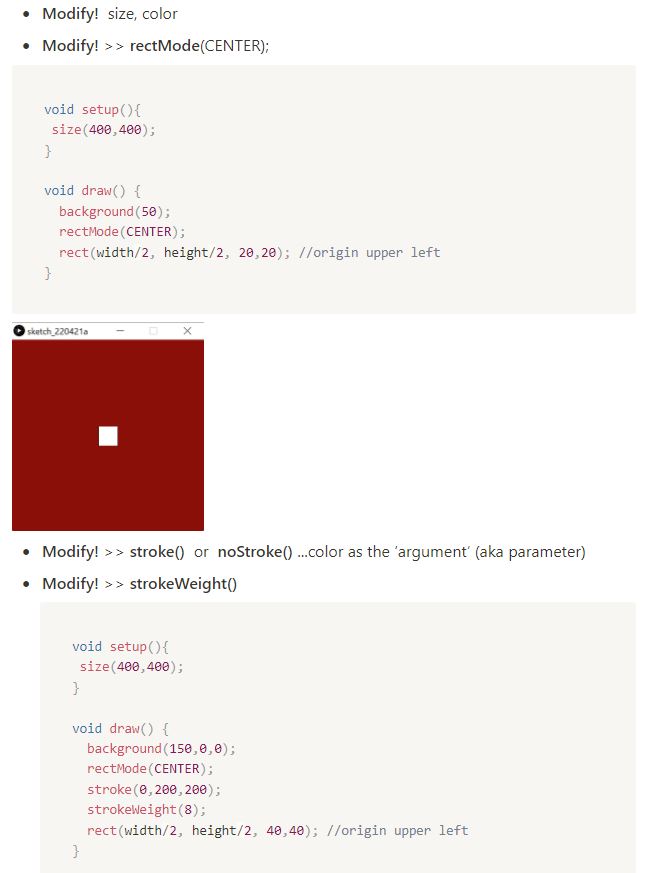
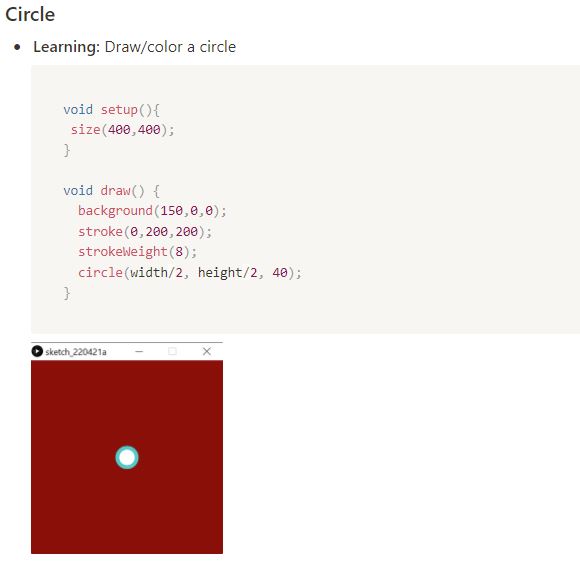
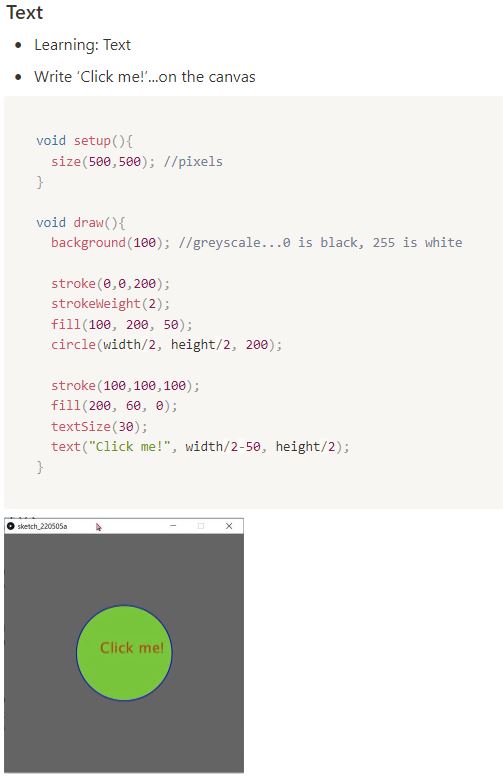
- Draw Shapes & Text
- Mouse Events –> Processing > Arduino…the INPUT scenario
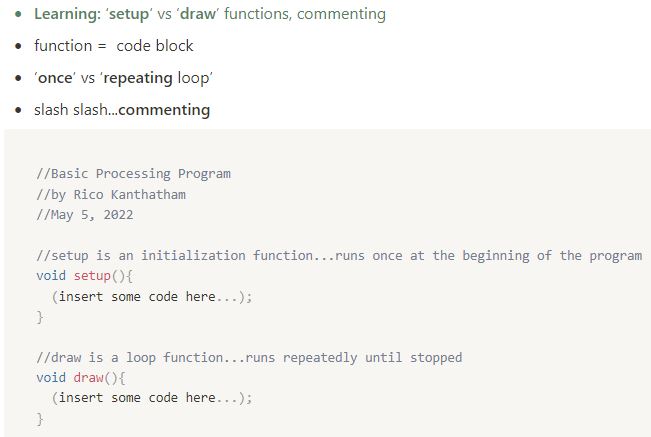
//Basic Processing Program
//by Rico Kanthatham
//May 5, 2022

//setup is an initialization function...runs once at the beginning of the program
void setup(){
  (insert some code here...);
}

//draw is a loop function...runs repeatedly until stopped
void draw(){
  (insert some code here...);
}
Rectangular
import processing.serial.*;

import processing.serial.*;

Serial mySerial;

String myString = null;
int nl = 10;
float myVal;

void setup(){
  size(600,400);

  mySerial = new Serial(this, "COM6", 9600); //type your port name in the middle
}

void draw(){

 while (mySerial. available() > 0) {
   myString = mySerial.readStringUntil(nl);

   if (myString != null){
   background(138,239,15); //change the color
   myVal = float(myString);

   myVal = myVal/200* height;

  rectMode(CENTER);
  fill(239,239,15);
  rect(width/2, height-(myVal/2), 200, myVal);
}
 }
  }
Circle
import processing.serial.*;

import processing.serial.*;

Serial mySerial;

String myString = null;
int nl = 10;
float myVal;

void setup(){
  size(700,450);

  mySerial = new Serial(this, "COM6", 9600); //type your port name in the middle
}

void draw(){

 while (mySerial. available() > 0) {
   myString = mySerial.readStringUntil(nl);

   if (myString != null){
   background(220,239,15); //change the color
   myVal = float(myString);

   myVal = myVal/200* height;

  rectMode(CENTER);
  fill(239,15,164);
  // rect(width/2, height-(myVal/2), 200, myVal);
  circle(width/2, height/2, myVal*1.5);
}
 }
  }
Learning Outcomes
From this assignment, I am be able:
-
Learning how to connect Arduino IDE and Processing, then its simple of programming.
-
The important of data visualization from our boards and sensor to represent the system, analysis, and interpretation.
-
Interpret and implement design and programming protocols to create a Graphic User Interface (GUI)