Itan Fuentes Santamaria
Email: itan.fs@hotmail.com
Phone: 2227535416


For this assignment we are going to make an application, as engineer i wanted to use Matlab for graphic representation of input data from an Arduino, i've never do this before and have to say it was not so hard but it's a large process
first we have to connect the potenciometers in the arduino, following the next image
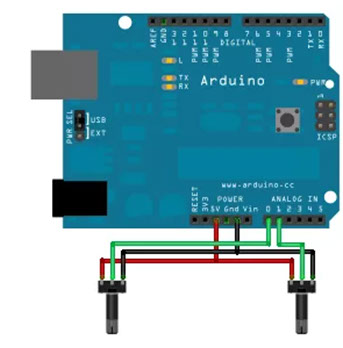
we most not forget to connect all the grounds to the same ground. the data transmission will be by USB directly from the arduino to the computer, this means, it use serial comunication.
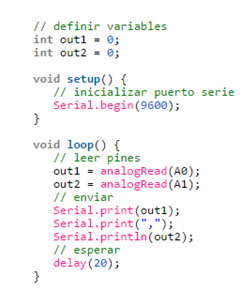
The code to use it's the next one
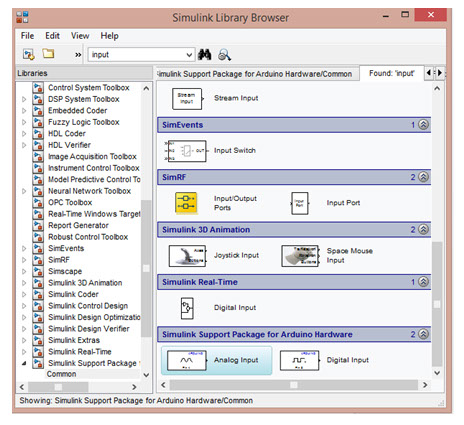
After setting up your Arduino, the data is sent via the USB connection itself, but simulating a serial port (from the Arduino interface itself can be determined). In this case, in the Windows environment, the port is COM4. For this, the Matlab Simulink R2014a was used with the Arduino library, previously downloaded. After opening the menu Similink Arduino, you must insert two analog inputs of the Arduino card being used (one for each sensor). These are in the Simulink Libray Browser menu,
Then, seek "scope" in the same menu, which will show in a window the behavior of the signals emitted by each potentiometer. This should be attached to the input ports of the Arduino as shown
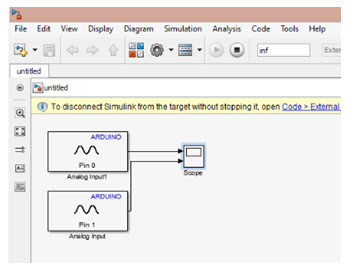
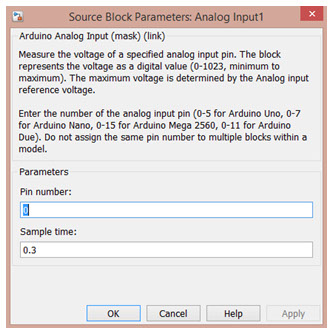
You need to reference each Arduino entries (inputs) to the corresponding pin in where they connected each of the potentiometers. Earlier it had said were the A0 and A1 analog portstherefore they were here assigned the number 0 and the number 1 as corresponding pins. For this, you should only take double click on each of the blocks of tickets and write the name in the window that appears. It should also introduce the reading time. This is based on the reading speed required and possible Arduino card. In this case it was 300 ms.
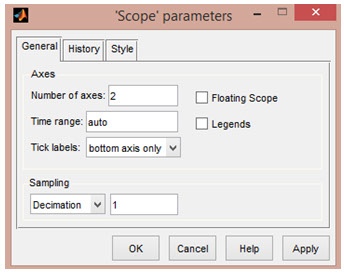
Next, set the scope to receive and display signals from the two input ports of the Arduino. Just double click on the scope and click on the "scope parameters" option, then emerge a window that says "number of axes". It is there that should be written the number of entries to be the scope. In this case two, one for each potentiometer.
After setting all this, just set the runtime in the top taskbar as infinity (inf to be written), as well as the data source, and external. now you have to run the program having already Arduino connected to the PC

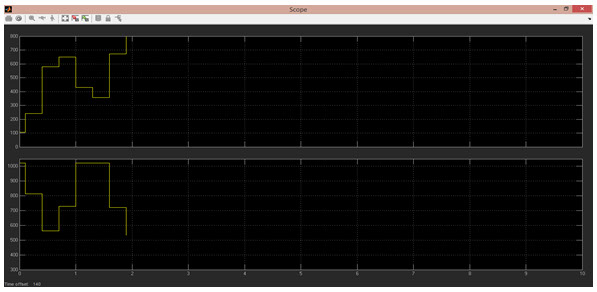
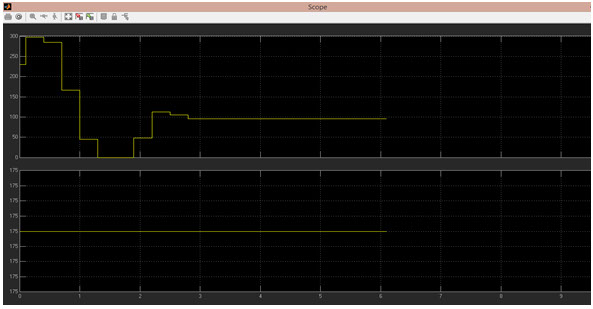
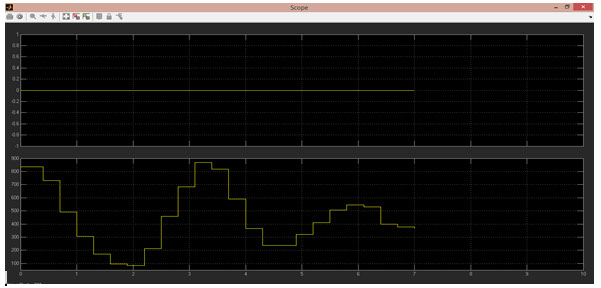
Finally the results obtained and the signals received by the program are shown in the figures. These signals are generated by the potentiometers, shown in the Scope of MatLab and sent by the Arduino Mega 2560 via the serial port
I have to say that after setting all the things correctly, this was really interesting because we can observe in real time with graphics the behavior of sensors or something else, hope someone can use this